This article is brought to you by Datawrapper, a data visualization tool for creating charts, maps, and tables. Learn more.
Data Vis Dispatch, July 23
The best of last week’s big and small data visualizations

Welcome back to the 152nd edition of the Data Vis Dispatch! Every week, we publish a collection of the best small and large data visualizations we find, especially from news organizations — to celebrate data journalism, data visualization, simple charts, elaborate maps, and their creators.
Recurring topics this week include Biden’s exit from the U.S. presidential race, the upcoming Olympics, and renewable energy.
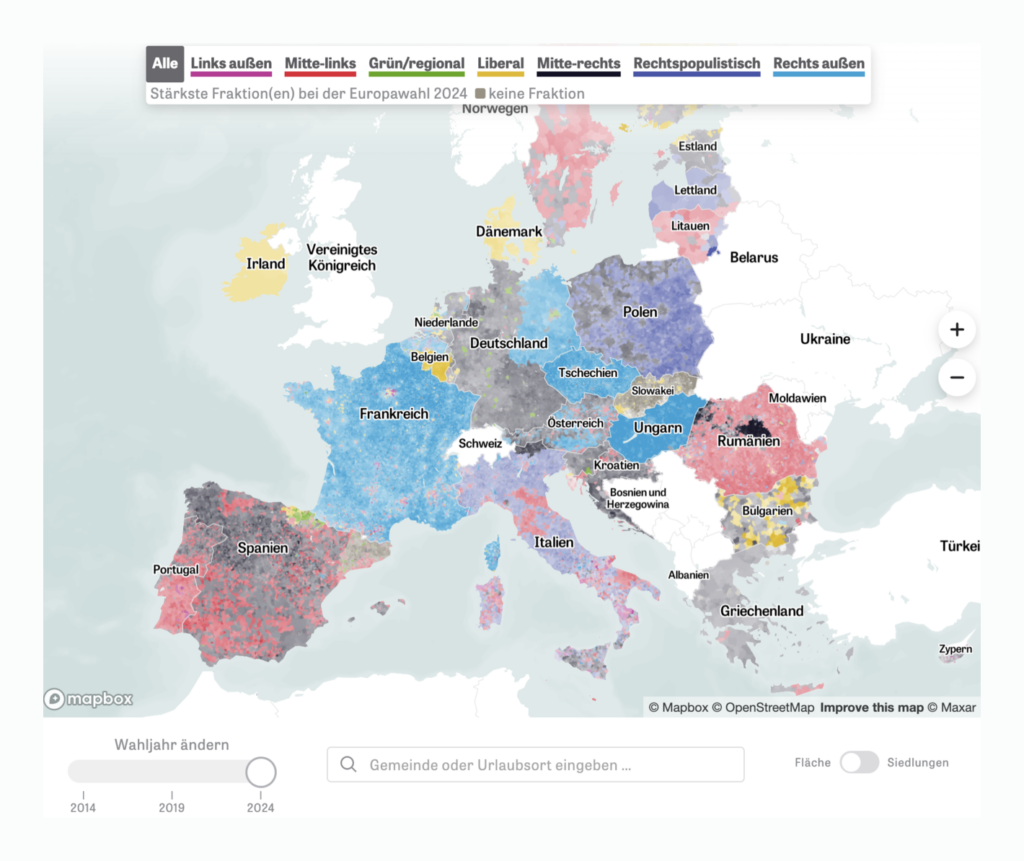
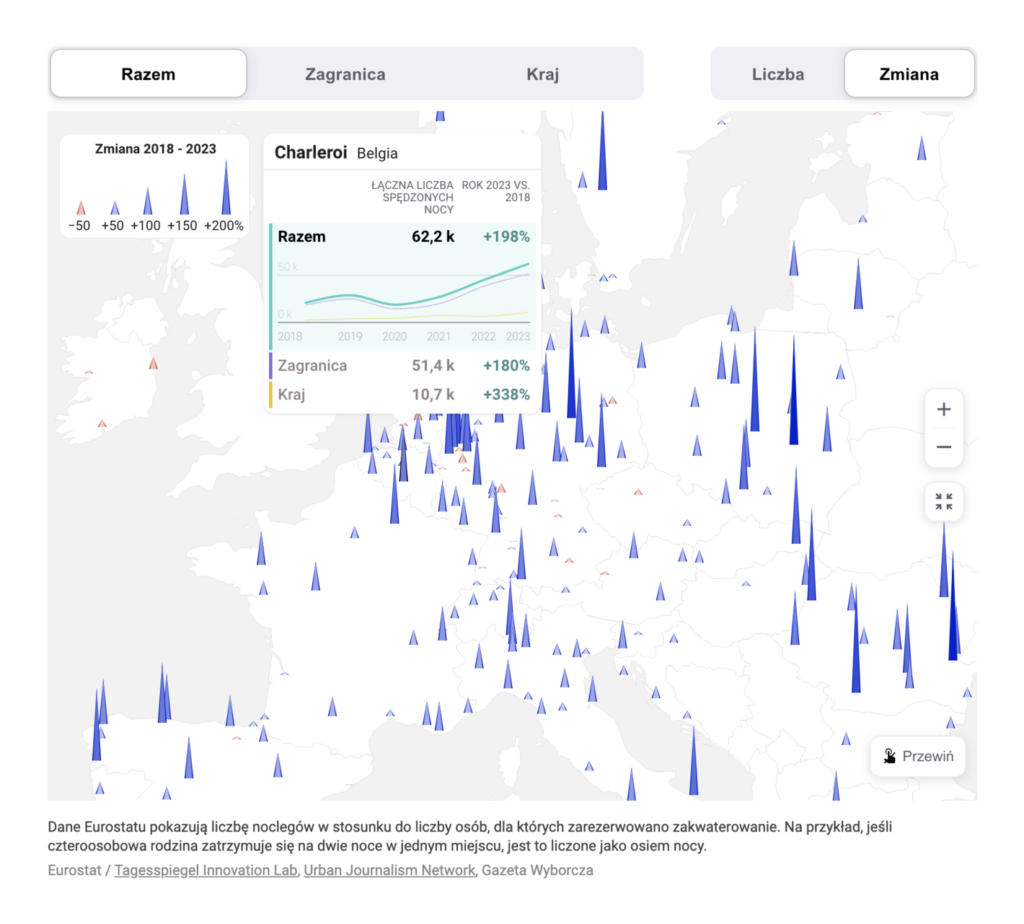
But let’s start this Data Vis Dispatch with two maps of Europe. Zeit Online gave us what is probably the most detailed electoral map of Europe, with 83,255 local units analyzed. And while Paris remains the main tourist destination after the pandemic, we see an increase in bookings for smaller cities:
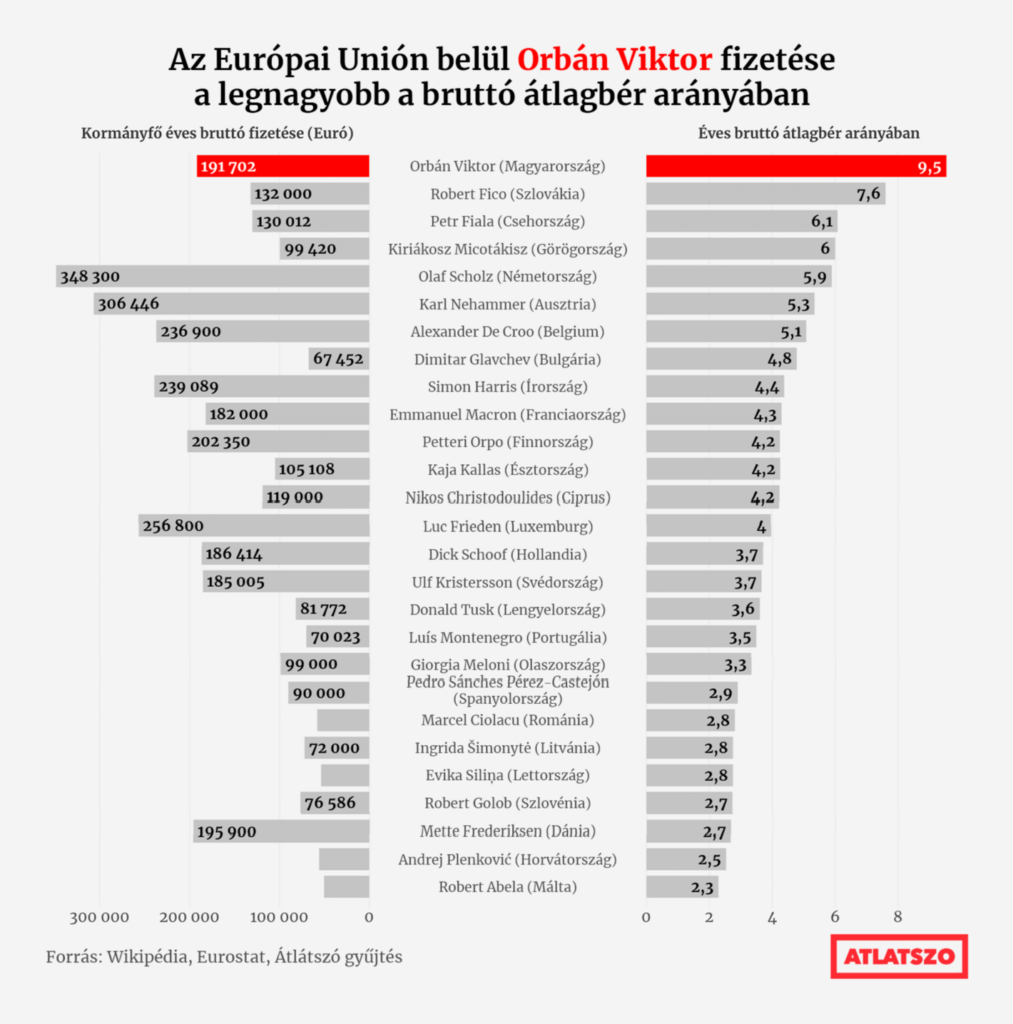
Among EU leaders, Viktor Orbán is the most overpaid relative to the average salary in his country:
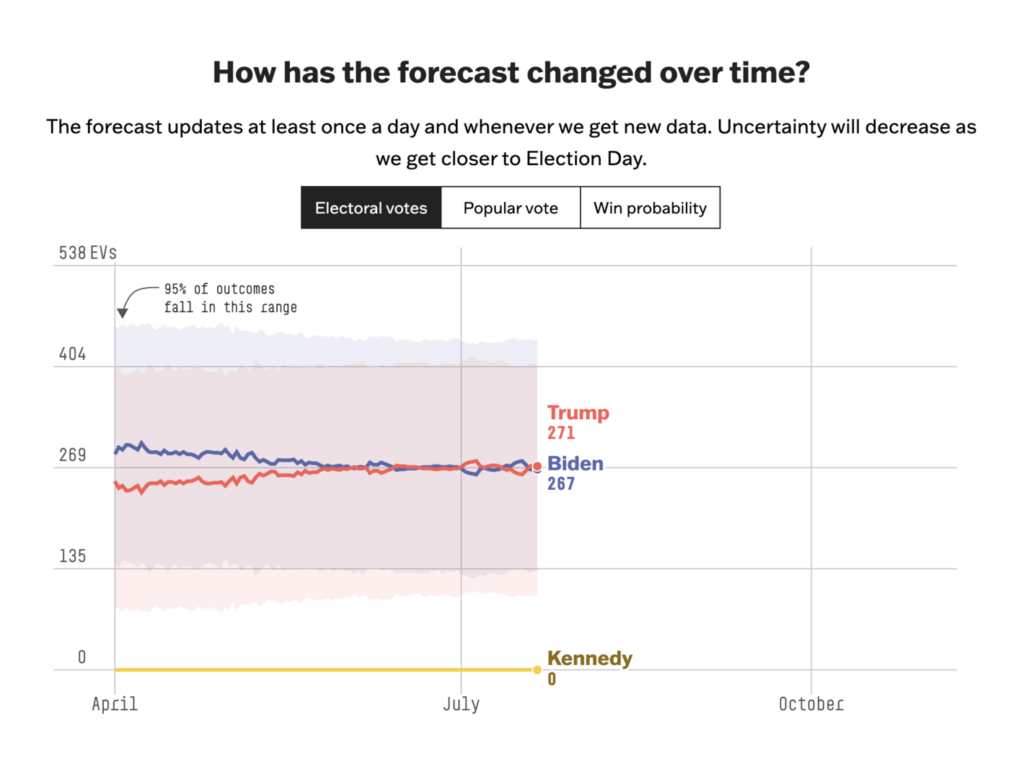
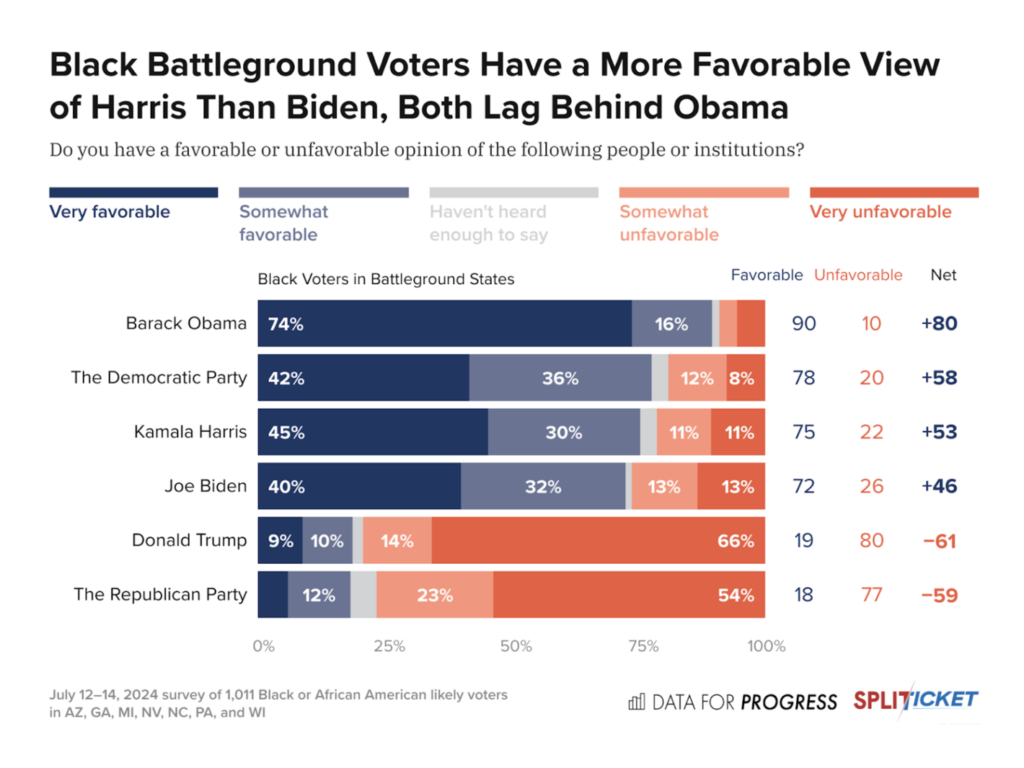
Oh boy, elections in the U.S., right?! Biden has dropped out of the presidential race and is backing Kamala Harris. But let’s back up a bit. Earlier this week we saw a debate about election forecasting models, with Nate Silver of the Silver Bulletin criticizing the FiveThirtyEight model:
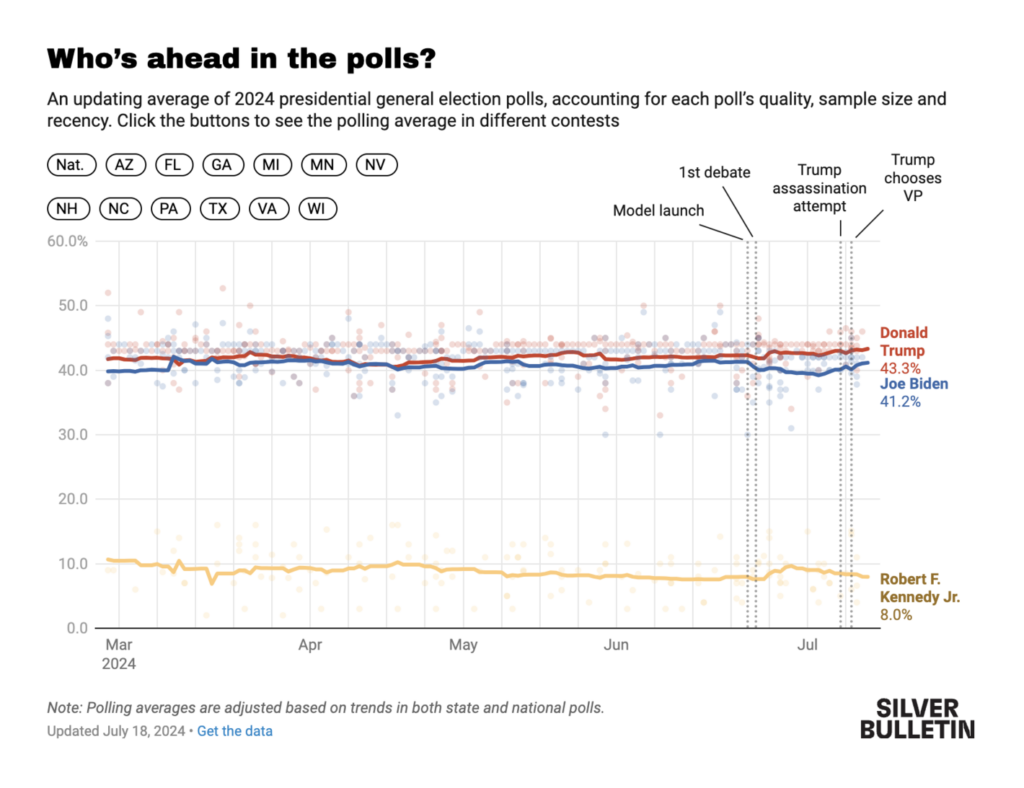
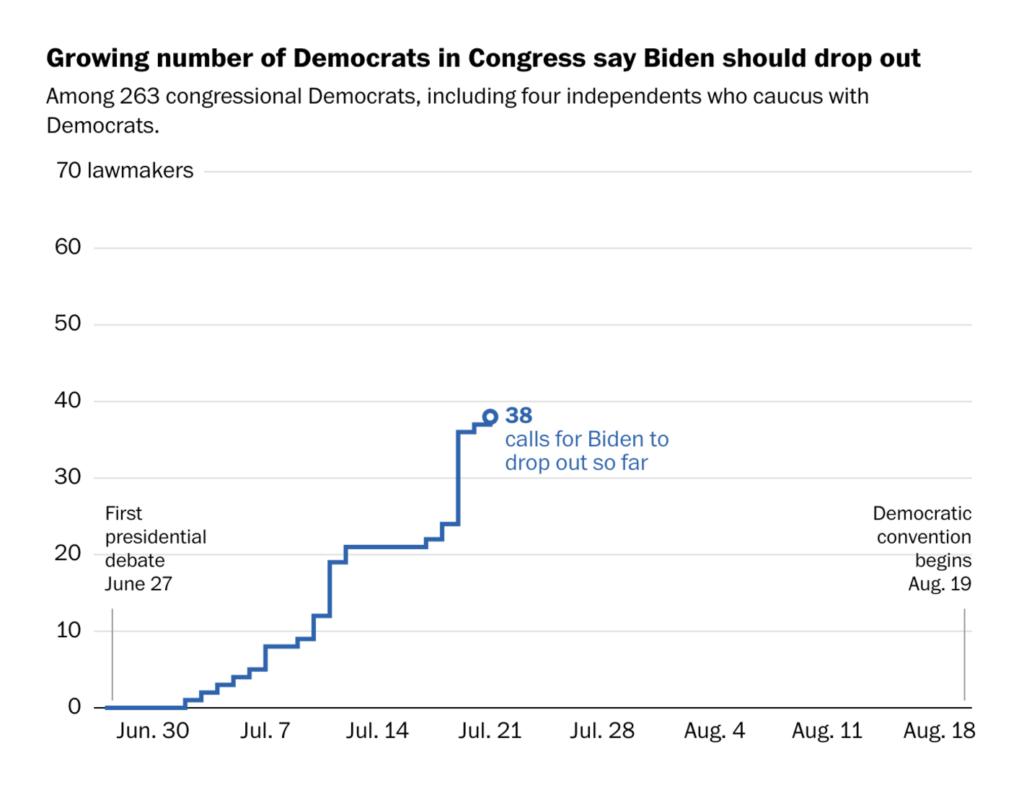
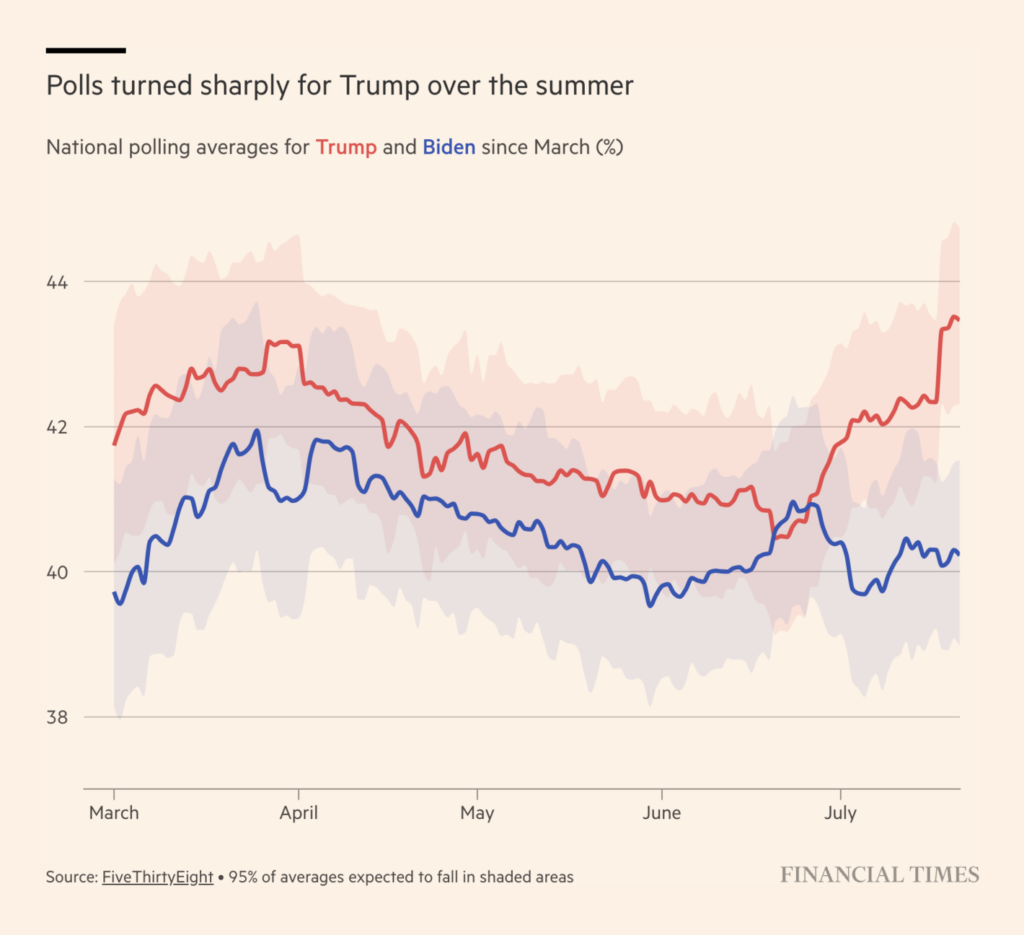
After a disastrous debate on June 27, Biden came under increasing pressure from his own party as concerns about his age and performance grew:
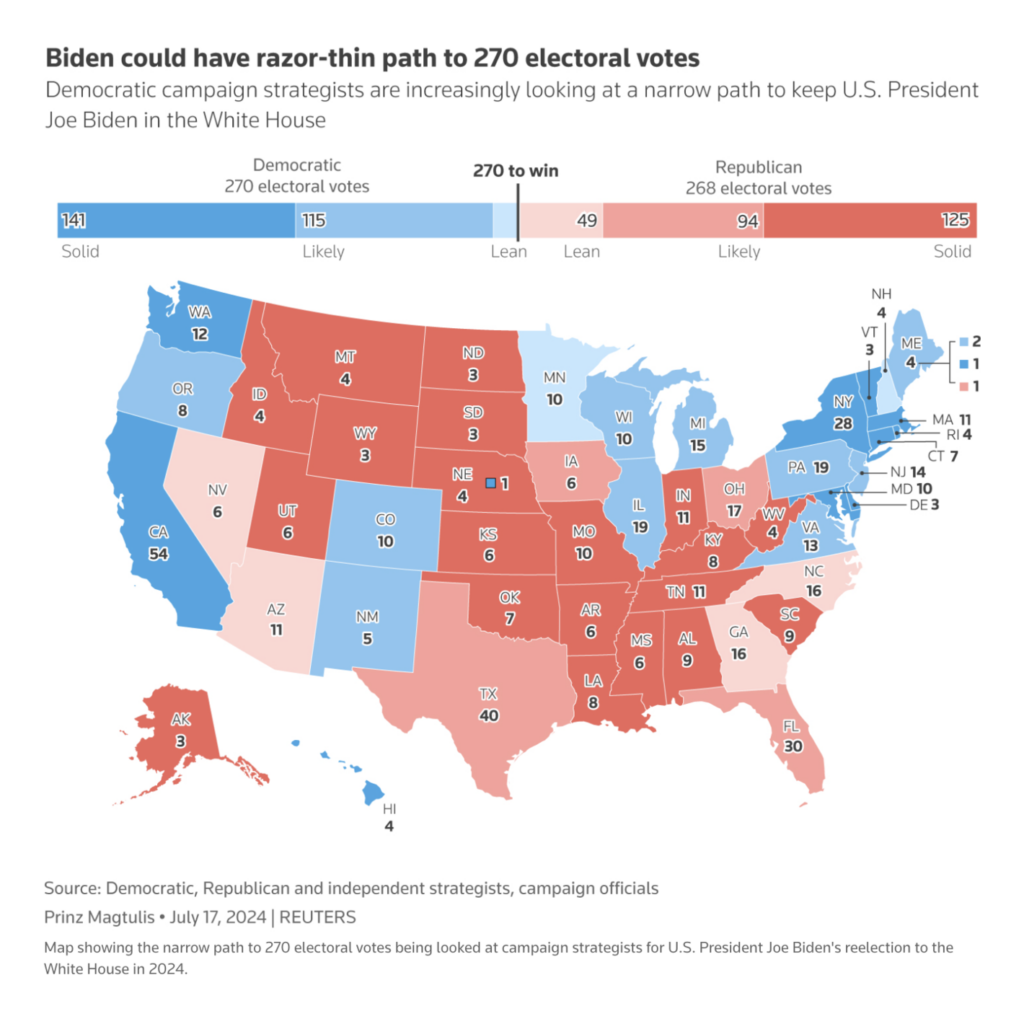
The polls reflected these concerns. The path to a possible Biden victory was narrowing:
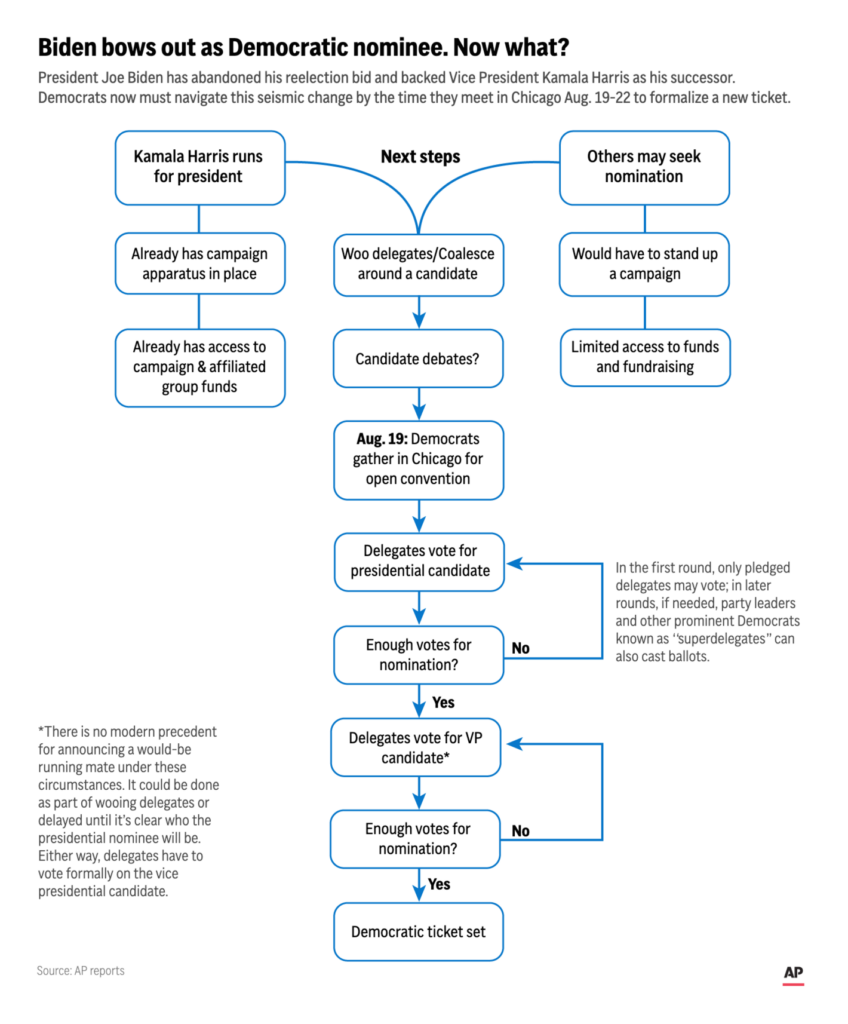
Then this Sunday, Biden announced that he would end his campaign for reelection. What happens next for the Democrats? We’ll sneak this small explanatory graphic in with the data visualizations to help make sense of the situation:
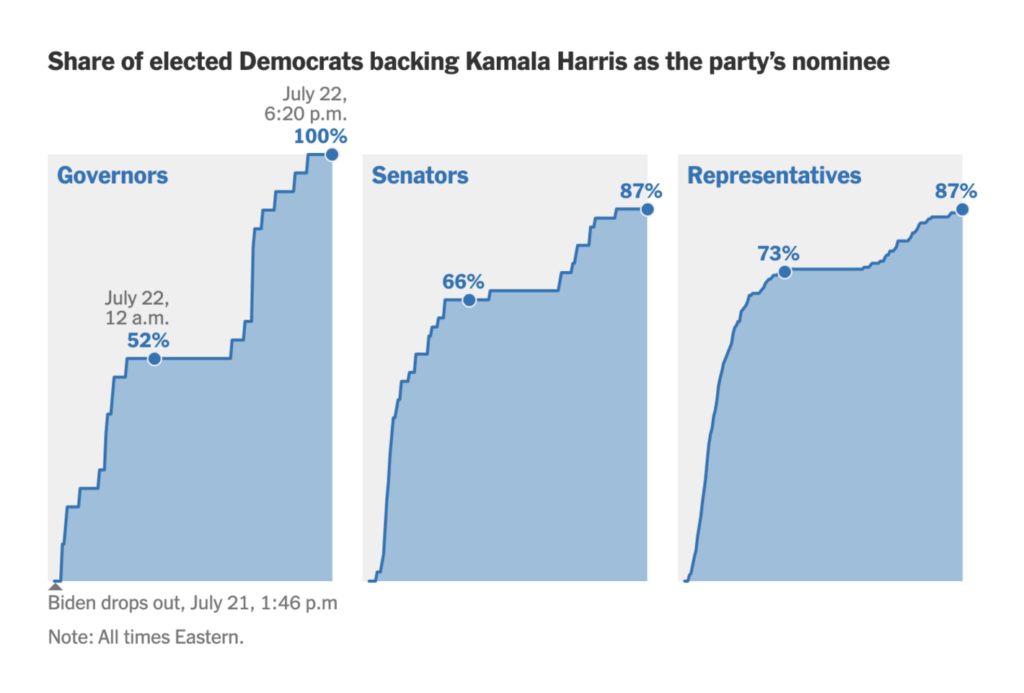
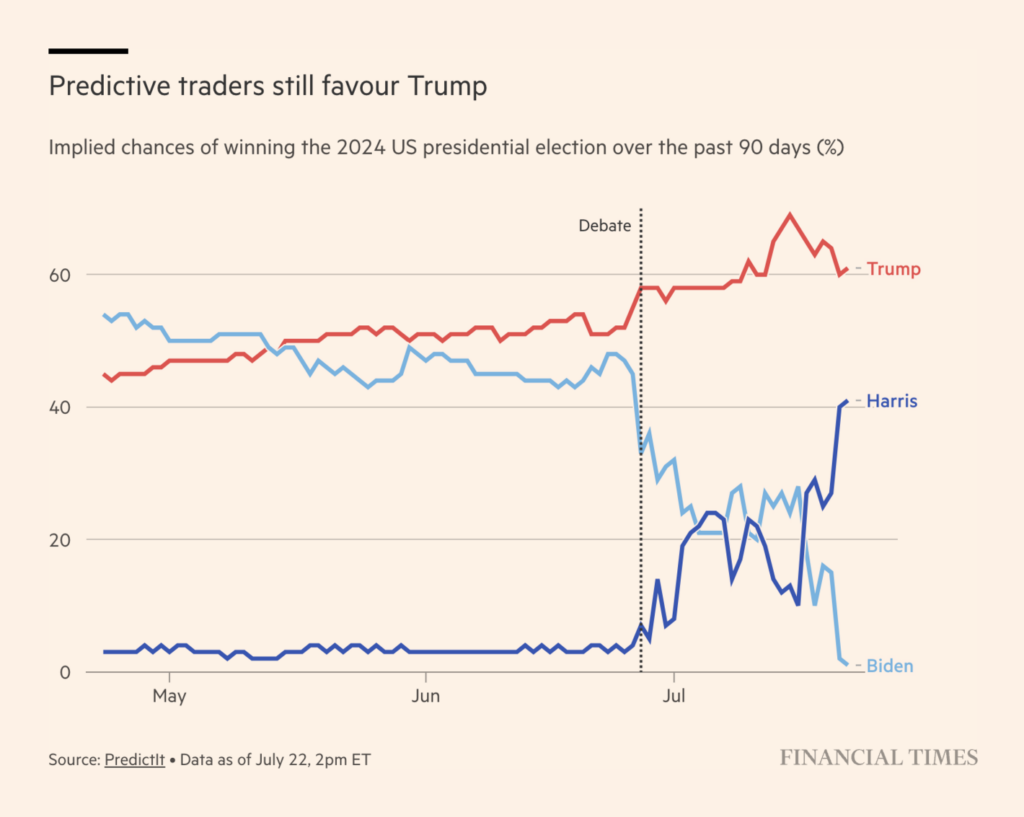
Biden is supporting his vice president, Kamala Harris, who has wasted no time in launching her presidential campaign. Most Democrats in Congress and all Democratic governors support her. However, traders on PredictIt still see Trump as the favorite to win:
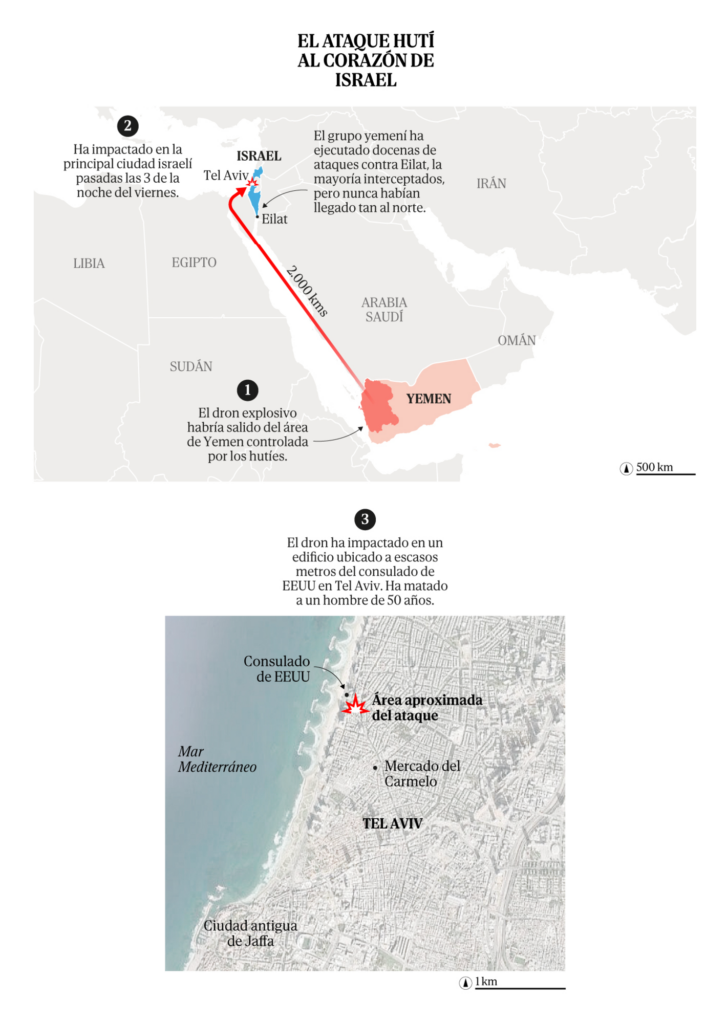
Continuing our world tour, let’s turn to Israel, where a Houthi attack on Tel Aviv led to a wave of Israeli airstrikes on the Houthi-controlled port area of Hodeidah in Yemen. Plus, a visual assessment of the Israeli attack on Gaza on July 8:

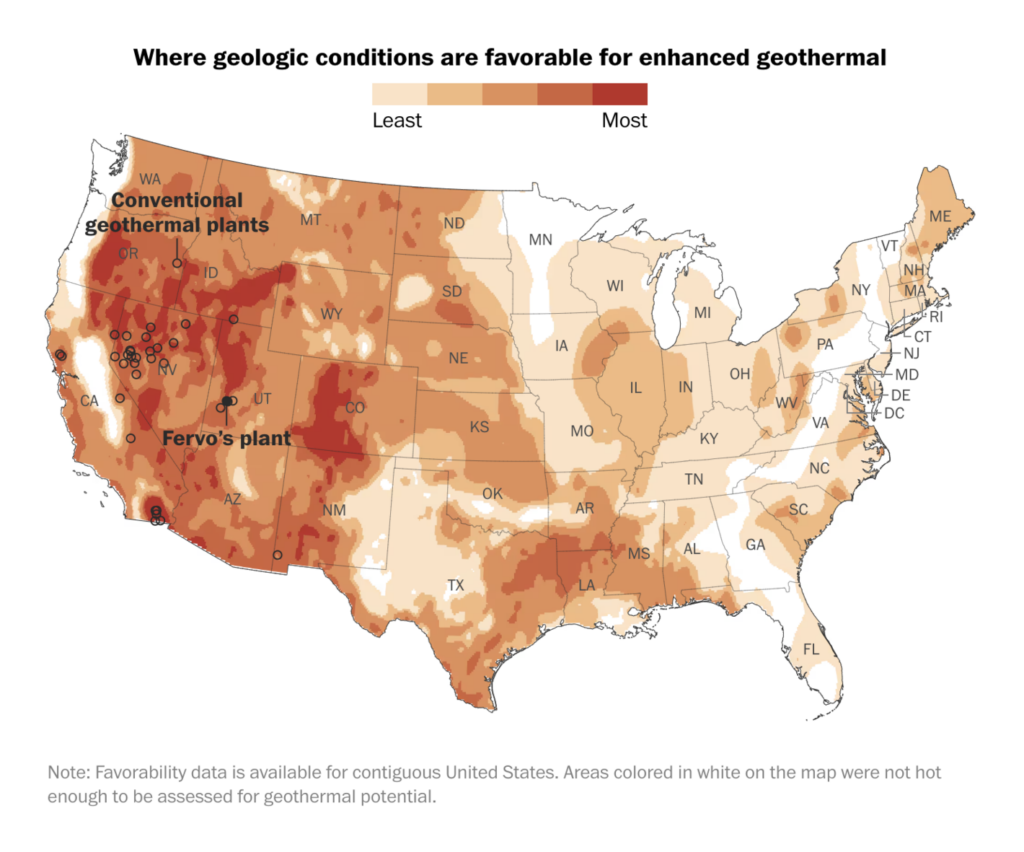
Clean cut to clean energy, where Brazil is leading among G20 countries. Across the world, most new power plants in 2023 will be for renewable sources, and there’s a good chance that geothermal energy will grow in the United States:

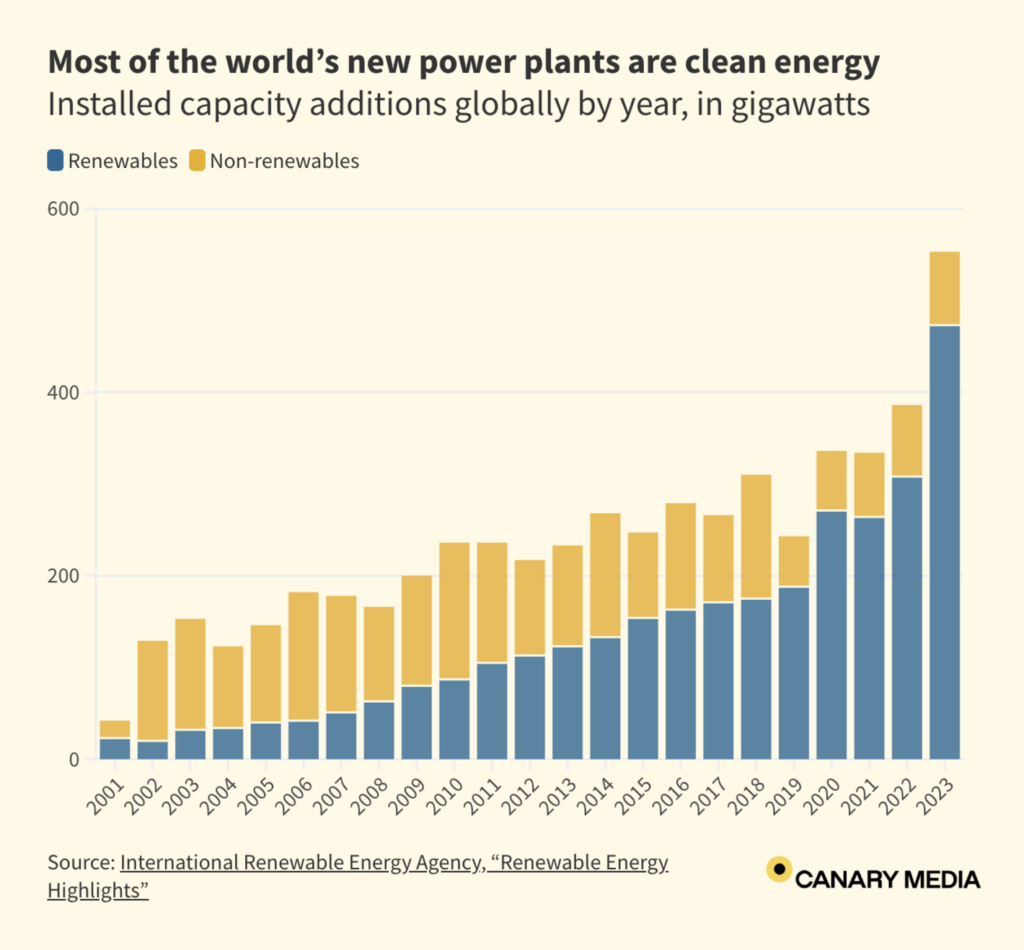
Canary Media: Chart: 85% of new electricity built in 2023 came from renewables, July 19
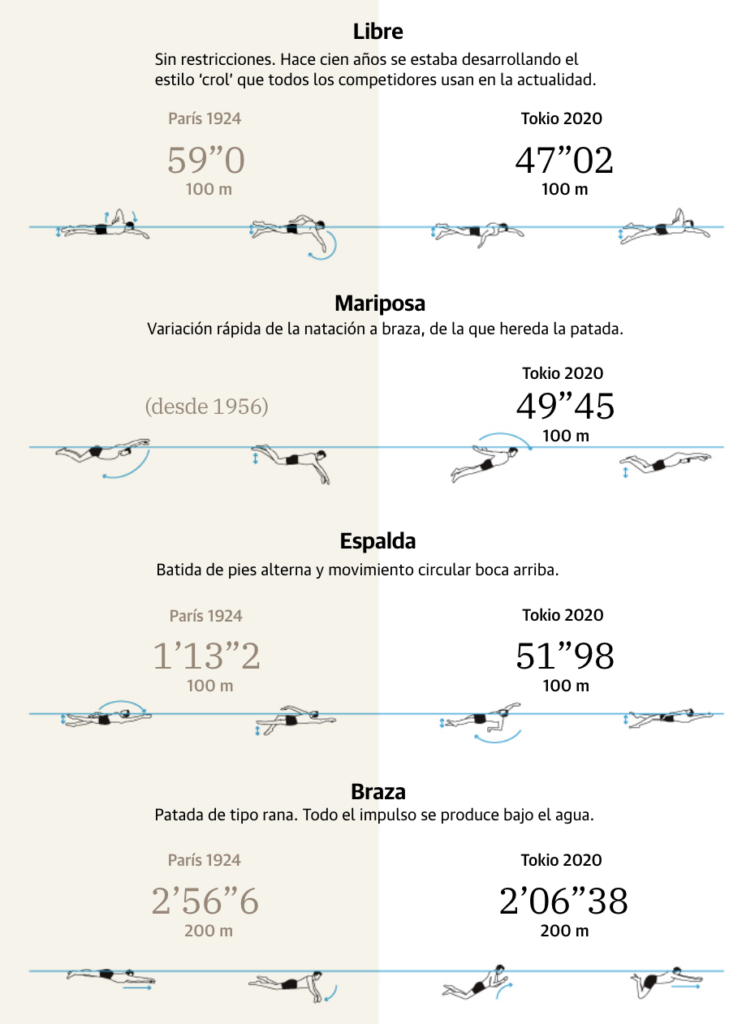
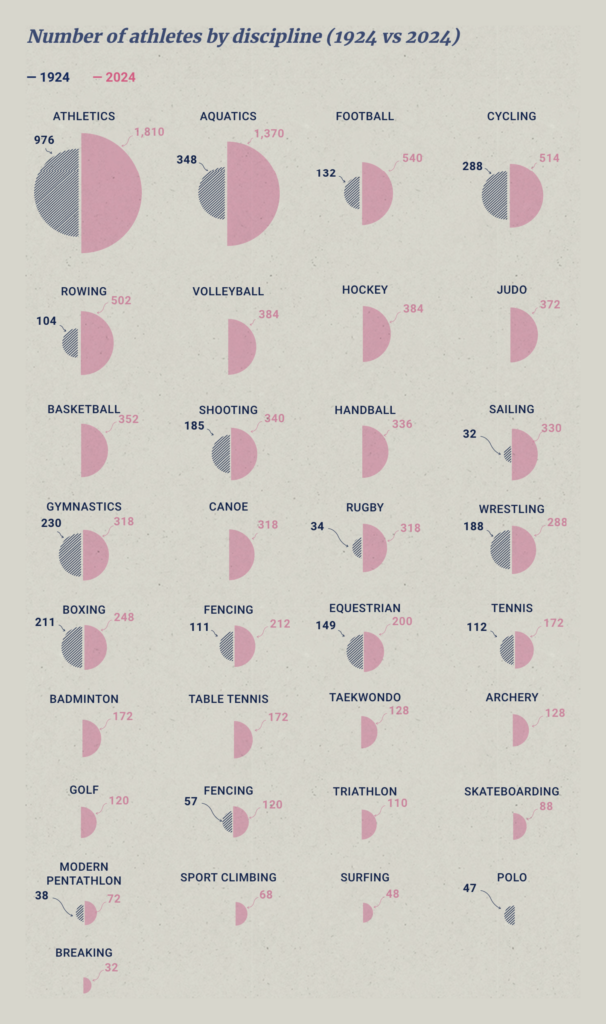
This Friday marks the start of the Olympic Games, always a big season for data visualizations. Among the first are these two looking back to the last Paris games, exactly 100 years ago:
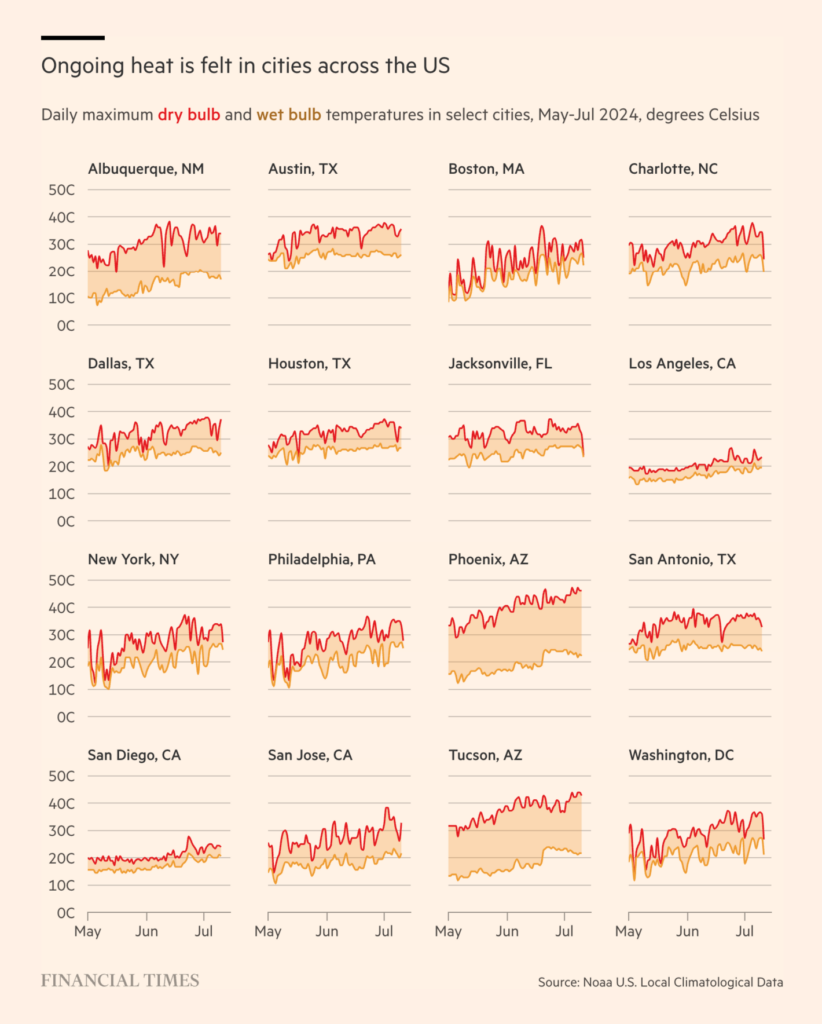
The Olympics have inspired a series of new climate stripes, demonstrating why it’s increasingly difficult to hold games in the familiar summer locations. But it’s not only hot in Paris:
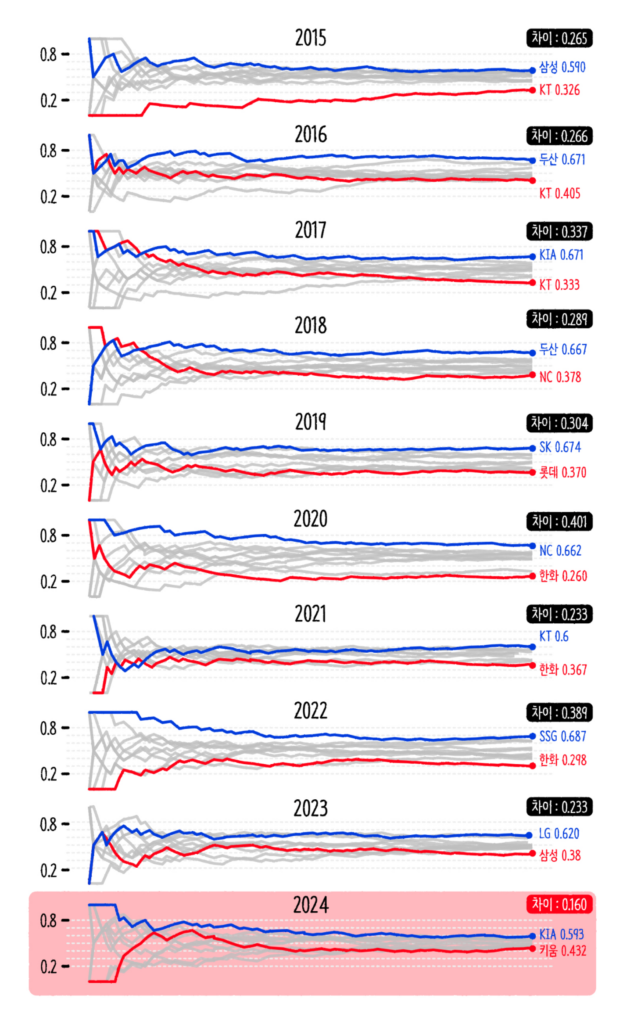
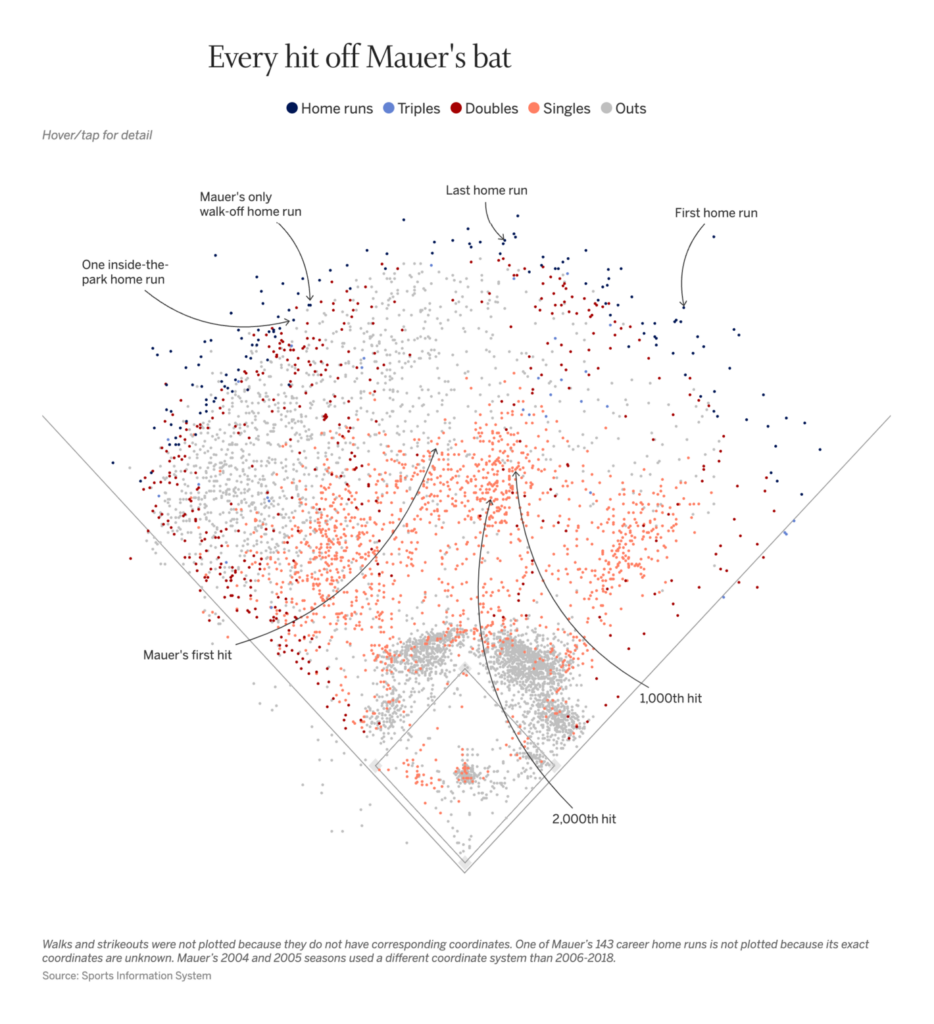
Did you know which sport has the longest professional history in South Korea? Baseball! And recently the game has been gaining new momentum, as data shows that the teams have equalized. Plus, a data visualization all about one baseball player, Joe Mauer:
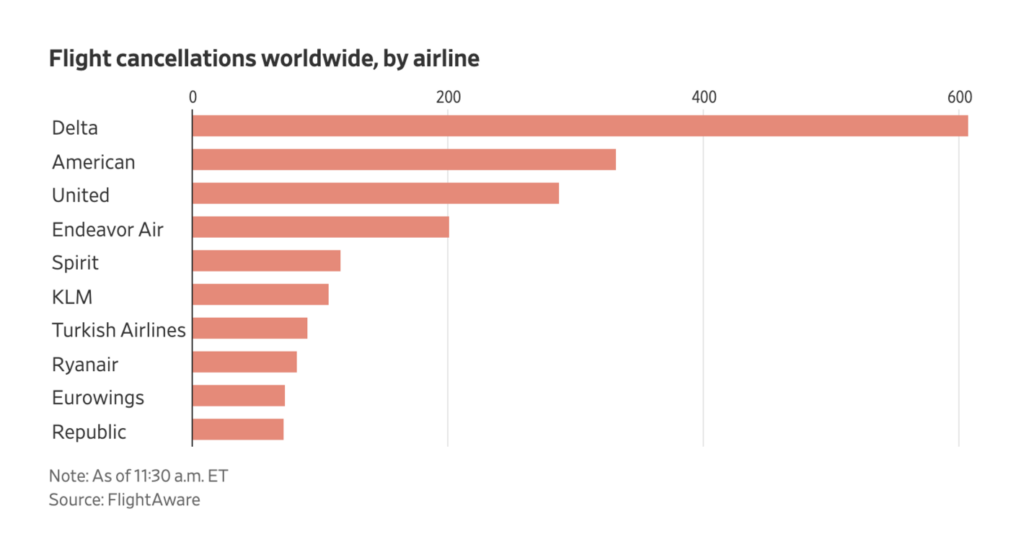
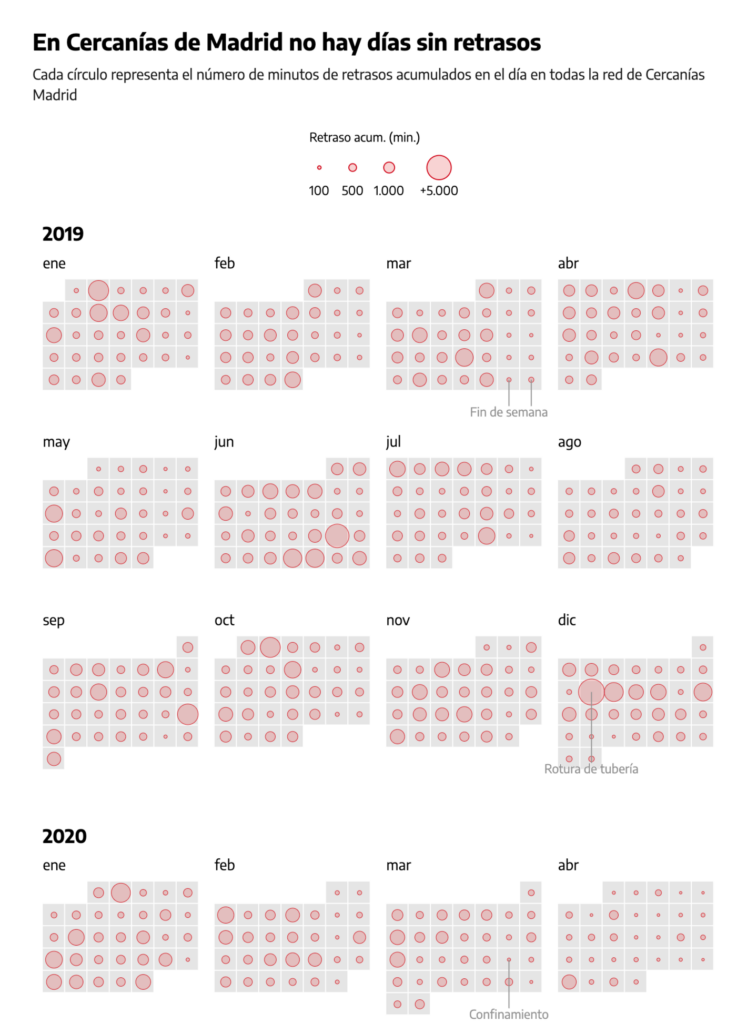
A CrowdStrike update caused a global IT outage for Microsoft users, resulting in flight cancellations among other forms of chaos. Also in traffic, Madrid’s commuter trains haven’t gone a day without disruptions since 2019:
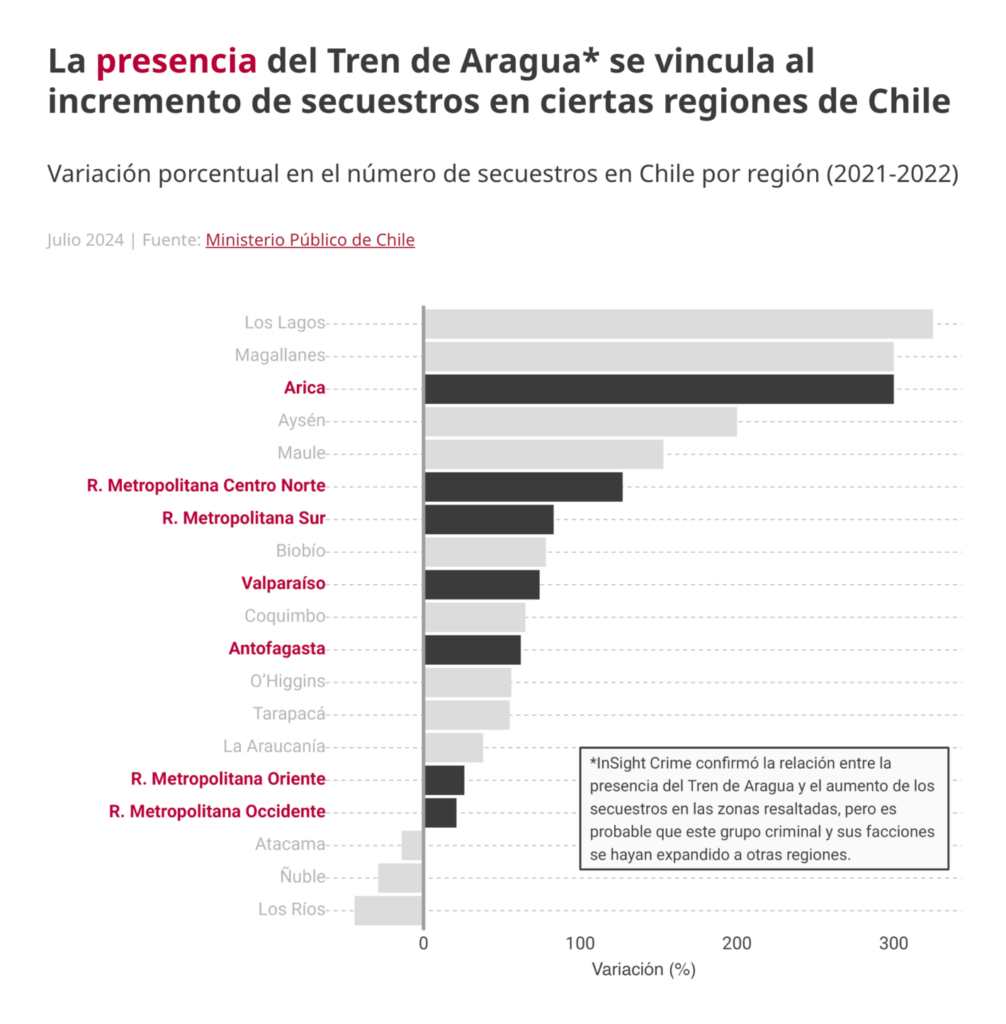
We end this dispatch with kidnappings in Chile, the troubled history of the Albertsons grocery store chain in the U.S., and immigration worldwide:
What else we found interesting

Applications are open for…
- Article pitches for Works in Progress
Help us make this dispatch better! We’d love to hear which newsletters, blogs, or social media accounts we need to follow to learn about interesting projects, especially from less-covered parts of the world (Asia, South America, Africa). Write us at hello@datawrapper.de or leave a comment below.
Want the Dispatch in your inbox every Tuesday? Sign up for our Blog Update newsletter!


Comments