

New: Keep your account secure with two-factor-authentication
March 27th, 2024
3 min
This article is brought to you by Datawrapper, a data visualization tool for creating charts, maps, and tables. Learn more.
If you’re creating lots of US maps with Datawrapper, our newest maps will extend your possibilities by far. We now offer Congressional Districts maps and Court Districts maps on a US national level and a state level; plus State Legislative Districts Upper and Lower maps (on a state level):
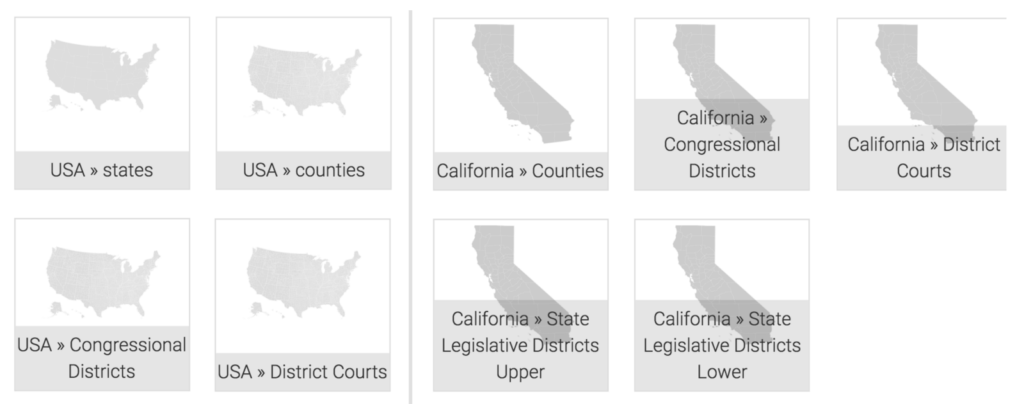
If you’re not a US expert and have no idea what that all means and what you could use these maps for (like me), here are short explanations of all three new map types:
There are 435 congressional districts in the US, and each of them elects one representative for the United States House of Representatives. The last time that happened was at the US Election in November 2016, and it looked like this:
But the next election is just around the corner (well, ok, in more than a year): The Midterm elections. While the president is elected for four years, the House of Representatives in the US is only elected for two years – and so on the 6th of November, 2018, expect to use the Congressional District map to show who got into the US house and who didn’t (like Politico did here for the 2016 Election.)
The exciting thing about the Congressional Districts is that each of the districts represents the same amount of people; approx. 711,000 people. That means that very population-heavy areas like cities have tiny Congressional Districts; and the other way round. We can easily spot the cities on the map because they are represented with lots of small Congressional districts.
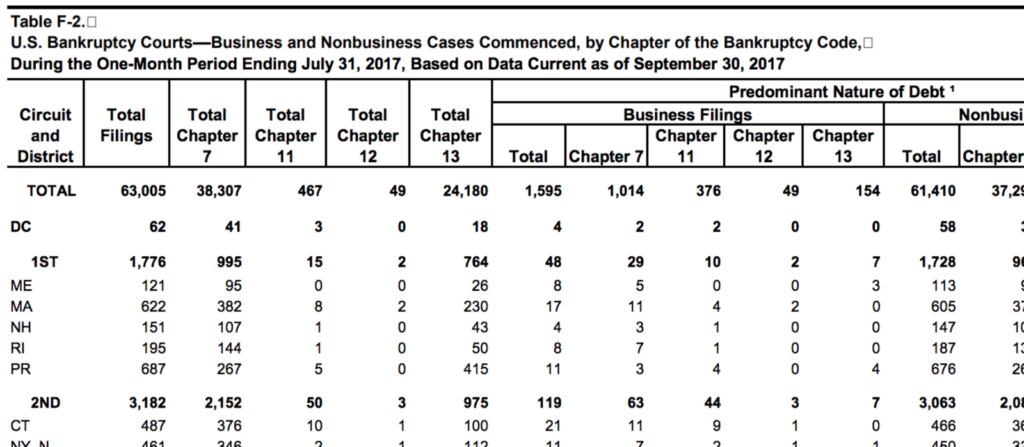
The district courts are the trial courts of the US. The US has 94 of these courts, and so the US is divided into 94 “district court districts”, or judicial districts, that determine which court is responsible for you. UScourt.gov publishes all sorts of data on this district level: Criminal data like violent homicide, robbery or fraud; but also bankruptcy filings:
Now it gets political again: Each US state has an upper house (the State Senate) and a lower house (the State House or Assembly). The State Legislative Districts give us the areas from which representatives are elected to these two houses. For example, New York State has 63 representatives in its upper house and 150 representatives in its lower house. Like the Congressional Districts, the State Legislative districts are drawn in a way that they all have roughly the same population.
So when should you use these State Legislative District maps? Well, if you need them, you probably already know. They’re mostly interesting for the media in US states that want to talk about the election results on a local level.
Implementing these Datawrapper maps was possible thanks to Ballotpedia. We have a long list of maps that clients would love to see in our tool. To create priorities and to speed up the process, users can sponsor maps: You pay a small amount of money (like Ballotpedia did), the map gets online as soon as possible, and every Datawrapper user can use it. If you’re interested in that option or have any other questions or suggestions, please write us @datawrapper or contact support@datawrapper.de.


Comments