New: Small multiple column charts in Datawrapper
February 18th, 2025
6 min
Datawrapper lets you show your data as beautiful charts, maps or tables with a few clicks. Find out more about all the available visualization types.
Our mission is to help everyone communicate with data - from newsrooms to global enterprises, non-profits or public service.
We want to enable everyone to create beautiful charts, maps, and tables. New to data visualization? Or do you have specific questions about us? You'll find all the answers here.
Data vis best practices, news, and examples
250+ articles that explain how to use Datawrapper
Answers to common questions
An exchange place for Datawrapper visualizations
Attend and watch how to use Datawrapper best
Learn about available positions on our team
Our latest small and big improvements
Build your integration with Datawrapper's API
Get in touch with us – we're happy to help
This article is brought to you by Datawrapper, a data visualization tool for creating charts, maps, and tables. Learn more.

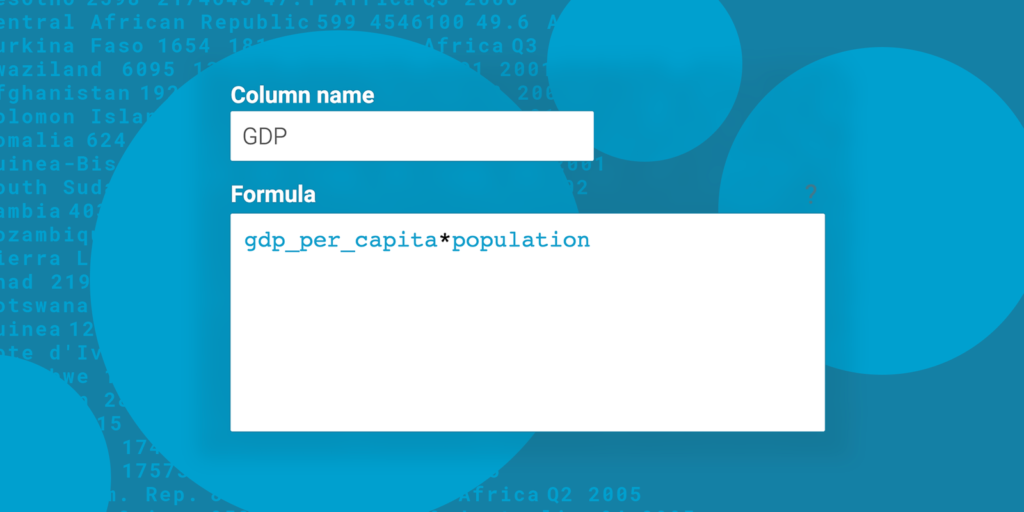
We’re happy to announce that we replaced the old JavaScript-based formulas you had to type when adding a column with a syntax that’s closer to Excel or Google Sheets.
Let’s see what that means.
For a few years now, you could add columns in step 2: Check & Describe when creating a Datwrapper chart. They could help you sum up columns, replace or split text, deal with dates, create random numbers, and do a dozen things more. All this is still possible – we just made it easier to use.
Say you uploaded a column called “values” to the Datawrapper chart editor. Now you want to multiply it with itself, five times. So you go to step 2: Check & Describe and click on “Add column”. Last week you then had to type in Math.pow(values, 6), a JavaScript formula. Now you can simply type values ^ 6.
You can find the full list of expressions in our Academy.
Here’s an overview of what changed and what didn’t:
You don’t need to type JavaScript code anymore. If you know Excel or Google Sheets, you won’t have trouble using our “Add column” feature. Here are two examples:
Math.round(values*10)/10, you can now type ROUND(values, 1)&& and || in your IF statements, you can now use the simpler and and or.You can now add a column and include columns in your calculations that you calculated earlier.
The video at the top shows an example: We first create a column called gdp and then use that column in an IF statement to create the column small economy?.
We’re trying to save you some time, so each number column comes with aggregated values. For example, to get a column with the minimum value of your column percentchange, you can write percentchange__min. Datawrapper also supports __max, __sum, __mean and __median.
This can be helpful for conditions:
IF(salary > salary__mean, "earns more than the average", "earns less than the average")The expression above gives you a column that shows whose salaries are greater or smaller than the average one.
Your added columns adapt to your data. Say your Datawrapper chart links to a CSV or Google Sheet and the data changes. Or you paste new data in step 1. In both cases and as long as the column headers stay the same, the calculations will run again on the new data. Your added columns will always show the correct numbers.
To add a new column yourself and explore how they work, hover over the following chart and click “Edit this chart” in the top right corner. This will bring you into step 3: Visualize. Now go back to step 2, and you will see that we already added two new columns. Play around with them or add more:
You might have added columns and calculations in the past. These charts will still work correctly: We changed your formulas to make them work with the new syntax. In case something still looks unexpected, please let us know at support@datawrapper.de and we’ll fix it as soon as possible.
We hope the new syntax makes it easier to calculate with your data. You can find more explanations and four examples of how to use added columns in our Academy article “How to calculate in added columns”. Feedback, questions, hints? Write to us at support@datawrapper.de. We’re happy to hear from you.
Comments