

French people are losing confidence in the Paris Olympics
March 28th, 2024
3 min
This article is brought to you by Datawrapper, a data visualization tool for creating charts, maps, and tables. Learn more.
Hi, it’s Ivan, I’m team lead developer at Datawrapper. This week, we’ll look at how patterns of alcohol consumption have changed over the last several decades.
I recently read an article on how alcohol consumption in Russia had fallen in recent years and was now lower than in many other countries. I was astounded – surely this was a mistake? After all, one of the most prevalent stereotypes of Russians is that they are heavy drinkers, as witnessed in countless films.
So I decided to hunt for data and check it myself.
Turns out that the article I read wasn’t lying – the data indeed shows that there are a number of countries where more alcohol per capita is consumed than in Russia. So maybe it’s time for us to stop stereotyping poor Russians.
But hold on, things are unfortunately not as simple as that. The data shows only recorded alcohol consumption which means that alcohol produced and consumed outside of government control is not included. I found some data showing the unrecorded consumption but realised that it comes with problems: such data is based on estimates and is therefore inaccurate by nature. And after hours of searching I gave up on finding this data for all shown years for all countries.
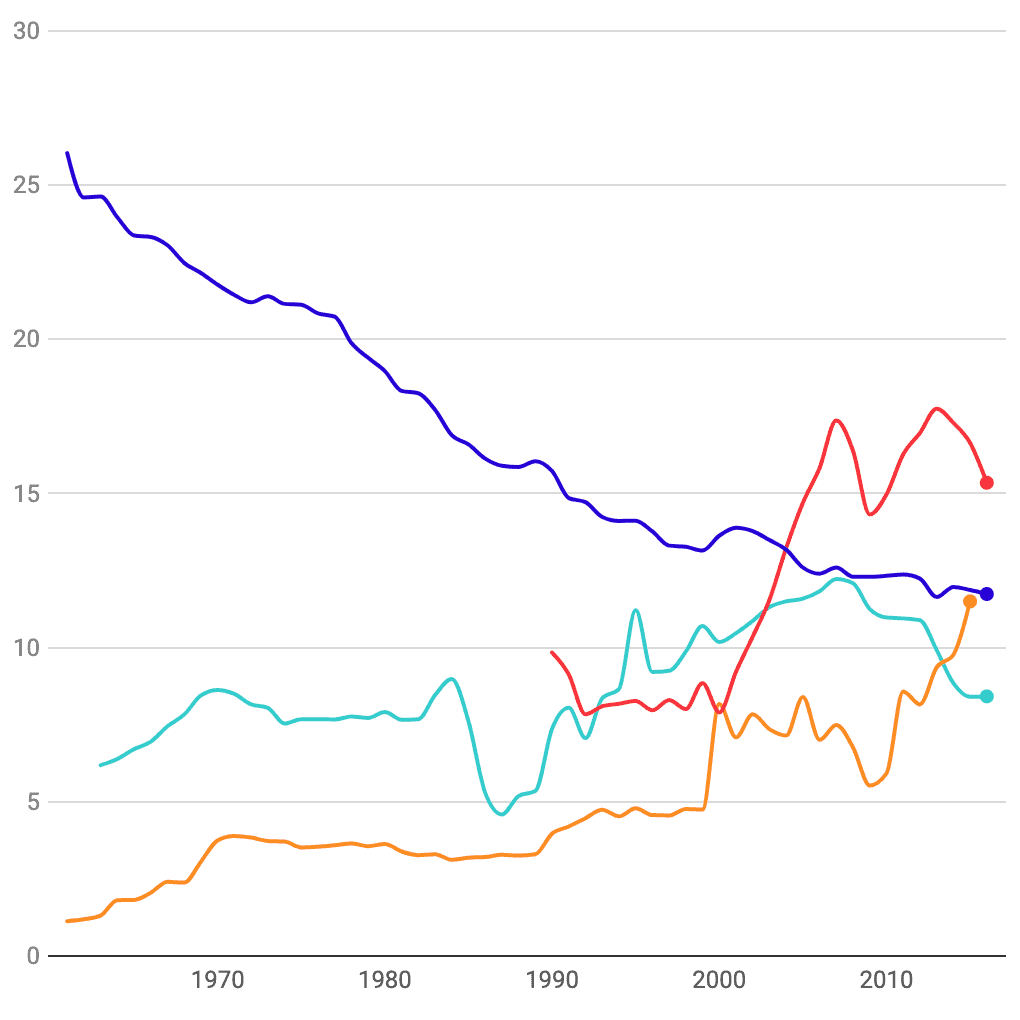
I highlighted some other things that stood out to me from the dataset in the chart:
France simultaneously holds two records. It had the highest overall recorded consumption in a single year: in 1961, 26 litres of alcohol per capita were consumed. That’s a whooping 1040 glasses (500ml) of beer 🍺 (5% ABV – alcohol by volume) per year or 2.85 per day. Or maybe more fitting: that’s 1170 glasses (175ml) of wine 🍷(12.5% ABV) per year or 3.2 per day.[1] That’s a serious amount of drinking. Thankfully, France’s other record makes up for it: it had the biggest drop in consumption of all nations from 1961 to 2016. It went down by more than a half to 11.7 litres and now does not stand out from many other nations.
Once I knew that I wanted to show changes over time and compare different countries to each other, I figured out that a line chart was the ideal choice.
A problem that I encountered was which countries to show alongside the ones that I wanted to highlight. The original dataset contains data on 190 countries. When working on the chart, I tried including them all and also including none apart from the highlighted ones, but both were problematic:
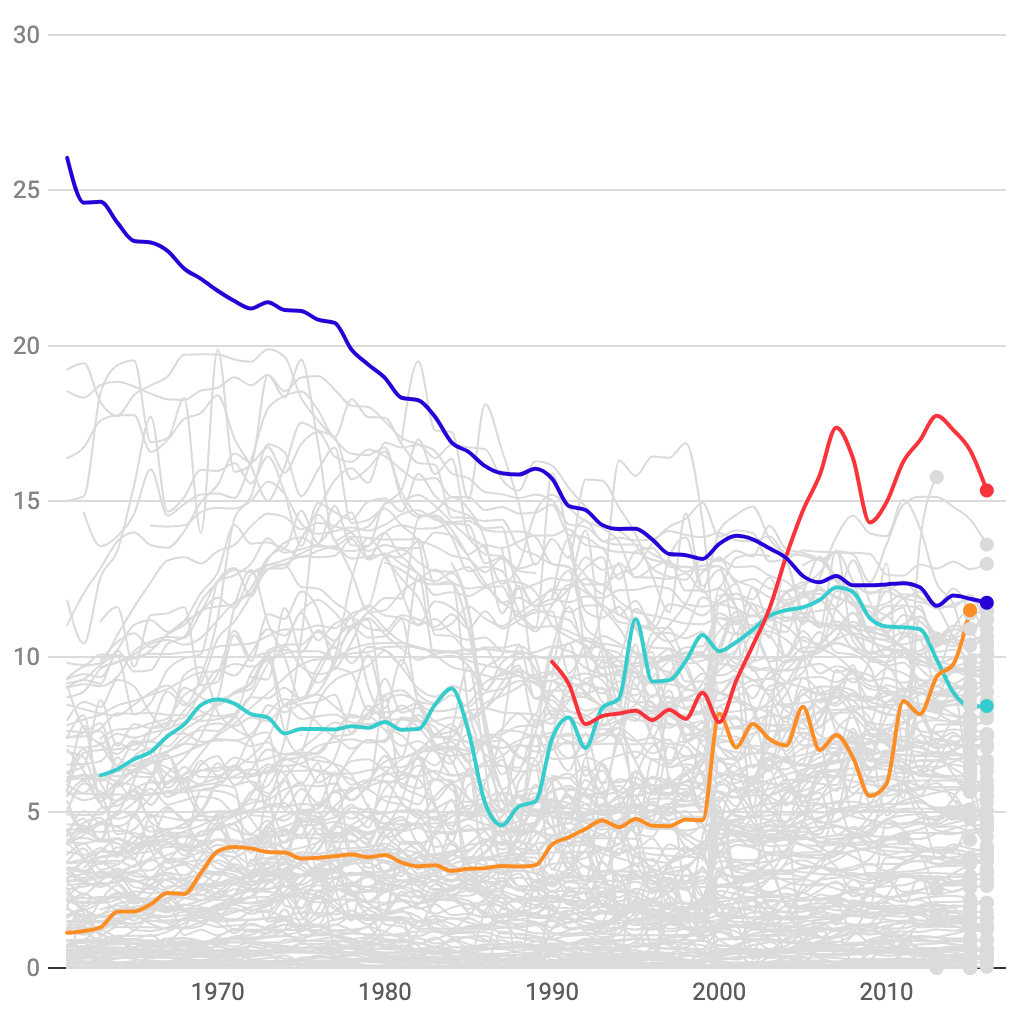
Left: showing all countries creates too much background noise and leaves little space for annotations
Right: showing only highlighted countries means that there are no indicators of what alcohol consumption levels are like in any other countries.
In the end I settled on showing highlighted countries along with a few select ones as background indicators that either have high populations or those I thought would be of interest. It is not an ideal solution but in my view a sufficient compromise.
I hope you enjoyed the article whether you drink or not! I did not look into what might have caused the pattern changes that I highlighted. So if you know why alcohol consumption has gone down in France or gone up in Seychelles, or if you have anything else to share, please let me know in the comments. See you next week!
Here is how I calculated this, eg for beer: 1 beer serving contains 500ml x 5% ABV (0.05) = 25ml of pure alcohol. So in 26 litres (or 26000ml) of pure alcohol per year there are: 26000ml / 25ml = 1040 beer servings. This amounts to 1040 / 365 = 2.85 beer servings per day.↩︎


Comments