

Read “Chart Spark” by Alli Torban with us!
June 17th, 2024
6 min
This article is brought to you by Datawrapper, a data visualization tool for creating charts, maps, and tables. Learn more.
“I wrote this book so that I’d finally have a singular and reasonably comprehensive reference to recommend to students and scientists who ask me how to create more considered diagrams…”
Do you keep getting recommendations for data vis books, maybe even buying them, but then don’t make it a priority to read them? Let’s get more out of these books by reading and discussing them together in the Data Vis Book Club. Here’s what we’ll read next — join us!
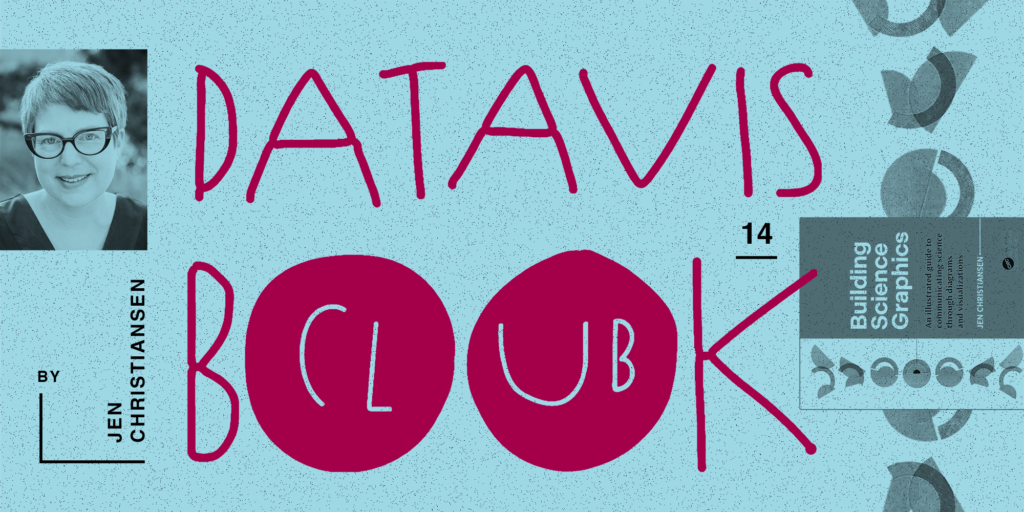
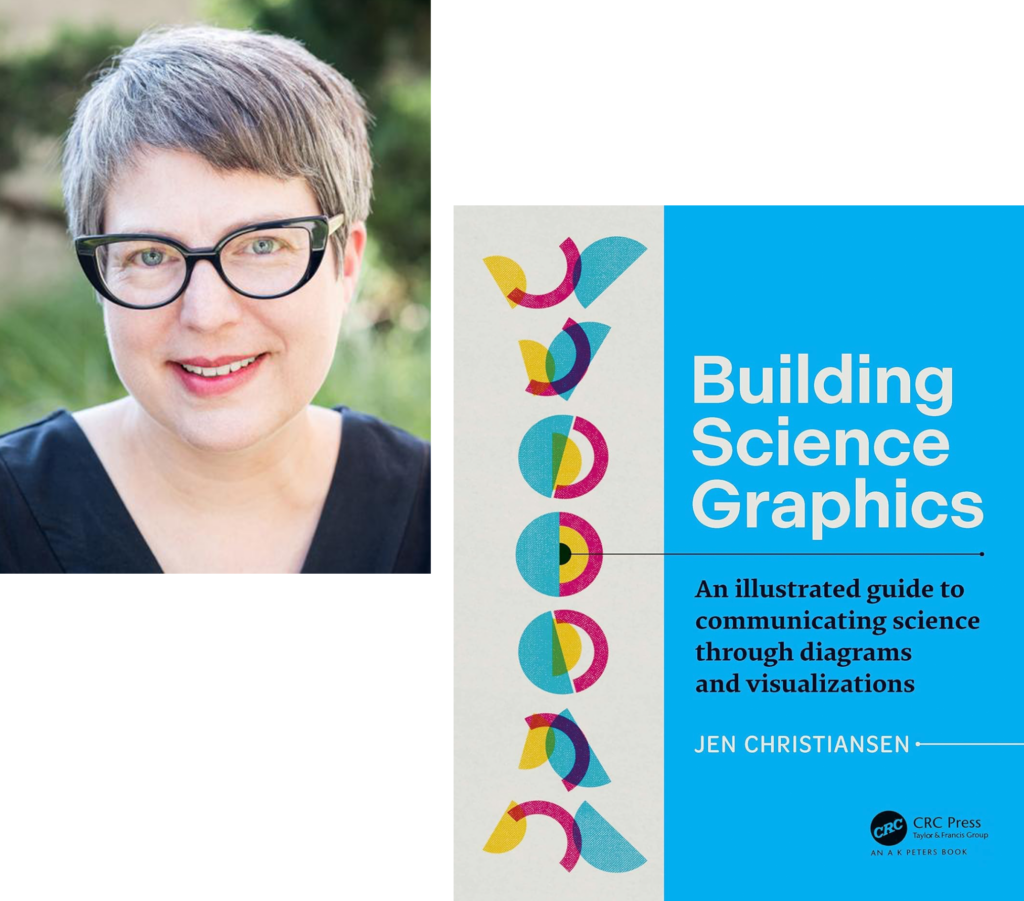
After a long pause of almost two years, I’m happy to announce the next book for our book club: Jen Christiansen’s “Building Science Graphics: An illustrated guide to communicating science through diagrams and visualizations”!
We’ll discuss Building Science Graphics on Monday, December 4th at 4 p.m. UTC here: notes.datawrapper.de/p/bookclub-science-graphics
That’s 9 a.m. on the U.S. West Coast; 11 a.m. in Chicago; 12 p.m. on the U.S. East Coast, Colombia, and Peru; 2 p.m. in Brazil and Argentina; 4 p.m. for readers in the U.K. and Portugal; 6 p.m. for most other Europeans; and 10:30 p.m. in India.
Jen Christiansen herself will join us around 45 minutes into the discussion to answer all our questions.
As always, everyone is welcome to join! Just open the notepad at the correct date and time and start typing. Many participants will be new to the conversation — we’ll figure it out as we go.
Jen Christiansen calls herself a “science communicator” who creates explanatory diagrams and data visualizations for the magazine Scientific American. Her job also includes art directing and project management, and she often collaborates with freelance illustrators, researchers, and data vis designers.
Jen studied art and geology, then merged the two disciplines to pursue a graduate program in scientific illustration at the University of California, Santa Cruz. After interning at Scientific American, she worked at National Geographic magazine for several years before returning to Scientific American as a senior graphics editor.
Building Science Graphics read to me like the ultimate guide for creating visuals in the world of science. The main audience for this book is students and scientists who want to improve their papers, articles, and presentations; Jen offers them specific advice for creating clear and engaging diagrams and data visualizations. But the book is also a resource for designers, illustrators, and visual journalists, as well as anyone else interested in communicating scientific topics to a general audience.
If you’re searching for a step-by-step guide to creating Sankey diagrams with D3.js, or inspiration on data art and creative coding, this book is not for you. But if you’ve ever wondered what makes a good science diagram work and how you can improve yours with well-thought-through techniques, this is the book to read. Jen goes deep into the fascinating world of science visuals, offering her insight into the magic behind them.
1. You get yourself a copy of “Building Science Graphics.” Ask your local library to order it for you, buy it, borrow it from a friend, ask around on your preferred social network.
2. We all read the book. This is where the fun begins! Please mention @datavisclub or use the hashtag #datavisclub if you want to share your process, insights, and surprises — I’ll make sure to tweet them out from @datavisclub as motivation for us all. Don’t worry if you don’t read every word on all 300 pages of the book! Start by reading the chapters that appeal the most to you and see how far you get.
3. We get together to talk about the book. This will happen digitally on Monday, December 4th at 4 p.m. UTC over at notes.datawrapper.de/p/bookclub-science-graphics.
It won’t be a call or a video chat; we’ll just write down our thoughts. The discussion will be structured into three questions:
During the conversation, I’ll ask these three questions in the following order:
1 What was your general impression of the book? Would you recommend it? To whom?
2 What was most inspiring, insightful, or surprising? What did you learn that you didn’t expect to?
3 Having read the book, what will you do differently the next time you visualize data?
For each question, you can prepare an answer in 1-2 sentences and paste it into the notes once I ask the question during the conversation. If you can’t find the time to prepare anything at all just come by and chat — we’ll quickly get into discussion mode.
After discussing these three questions for about 45 minutes, Jen Christiansen will join us to answer questions we might have about their book.
Here’s a short FAQ for you, in case you have more questions:
A digital book club is a new experience for many of us. See what our book club discussions have looked like in the past:

You can also read the review of the first book club, to learn how people found the experience.
This is what others have said about some of the last book club discussions:
Because it works well for introverts and for people who prefer to stay anonymous in the discussion. Plus, native English speakers have less of an advantage than they have in calls. Plus, the documentation of our meeting writes itself.
Do you have a lunch date? Vacation? Need to put the kids to bed? Need to sleep yourself? No problem! The conversation will be archived in the notes and can still be extended over the next day(s).
You can either subscribe to our Datawrapper Blog Update newsletter, turn on notifications for our Twitter account, or leave your Twitter handle in a list. I explain all three options in more detail here.
I’m very, very much looking forward to working through the chapters of “Building Science Graphics” with all of you. If you have any more questions, write them in the comments or send them to guillermina@datawrappper.de or to Guillermina / Datawrapper on Twitter. Also, make sure to follow @datavisclub to stay up-to-date and get a dose of motivation from time to time. I’ll see you in December!


Comments