Read “How to lie with maps” by Mark Monmonier with us!
January 29th, 2025
6 min
This article is brought to you by Datawrapper, a data visualization tool for creating charts, maps, and tables. Learn more.
“Any visualization is a model.”

After the success of reading Tufte in the Data Vis Book Club, this blog post will explain what we’ll read next. From now on we will have two tracks:
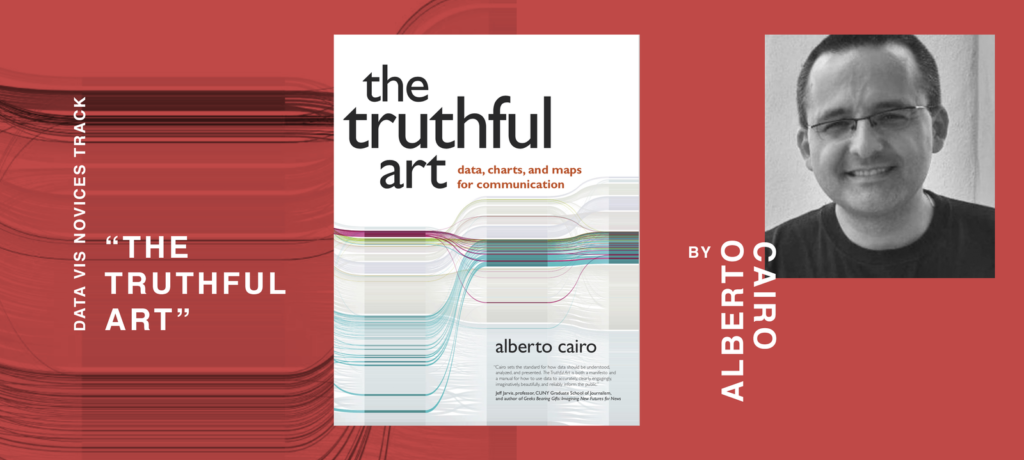
In the novices track, we’ll read Alberto Cairo’s “The Truthful Art” and will discuss it on Wednesday, the 19th of September at 6 pm UTC here: notes.datawrapper.de/p/bookclub-cairo.
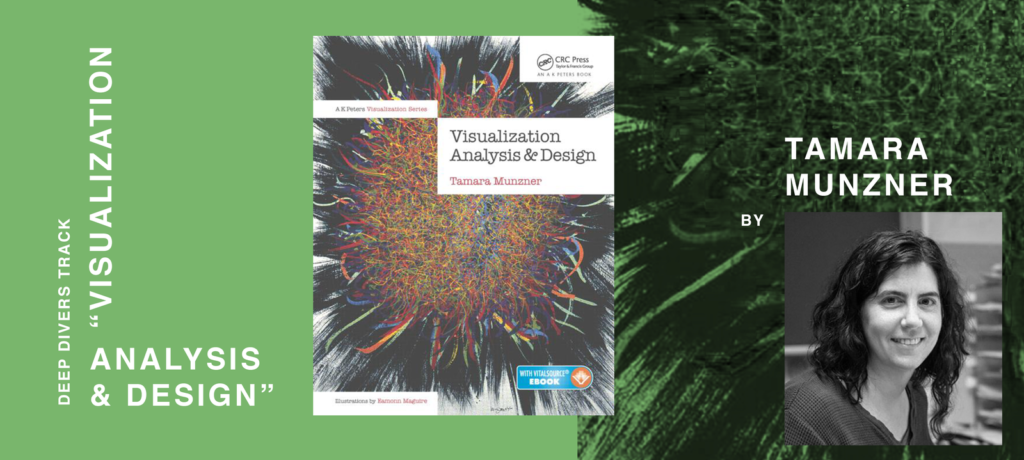
In the deep divers track, we’ll read Tamara Munzner’s “Visualization Analysis & Design”. We’ll discuss chapters 1 to 6 on Wednesday, the 12th of September at 5 pm UTC here: notes.datawrapper.de/p/bookclub-munzner. We’ll read chapters 7 to 15 two to four weeks later (to be announced).
Edit: We’ll discuss the second half of the book on Tuesday, they 16th of October, at 5 pm UTC here: notes.datawrapper.de/p/bookclub-munzner2.
Read on to find out why you should read these books, or scroll down to learn how the book club works:
Alberto Cairo is one of the most influential voices in the data vis field these days. He’s teaching at the University of Miami, tours around the world with his “Visual Trumpery” talk and writes books: “The Functional Art” came out in 2012, “The Truthful Art” in 2016. Chances are you’ve heard of him. And have one of his books on your shelf.
Why are we not reading “The Functional Art” but rather “The Truthful Art”? Because the first one focuses more on illustrative infographics, while the latter one explains (statistical) concepts that are more important for visualizing numbers.

Read this book with us if you want to
…and all of that with a strong focus on communication to readers. Alberto Cairo comes from journalism, and you’ll get to know the data journalism scene and its priorities on the fly.
Don’t read this book if you want to learn how to use a charting tool, or if you want to learn how to design nicer-looking charts (with a focus on color, typo or layout).
Still not sure? Read the reviews on goodreads.com or have a look at these sample pages (PDF).
Tamara Munzner is a computer science professor in Vancouver and wrote this book in 2014 to “scratch her own itch”: She wanted to write the perfect textbook for her course. The result is a dense tour through her structured & science-based view of the data visualization process.

Read this book with us if you want to
Don’t read this book if you want an exciting and practical introduction to data vis, with many colorful examples. Tamara Munzner’s book is full of images, but they exist to teach, not inspire.
Still not sure? Read the reviews on goodreads.com or have a look at this draft of the book (PDF) – the structure in the final book differs a lot from the draft, but it will give you a sense of the style and density.
1. You get the book. Ask your local library to order it for you, buy it (e.g. used), borrow it from a friend, ask around on your preferred social network.
2. We all read the same book. That’s where the fun begins! Please use the hashtag #datavisclub or mention @datavisclub if you want to share your insights and surprises – I’ll make sure to tweet them out as @datavisclub.
3. We get together to talk about the book. We’ll discuss “The Truthful Art” on Wednesday, the 19th of September at 5pm UTC over at notes.datawrapper.de/p/bookclub-cairo; and “Visualization Analysis & Design” on Wednesday, the 12th of September at 5pm UTC at notes.datawrapper.de/p/bookclub-munzner.
5 pm UTC is 10 am on the US west coast, lunchtime (1 pm) on the US east coast, 6 pm for readers in the UK & Portugal and 7 pm for most other Europeans.
Our conversation will be structured with the help of three questions:
A What was your general impression of the book?
B What was most insightful & surprising about the book? Explain how a sentence, chapter or the whole idea of the book challenged something you assumed.
C Having read the book, what will you do differently the next time you create a chart?
During the conversation, I’ll ask these three questions in order. For each one, you can prepare an answer in 1-2 sentences and paste it into the notes once I ask the question during the conversation. If you won’t find the time, don’t prepare anything at all and just come by and chat – the last time, we quickly got into discussion mode.
That’s it! Here’s a little FAQ for you, in case you have more questions:
I can’t make it on this date / this time.
Do you live in New Zealand and it’s the middle of the night (sorry😢)? Do you have a lunch date? Summer vacation? Need to bring the kids to bed? No problem! The conversation will be archived in the notes and can still be extended over the next day(s).
Can I read both books?
Yes, yes you can! You’re very welcome on both notepads.
Will there be local meetups?
I’d be thrilled if you’d organize a meetup in your city! If you live in Berlin, there will be a meetup for each book in the Datawrapper office. Have a look at both events on meetup.com. (We really enjoyed talking about the book the last time.) Alli Torban also organized a meetup for the Washington DC area the last time. If you organize a meetup or look for attendees, make sure to mention @datavisclub, and I’ll spread the word.
Why don’t we do a call? Why the notepad?
Because it works great for introverts & people who prefer to stay anonymous in the discussion. Plus, the documentation of our meeting writes itself. But if you’d like to organize a call, go ahead! I’m sure that lots of people would be interested. I’ll make sure to support you.
I’m very, very much looking forward to reading these two books with all of you. If you have any more questions, write in the comments, write to lisa@datawrapper.de or write a message to Lisa or the Datawrapper account on Twitter. Also, make sure to follow @datavisclub, to stay up-to-date and get your (almost) daily dose of motivation.
Comments