Read “How to lie with maps” by Mark Monmonier with us!
January 29th, 2025
6 min
This article is brought to you by Datawrapper, a data visualization tool for creating charts, maps, and tables. Learn more.
“Clutter is your enemy.”

Our Data Vis Book Club has grown quite a bit since we started it: You can join more than 1,500 people in following us on Twitter (@datavisclub) or have a look at the discussion of the three books we’ve read so far:
Both Tamara and Alberto joined our conversations to answer questions we had about the book (thank you so much!). You can find their answers in the linked notepads too.
I’m happy to announce the 4th book we will read**“Storytelling with Data” by Cole Nussbaumer Knaflic**. It’s a great book for data vis novices. We will discuss it on Tuesday, the 30th of October at 5 pm UTC here: notes.datawrapper.de/p/bookclub-swd (“swd” stands for “Storytelling with Data”).
Before the book club, we have a redesign challenge. We will discuss these redesigns and answer three questions during the meetup itself – scroll down to learn more! Afterward, Cole will join us to answer our questions.
Cole Nussbaumer Knaflic “helps rid the world of ineffective graphs”, as her Twitter bio states. She has a background in applied math and worked for Google as a People Analytics Manager for almost six years. In 2015, she wrote “Storytelling with Data”. That phrase has been her recent life. She writes a blog, organizes a chart design challenge and records a podcast (definite recommendation!), all under the label “Storytelling with Data”.
Read Cole’s book with us if you want to
Don’t read Cole’s book if you want to learn data analysis, coding or how to actually build these charts with Excel or a charting tool like Datawrapper.
Also, consider that this book has a clear focus on the presentation side. It teaches you how to communicate your data once you know what you want to communicate. If you’re using data vis to find unknown insights in your data, this is not the book for you. Instead, check out the other book we’re reading right now, Tamara Munzner’s “Visualization Analysis & Design” – we’ll have a discussion about it on October 16 at 5 pm UTC.
Still not sure? Read the reviews on “Storytelling with Data” on goodreads.com.
1. You get Cole’s book. Ask your local library to order it for you, buy it (used for example), borrow it from a friend, ask around on your preferred social network.
2. We all read the book. That’s where the fun begins! Please mention @datavisclub or use the hashtag #datavisclub if you want to share your process, insights, and surprises – I’ll make sure to tweet them out as @datavisclub, as motivation for us all.
3. We get together to talk about the book. This will happen digitally on Tuesday, the 30th of October at 5 pm UTC over at notes.datawrapper.de/p/bookclub-swd. It won’t be a call or a video chat; we’ll just write down our thoughts. 5 pm UTC is 10 am on the US west coast, lunchtime (1 pm) on the US east coast, 6 pm for readers in the UK & Portugal, 7 pm for most other Europeans and 10.30 pm in India. The discussion will be structured with the help of three questions, a redesign challenge and a Q&A with Cole Nussbaumer Knaflic.
During the conversation, I’ll ask these three questions in order:
1 What was your general impression of the book?
2 What was most insightful & surprising about the book? Explain how a sentence, chapter or the whole idea of the book challenged something you assumed.
3 Having read the book, what will you do differently the next time you create a chart?
For each question, you can prepare an answer in 1-2 sentences and paste it into the notes once I ask the question during the conversation. If you can’t find the time to prepare anything at all just come by and chat – we’ll quickly get into discussion mode.
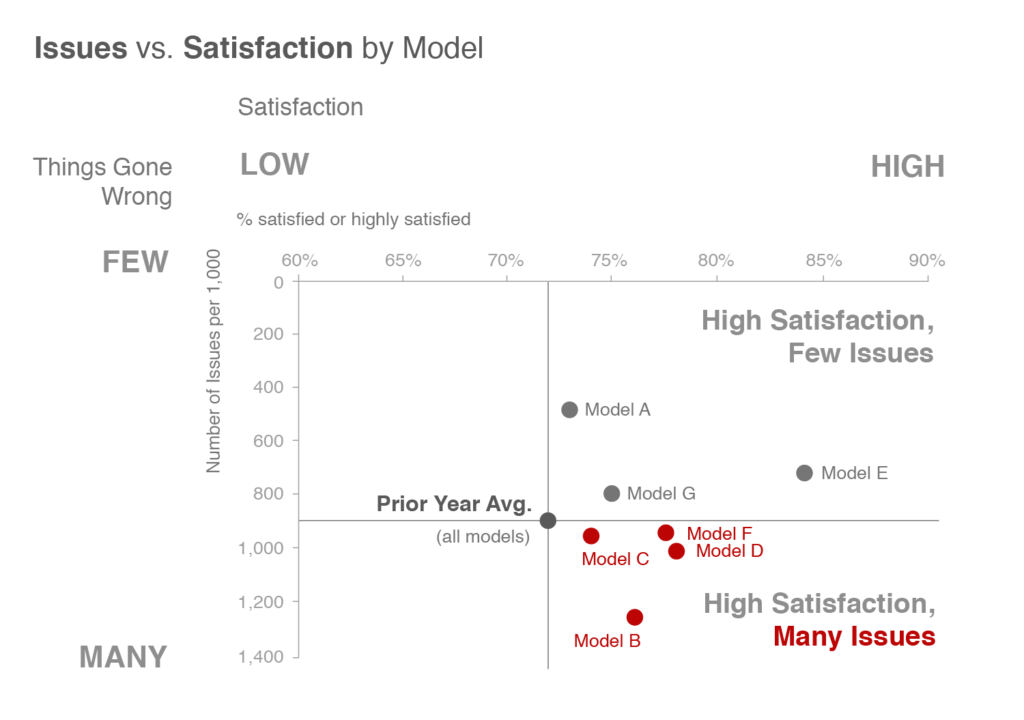
This time, we’ll try something new: We’ll get our hands on the scatter plot in figure 5.6 on page 136 and will redesign it! Even if you feel like your redesign won’t improve Cole’s version, it’s helpful and fun to change chart elements and see how it changes the readability of the chart. You’ll probably want to redesign the chart after reading “Storytelling with Data”, to directly apply the lessons learned. Here’s the chart in question:

Get an Adobe Illustrator / PDF / SVG file from this Dropbox folder, copy & paste the data from the following table into your favorite charting tool, or click on “Get the data” below the table to download an CSV:
Use any tool or medium you’d like (I’m secretly hoping for some pen & paper versions). Once you’ve designed your chart, upload it, e.g. to Imgur, Twitter or Dropbox, and link to it in the notepad. You can also send me your chart to lisa@datawrapper.de and I’ll upload it for you.
Again, your redesign is not so much about improvement (although feel free to try!). Seeing your chart will be helpful to us all, no matter what it looks like. During the book club, we will all paste the links to our redesigns and discuss what works well and what doesn’t. If you don’t find the time to redesign the chart, don’t worry! You’re still more than welcome to discuss the book with us and to give feedback on other charts.
After answering the three questions and discussing the redesigns, we’ll get to the highlight: Cole will join approx. one hour after the book club has started, to answer questions we have about the book. Whilst reading the book, make notes about what you’d like to ask her!
Here’s a short FAQ for you, in case you have more questions:
So what will happen, exactly, during the book club?
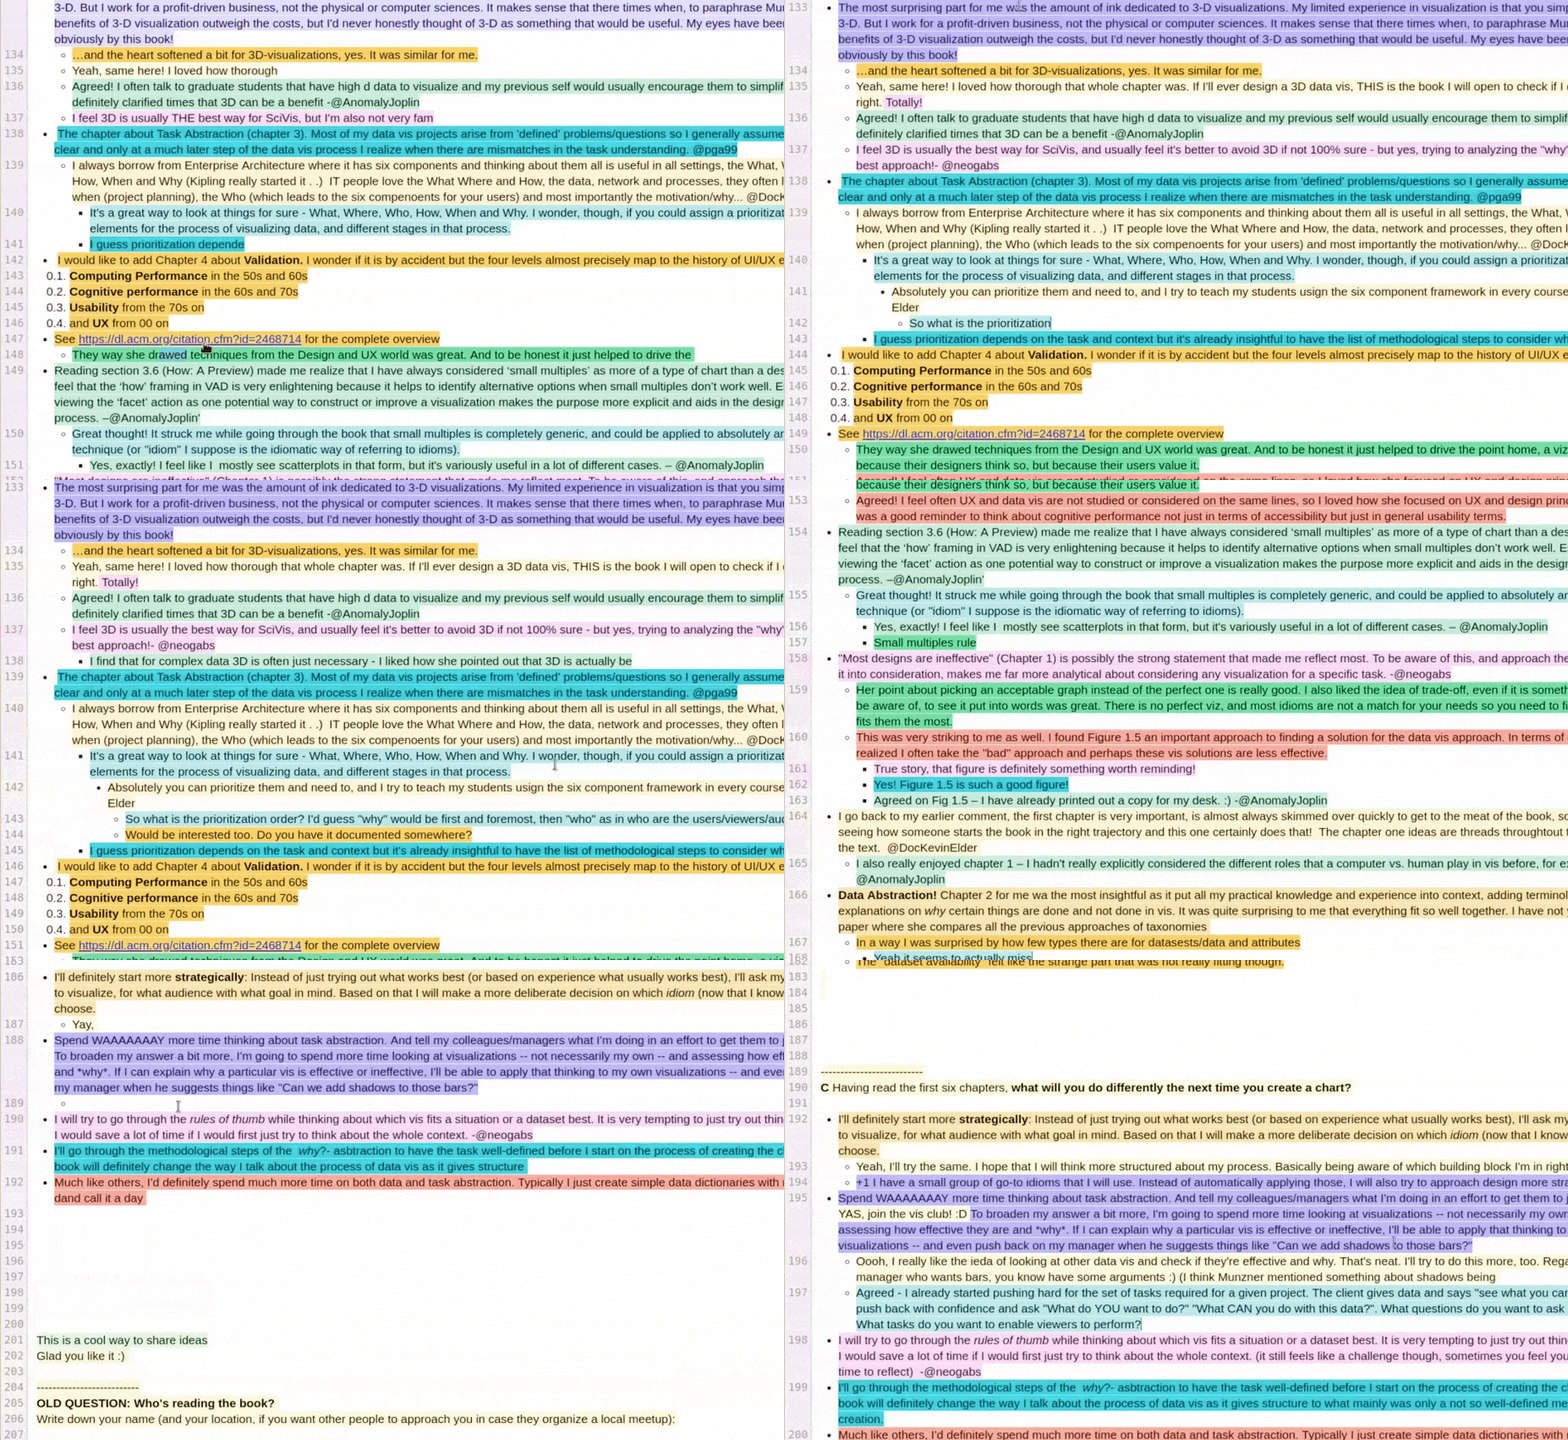
A digital book club is a new experience for many of us. See how our book club discussions have looked like in the past:

You can also read the review of the first book club.
Why don’t we do a call? Why the notepad?
Because it works great for introverts & people who prefer to stay anonymous in the discussion. Plus, the documentation of our meeting writes itself. But if you’d like to organize a call, go ahead! I’m sure that lots of people would be interested. I’m happy to support you.
I can’t make it on this date / this time.
Do you live in New Zealand and it’s the middle of the night (sorry😢)? Do you have a lunch date? Vacation? Need to bring the kids to bed? No problem! The conversation will be archived in the notes and can still be extended over the next day(s).
Will there be local meetups?
I’d be thrilled if you’d organize a meetup in your city! If you live in Berlin, there will be a meetup in the Datawrapper office on the Wednesday, 31st of October. Find the event on meetup.com. (We enjoyed talking about e.g. Tufte). Alli Torban also organized a meetup for the Washington DC area for the Tufte book. If you organize a meetup or look for attendees, make sure to mention @datavisclub, and I’ll spread the word.
I’m very, very much looking forward to reading “Storytelling with Data” with all of you. If you have any more questions, write in the comments, at lisa@datawrapper.de or to Lisa / the Datawrapper account on Twitter. Also, make sure to follow @datavisclub, to stay up-to-date and get your (almost) daily dose of motivation.
Comments