Read “Practical Charts” by Nick Desbarats with us!
October 14th, 2024
7 min
This article is brought to you by Datawrapper, a data visualization tool for creating charts, maps, and tables. Learn more.
“Avoid the Duck”

Do you keep getting recommendations for data vis books, maybe even buy them, but don’t make it a priority to read them? How about we read these books together? How about we discuss the books we read, for the joy of it, and to get more out of it? That’s the idea behind the Data Vis Book Club.
Our first book is a data vis classic and can be found unread on many shelves: “The Visual Display of Quantitative Information” by Edward Tufte, in the second edition from 2001. On August 14th, we’ll meet at 5 pm UTC to discuss the book here: notes.datawrapper.de/p/bookclub-tufte.
1. You get the book. Ask your local library to order it for you, buy it (used) or use the offer on Tufte’s website to buy all four of his books for 100 USD.
2. We all read the same book. That’s where the fun begins! If you want get your Twitter followers involved, please use the hashtag #datavisclub, so that we have a good overview. If you don’t want to spam your Twitter followers, we also have a document set up where we can all collectively write down notes & surprising bits that you found: notes.datawrapper.de/p/bookclub-tufte
3. We get together on August 14th to talk about the book. On Tuesday, 14th of August, we meet at 5 pm UTC to talk about the book here: notes.datawrapper.de/p/bookclub-tufte.
That’s 10 am on the US west coast, lunchtime (1 pm) on the US east coast, 6 pm for readers in the UK & Portugal and 7 pm for most other Europeans.
Our conversation will be structured with the help of three questions:
During the conversation, I’ll ask one question after another. For each one, you can prepare an answer in 1-2 sentences and paste it into the notes once I ask the question during the conversation. If you won’t find the time, don’t prepare anything at all and just come by and chat.
That’s it! Here’s a little FAQ for you, in case you have more questions:
Do you live in New Zealand and it’s the middle of the night (sorry😢 )? Do you have a lunch date? Summer vacation? Need to bring the kids to bed? No problem! The conversation will be archived in the notes and can still be extended over the next day. After approximately one day, I will write a blog post summing up the discussion.
I hope that this book will inspire, teach & provoke you.
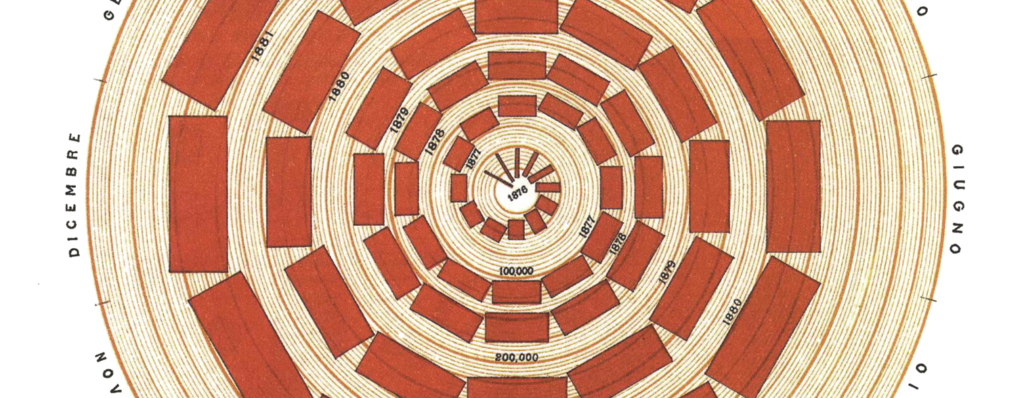
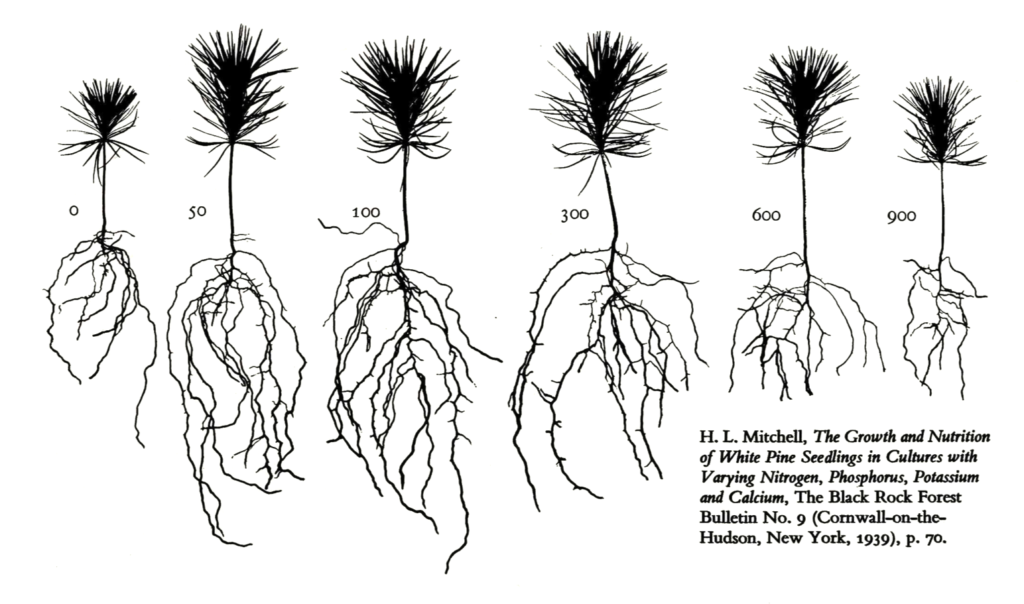
Inspire, because it’s a work of beauty. It shows you what can be achieved in data vis with big images, and it does so on marvelous paper with wonderful book design. I don’t know a better-designed data vis book. I hope you will be in awe.
Teach: Tufte will teach you about principles for creating well-designed charts, the data density and data-ink ratio, the Duck of data vis & chartjunk. He will explain to you the genius of some important historical data visualizations and redesign charts for you. Afterwards, you’ll see charts with a sharpened eye.
Provoke, because Tufte has strong opinions. You might find yourself nodding your head firmly or you might find yourself disagreeing with his assessments. I hope you do both, and I hope you will build your own opinion on the way. In the best case, it will lead to interesting conversations during the book club meeting.
Also, it’s a short read. Lots of pictures that fill the pages!


Tufte is one of the first names you hear dropped aaaall the time at data vis conferences and meetups. He was in the scene before most of us, and wrote four books every seven or so years, starting at the beginning of the 80s:
Nowadays, he mostly gives the same one-day-course all over the world, creates sculptures and blocks other data vis experts on Twitter. We will read Tufte’s first book, “The Visual Display of Quantitative Information”, in the second edition from 2001.
I recommend to read all four book by Tufte – but if you can only read one and want to learn about visualizing data, it should be “The Visual Display”. All other books focus on both information design and data vis, while “The Visual Display” talks exclusively about data vis. In case you’re interested, that’s what you will get out of the other books:

“The Visual Display” is not a practical book. You won’t
If these things are more important to you than general inspiration & awe, more important than finally knowing what everyone is talking about when they mention “Tufte-like” and more important than chart design: No big deal! This book club will get to more practical books over the next months.
If you’re still not sure if this book is for you, have a look at these 15 sample pages that Tufte posted here.
I’m very, very much looking forward to reading this book with all of you. If you have any more questions, write in the comments, write to lisa@datawrapper.de or write a message to Lisa or the Datawrapper account on Twitter. You can also place your questions (also to other book readers!) in the notes, which I’ll check daily.
Comments