

Read “How to lie with maps” by Mark Monmonier with us!
January 29th, 2025
6 min
This article is brought to you by Datawrapper, a data visualization tool for creating charts, maps, and tables. Learn more.
Do you keep getting recommendations for data vis books, maybe even buying them, but then don’t make it a priority to read them? Let’s get more out of these books by reading and discussing them together in the Data Vis Book Club. Here’s what we’ll read next — join us!
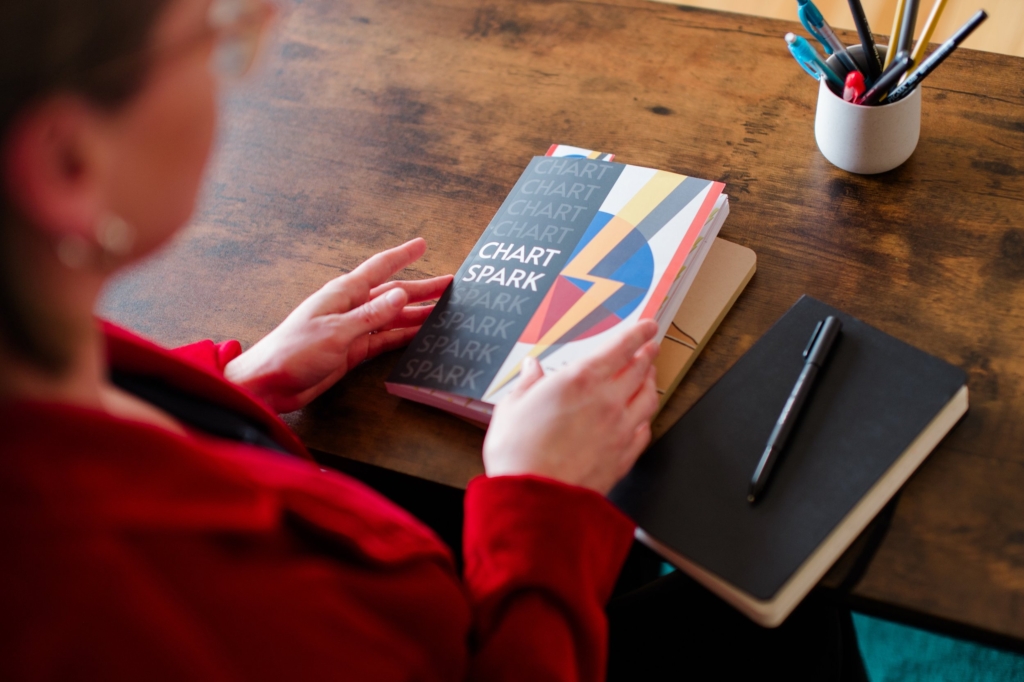
We’re very excited to announce the next book for our book club: “Chart Spark” by Alli Torban, host of the Data Viz Today podcast.
We’ll discuss Chart Spark on Monday, July 22nd at 4 p.m. UTC here: https://notes.dw.tools/p/chart-spark
That’s 9 a.m. on the U.S. West Coast; 12 p.m. on the East Coast; 1 p.m. in Brazil and Argentina; 5 p.m. for readers in the U.K. and West Africa; 6 p.m. for most Europeans; and 9:30 p.m. in India.
Alli Torban herself will join us around 45 minutes into the discussion to answer all our questions.
As always, everyone is welcome to join! Just open the notepad at the correct date and time and start typing. Many participants will be new to the conversation — we’ll figure it out as we go.
In her career as a geospatial analyst and mathematician, Alli was interested in finding innovative ways to communicate spatial data insights. As her fascination with data storytelling grew, she transitioned into the broader field of information design. Now she’s the host of Data Viz Today, a podcast sharing tips, techniques, and interviews with data vis experts.

“Chart Spark” is a result of these experiences, aimed at helping readers spark their own creativity in data visualization. The book addresses visual metaphors, creative roadblocks, and knowing how far to push a project.
This book isn’t focused on particular software tools, lists of visual do’s and don’ts, or advice on getting started in the data vis world.
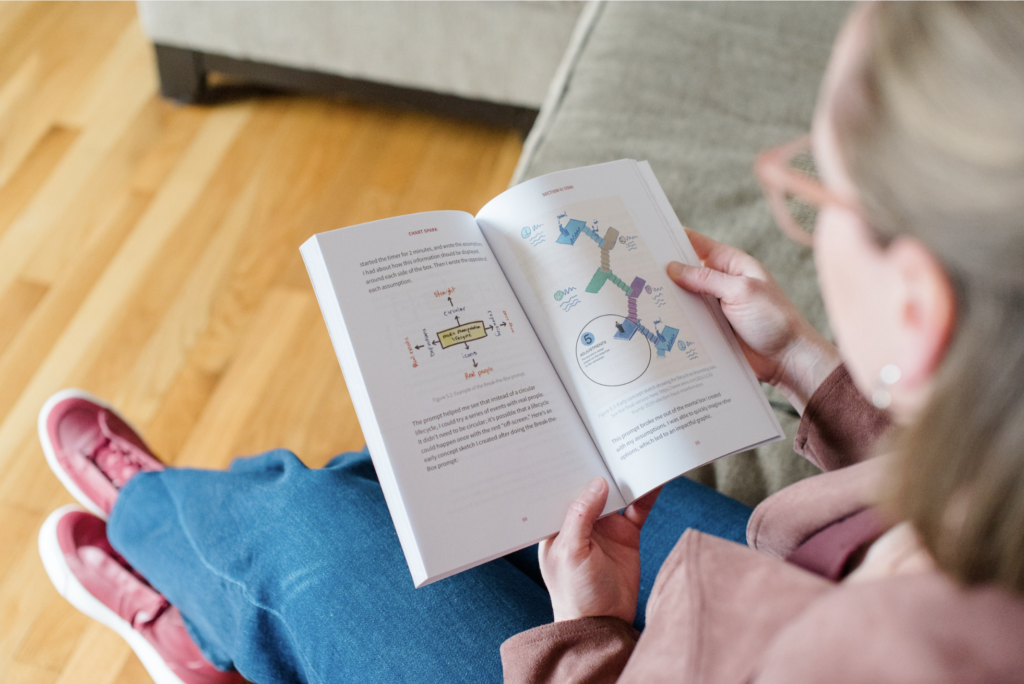
Instead, this is a book about practical strategies for brainstorming and creative design. Alli Torban gives you lots of exercises, questions, and prompts for getting ideas flowing and introducing more creativity to your visualization process.
And she gets to the point: “Chart Spark” might be the shortest book we’ve ever read in the Data Vis Book Club, and it’s definitely one of the most approachable. You won’t need more than an afternoon on your couch with a good cup of tea to read it through.
1. You get yourself a copy of “Chart Spark.” Ask your local library to order it for you, buy it, borrow it from a friend, ask around on your preferred social network.
2. We all read the book. This is where the fun begins! Please mention @datavisclub on X (Twitter) or use the hashtag #datavisclub if you want to share your process, insights, and surprises — I’ll make sure to tweet them out from @datavisclub as motivation for us all. Don’t worry about reading every word of the book! Start with the chapters that most appeal to you and see how far you get.
3. We get together to talk about the book. This will happen digitally on Monday, July 22nd at 4 p.m. UTC over at https://notes.dw.tools/p/chart-spark.
It won’t be a call or a video chat; we’ll just write down our thoughts. The discussion will be structured into three questions:
During the conversation, I’ll ask these three questions in the following order:
1. What was your general impression of the book? Would you recommend it? To whom?
2. What was most inspiring, insightful, or surprising? What did you learn that you didn’t expect to?
3. Having read the book, what stuck with you — the thing you’ll pay attention to next time you’re looking at diagrams in a scientific paper or magazine?
Feel free to prepare your answers in 1-2 sentences and paste them into the notes once I ask each question. If you can’t find the time to prepare anything, just come by and chat — we’ll quickly get into discussion mode.
After discussing these three questions for about 45 minutes, Alli Torban will join us to answer questions we might have about her book.
Here’s a short FAQ!
A digital book club is a new experience for many of us. This is what our book club discussions have looked like in the past:

You can also read the review of the first book club, to learn how people found the experience.
This is what others have said about past book club discussions:
Because it works well for introverts and for people who prefer to stay anonymous in the discussion. Plus, native English speakers have less of an advantage than they have in calls. Plus, the documentation of our meeting writes itself.
Do you have a lunch date? Vacation? Need to put the kids to bed? Need to sleep yourself? No problem! The conversation will be archived in the notes and can still be continued over the following days.
You can either subscribe to our Datawrapper Blog Update newsletter or turn on notifications for our Twitter account. I explain both options in more detail here.
I’m looking forward to reading through “Chart Spark” with all of you. If you have any questions, write them in the comments or send them to guillermina@datawrappper.de or to Guillermina / Datawrapper on Twitter. Also, make sure to follow @datavisclub to stay up-to-date and get a dose of motivation from time to time. I’ll see you in July!


Comments