Collaborate with others on charts, maps & tables in teams, for free

Together with our change in pricing, we’re happy to introduce free teams for everyone. You can now collaborate & share folders with visualizations with others, be it within a company, on a course at university or when working with clients on a website.
This feature is available for all our Datawrapper users starting today.
How to create a team
To create a team, log into your Datawrapper account, click on ☰ and My Teams in the top right. You will arrive on a page with a button that says Create team. Click it, give your team a name and invite others under the menu tab Members.
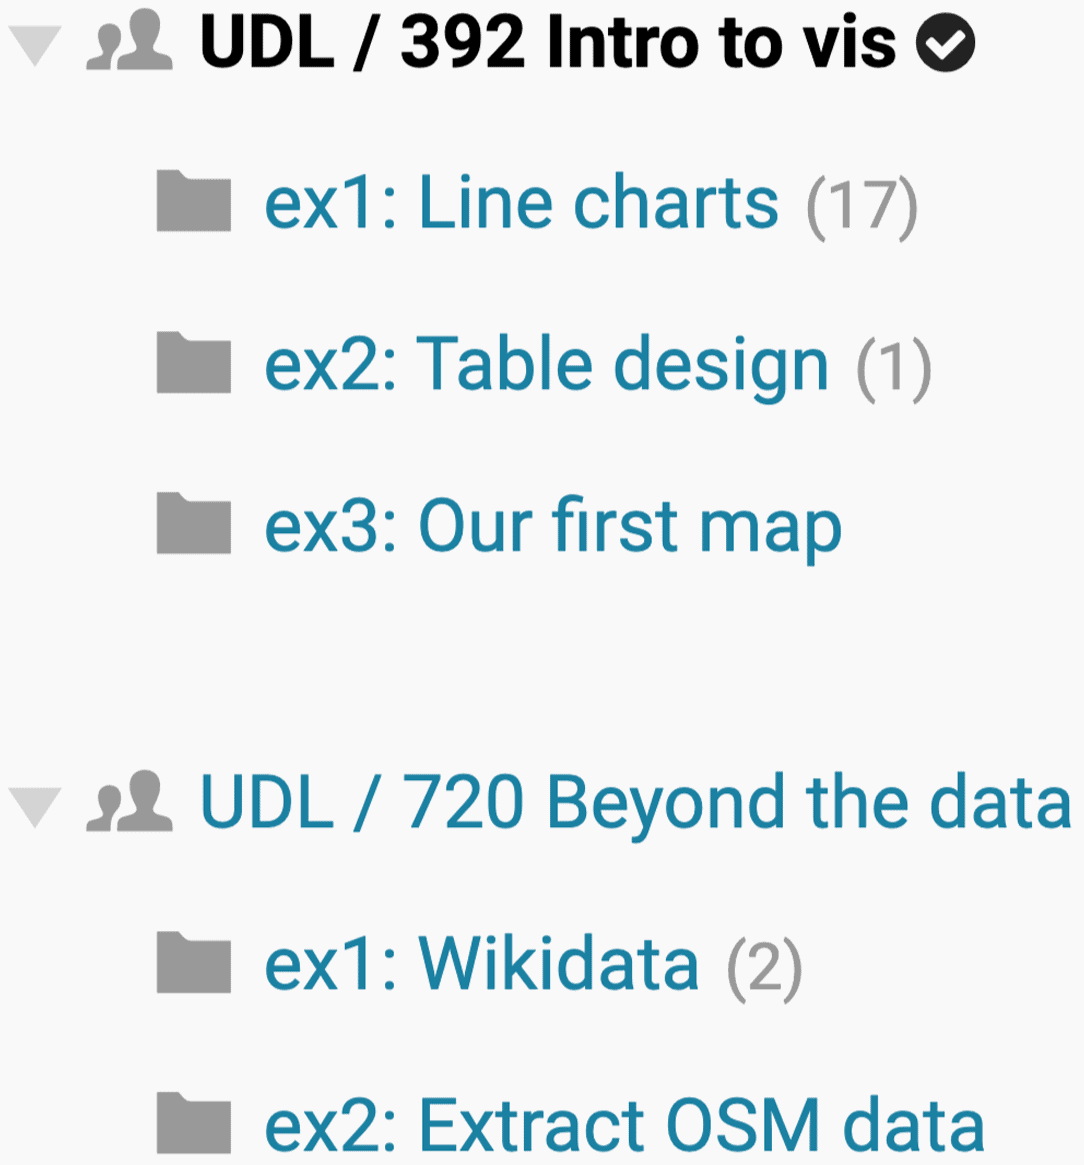
When you click on Team Charts at the top, you will see your freshly created team. There you can create as many folders as you need and organize your visualizations:
Our teams come with some powerful options. You can
- show a Slack notification every time somebody in your team creates or publishes a visualization
- define a default folder (like “first draft”) for the visualizations created within the team
- create a custom embed code to define the height, width, border etc.
Let’s see how you can make use of this all before looking at some practical questions you might have:
How to use teams
Here are four ideas on how to use the new team folders.
Help & supervise. Datawrapper’s simplicity makes it a great charting & mapping tool for data vis newbies in your organization. But especially in the beginning, they will need some help. Shared folders enable your in-house graphics team to quickly check what’s being produced by the rest of the company, to make sure everything is up to standard.
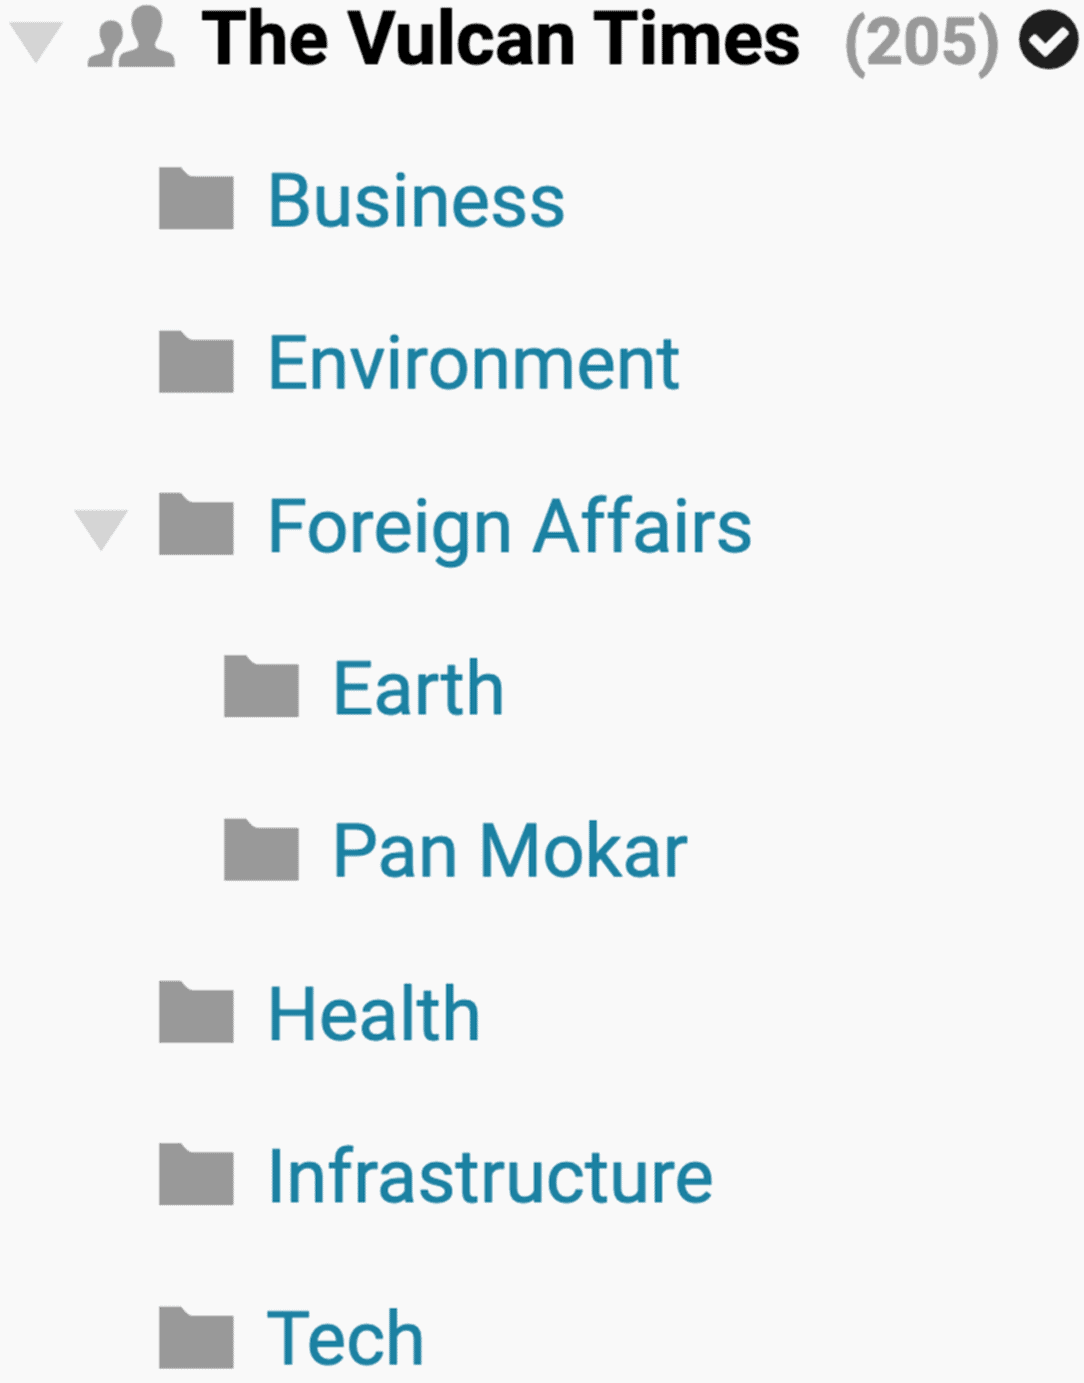
Create Workflows. To know where things are at when collaborating with coworkers, set up subfolders for steps of the process like “Draft”, “Fact-Check” and “Published”. If your coworker has a Kindergarten emergency an hour before publishing the report, you can take over and make the last changes to their chart.
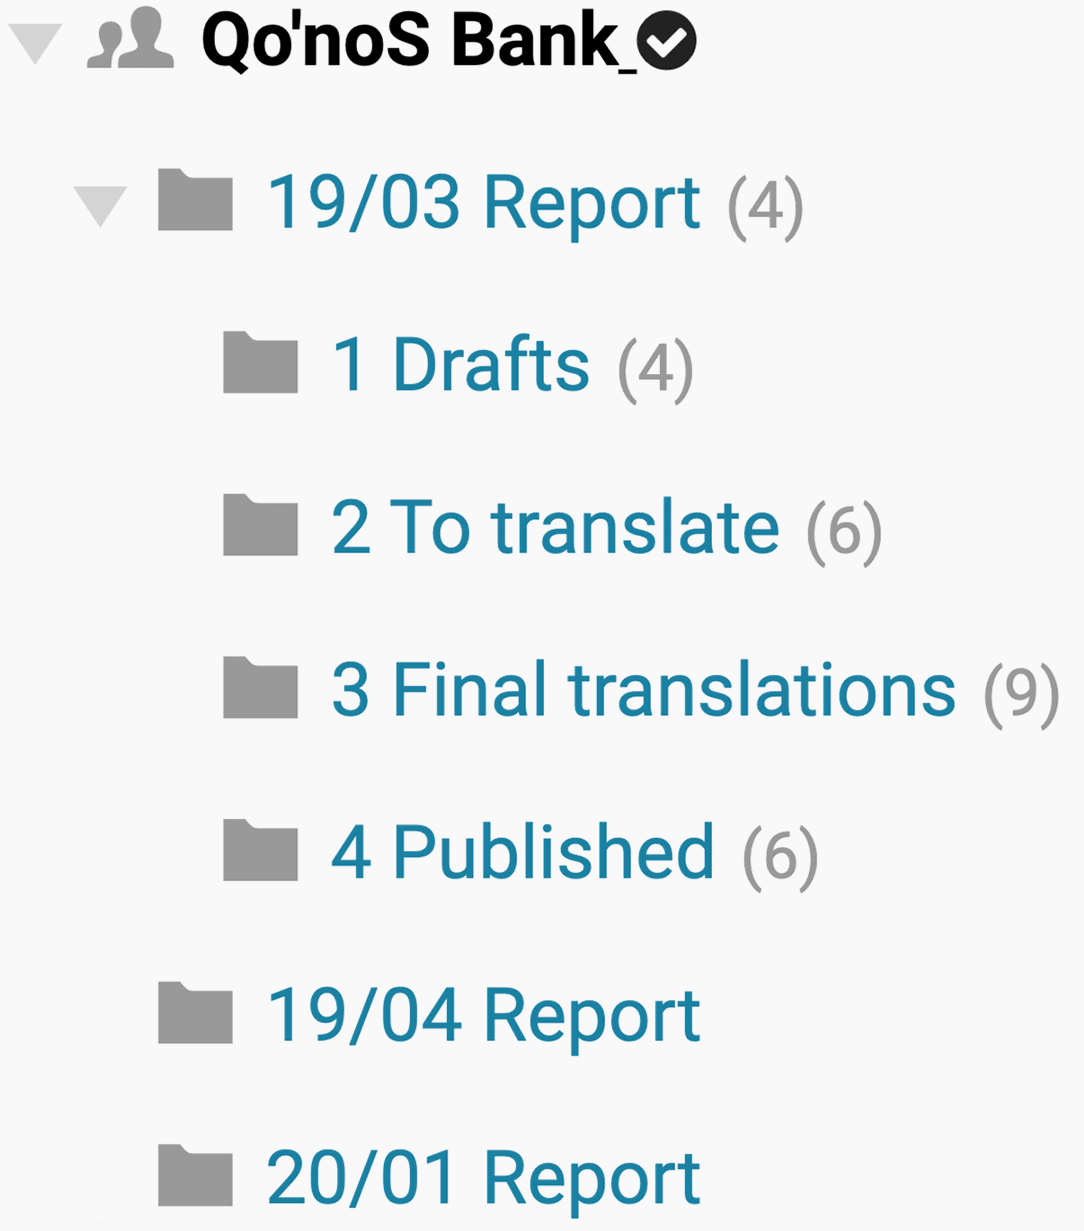
Work with clients. Invite your clients to make the last changes to charts, maps & tables you’re researching and designing for them, before you hit the Publish button.
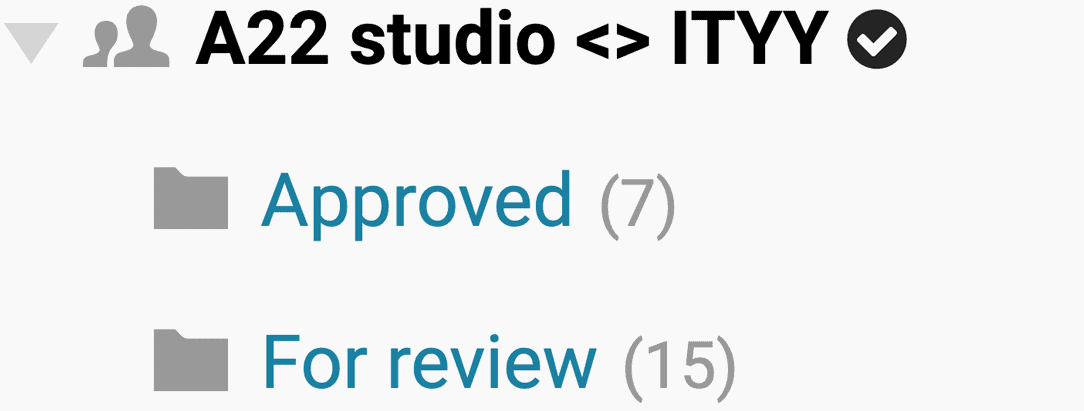
Teach. When teaching data visualization, Datawrapper’s teams enable you to have an overview of all of the students’ exercises and assignments. Create a new team for each class and invite your students, then create a new folder for each assignment and let your students move their submissions there. You can check their data, sources and chart design choices directly in the app.

Questions you might have
We created a few Academy articles that help you figure out how to create a team, invite others to it, become a team owner and how to leave or delete a team. Here are answers to the most likely common questions:
Can I be in multiple teams?
Yes. There’s no limit to the number of teams you can create or join and the number of people you can invite to them.
How do I know in which team I’m creating a visualization?
Before you create a new visualization with a click on New Chart / New Map / New Table at the top, make sure you create it in the right team. To do so, click on ☰ in the upper right corner and see which team has a checkmark next to its name. This is the team your visualization will be created in. You can choose another team by clicking on it. Learn more in our Academy article “How to select an active team (and what that means)”.
Can I still create private visualizations?
Yes. Any visualization that’s stored in your “My Charts” section can only be seen and edited by you alone. To make sure that new visualizations end up in your “My Charts”, go to My Teams and select (no team)** as active team. You can also do this through the ☰ menu in the upper right corner.
Can I move visualizations between teams or between my private & team folder?
Yes, you can always move charts, maps, and tables between all of your teams and your private folder, in any direction. To do so, go to Team Charts, select a chart from a team or your private My Charts folder and drag it to a folder in another team.
Can others edit my visualizations when they are in a team folder?
Yes. Every member of your team can edit, publish or embed any visualization that’s in a team folder.
If you have any more questions, please let us know in the comments below or with an email to support@datawrapper.de. Also, if you’re using the teams feature in a way that might be interesting for other readers of this blog, get in touch with us, too. We’d love to write about it.


