New: Small multiple column charts in Datawrapper
February 18th, 2025
6 min
Datawrapper lets you show your data as beautiful charts, maps or tables with a few clicks. Find out more about all the available visualization types.
Our mission is to help everyone communicate with data - from newsrooms to global enterprises, non-profits or public service.
We want to enable everyone to create beautiful charts, maps, and tables. New to data visualization? Or do you have specific questions about us? You'll find all the answers here.
Data vis best practices, news, and examples
250+ articles that explain how to use Datawrapper
Answers to common questions
An exchange place for Datawrapper visualizations
Attend and watch how to use Datawrapper best
Learn about available positions on our team
Our latest small and big improvements
Build your integration with Datawrapper's API
Get in touch with us – we're happy to help
This article is brought to you by Datawrapper, a data visualization tool for creating charts, maps, and tables. Learn more.

Datawrapper is a web-based tool that has enabled many people over the years to build beautiful charts, maps and tables. Be it a journalist at a newspaper, an analyst at a financial institution or a public servant in a government department – we want to help everyone to create data visualizations easily.

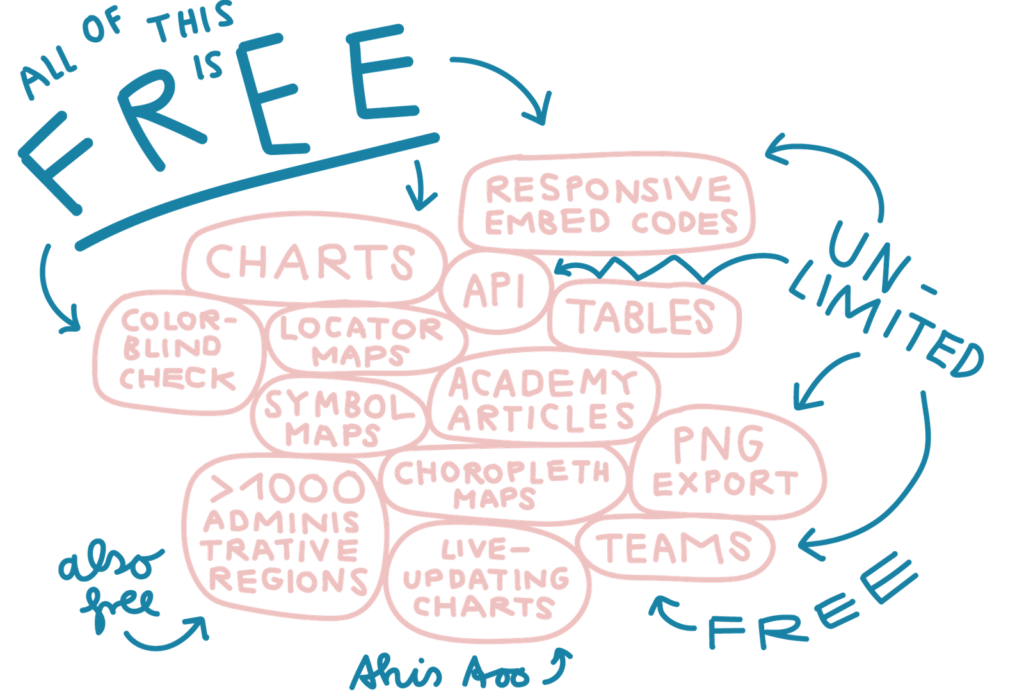
We’re excited to tell you that we just got a big step closer to that goal. Starting today, many Datawrapper features are free – features you previously had to pay for – that will help people to create more and better charts. Datawrapper’s free plan is now stronger than ever. That’s a big step, so let’s see what the changes mean for you:
Our new Free plan has most of the features of the Single and Team plans you previously had to pay for. We’re also lifting the limits on the number of chart views and locator maps. That means you can now:
Besides the Free plan, we still continue to offer the Custom and Enterprise plan with features like design customization to your styleguide, full-vector SVG and PDF export and self-hosting. We’re looking forward to keep providing and extending these features and plans in the future.
Relying on a service you don’t pay for can feel odd: There must be a downside to it, no? We hear you. And we promise: There is not. Even on the free plan, we ensure to you:


Great question! We’re a customer-funded company without external investors – and very proud of it. Datawrapper is used by thousands of people every day, as well as some great organizations like The New York Times, Reuters, Quartz and Süddeutsche Zeitung.
Yet from day one, a lot of our current users and customers found out about Datawrapper through workshops, university classes or by trying out the tool after spotting an embedded chart online. We want to make it even easier to do that with this change. Over the long term, this will benefit both the people who use Datawrapper, as well as the company itself.
With freeing our Single and Team plans, we enable more people to create charts with Datawrapper. That means we’re coming closer to our mission to let everyone create better and more charts.
We hope that our change in pricing makes a lot of people happy. Here’s what you can do now:
If you’re not a Datawrapper user yet and curious to create visualizations for free: Great! Start using our tool with a click on Start creating over at datawrapper.de.
If you’re already a Datawrapper user and happy with the plan you’re using, you can simply continue to use it with the same terms and pricing.
If you want to upgrade or downgrade your plan, log into your Datawrapper account, click on ☰ and Settings > Upgrade in the top right. You will arrive on a page where you can select any of our available plans.
And if you want to give us feedback: Please do so! Write to us at support@datawrapper.de. As always, we’re looking forward to hearing from you.
Comments