This article is brought to you by Datawrapper, a data visualization tool for creating charts, maps, and tables. Learn more.
Introducing Datawrapper for PowerPoint

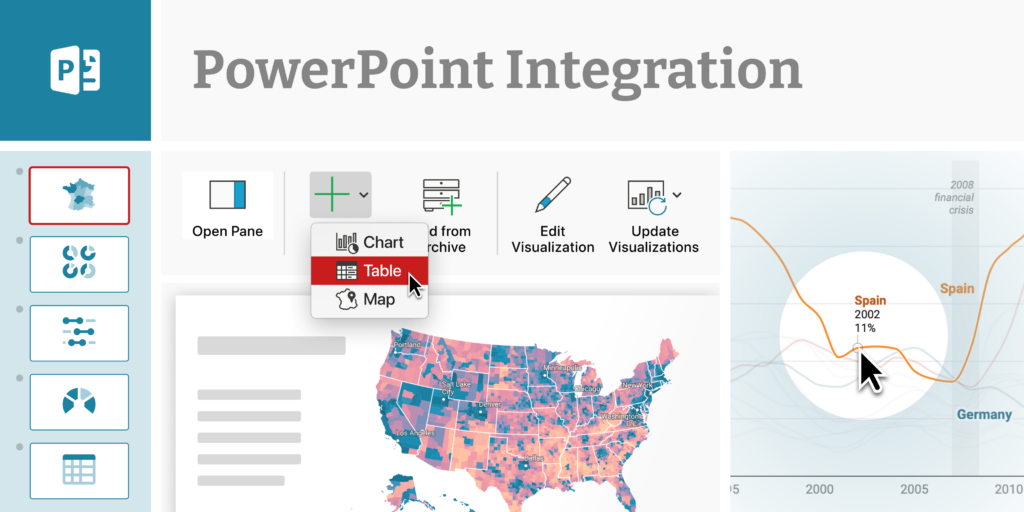
Datawrapper is a tool used by newsrooms, financial institutions, NGOs, government agencies, and others to create beautiful and engaging charts, maps, and tables. Those visualizations are used on the web, in print — and often in slide shows. Today, we’re releasing a free Datawrapper add-in for PowerPoint that makes great data visualization available in the world’s most popular presentation tool. Download it directly from Microsoft AppSource.
Bringing data vis superpowers into PowerPoint
With the Datawrapper add-in, you have access to all your Datawrapper visualizations from within PowerPoint. With a few clicks, you can embed them, edit them, and keep them up-to-date — all directly from your presentation.
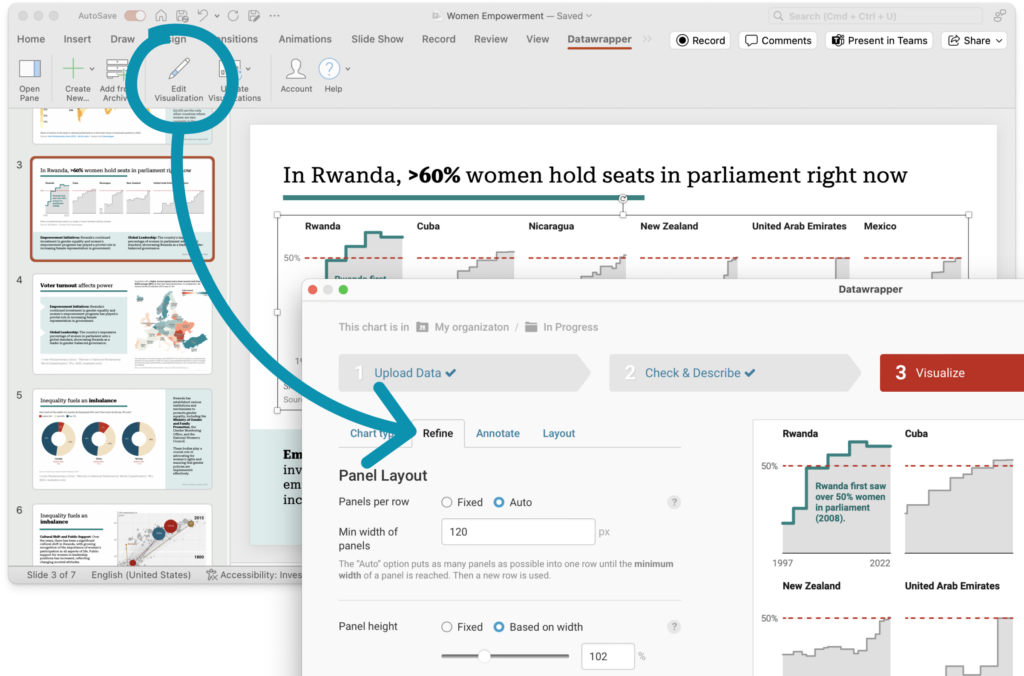
Create and edit at the speed of thought
In addition to embedding visualizations from your archive, you can create new visualizations and edit existing ones directly in PowerPoint. You have access to the full Datawrapper editor, including all visualization and annotation options and live collaboration.
For your eyes only: confidential by default
You don’t need to publish your visualizations to bring them into PowerPoint: all Datawrapper visualizations in PowerPoint are private by default. You can upload your datasets, create new visualizations, and embed them in PowerPoint without ever publishing anything to the web.
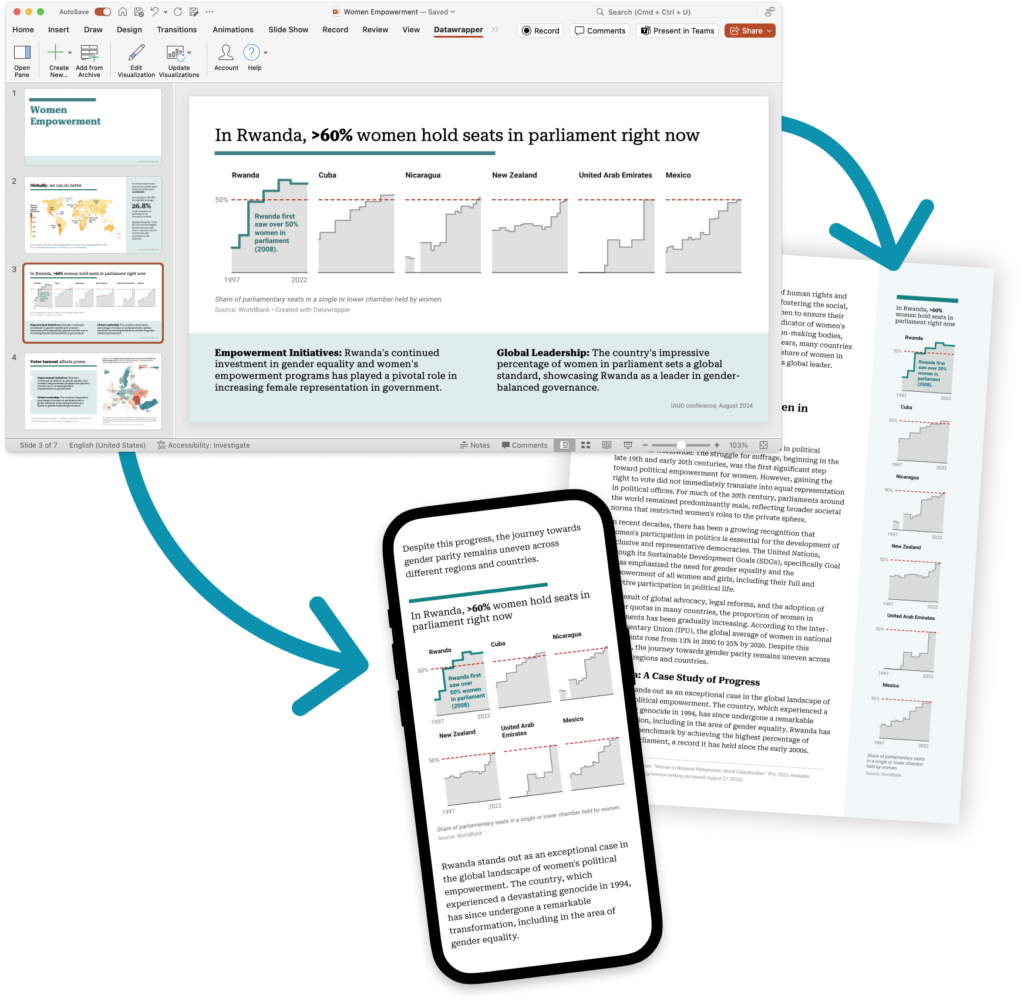
Works on your machine. And your colleague’s.
We believe your presentations should remain accessible to everyone, regardless of your tool choice: whether you share your slides with a colleague who may not have the Datawrapper add-in installed, export them as a PDF, or open them on a mobile device. That’s why all visualizations created with Datawrapper will always display correctly, even if you don’t have the add-in installed.
Collaborate & update with one click
Because Datawrapper visualizations can be collaboratively edited in real time and connected to live data sources, your embedded visualizations may be out of date just before your big presentation. But not to worry: Your visualizations stay connected to Datawrapper, and you can update them all with one click right before you take the stage.
Reuse your visualizations on the web, social media, print…
The charts, maps, and tables you create with Datawrapper in PowerPoint are fully-featured Datawrapper visualizations, ready to be adapted to all your channels. Your visualizations won’t just look great in PowerPoint — they’ll also shine as interactive and responsive embeds on your website, as PNGs in a social media post, and even in PDF and print reports. That’s how you keep the editing work light and your chart design consistent across platforms.
Embed interactively
Some visualizations are simply better with interaction — to zoom into maps, see tooltips when hovering over data points, or sort tables. That’s why we’ve created an additional Datawrapper Interactive Visualization add-in that lets you add to your slides the fully interactive visualizations you know from the Datawrapper app. Learn more about it in our Academy.
We’re excited to make the Datawrapper add-in available to all users today. You can download it for free from Microsoft AppSource. It’s supported for all major PowerPoint platforms (Windows, macOS, Online).
To learn how to use the Datawrapper add-in, visit this Academy article.
If you have any questions or feedback, please reach out to support@datawrapper.de. We’re looking forward to hearing from you.


Comments