This article is brought to you by Datawrapper, a data visualization tool for creating charts, maps, and tables. Learn more.
New in symbol and choropleth maps: cropped view and inset maps

When you create a choropleth or symbol map with Datawrapper, you can choose from over 4,000 background maps (so far!) to put your data on. They cover different geographical scales, from the world, continents, countries, and states, to cities and city districts.
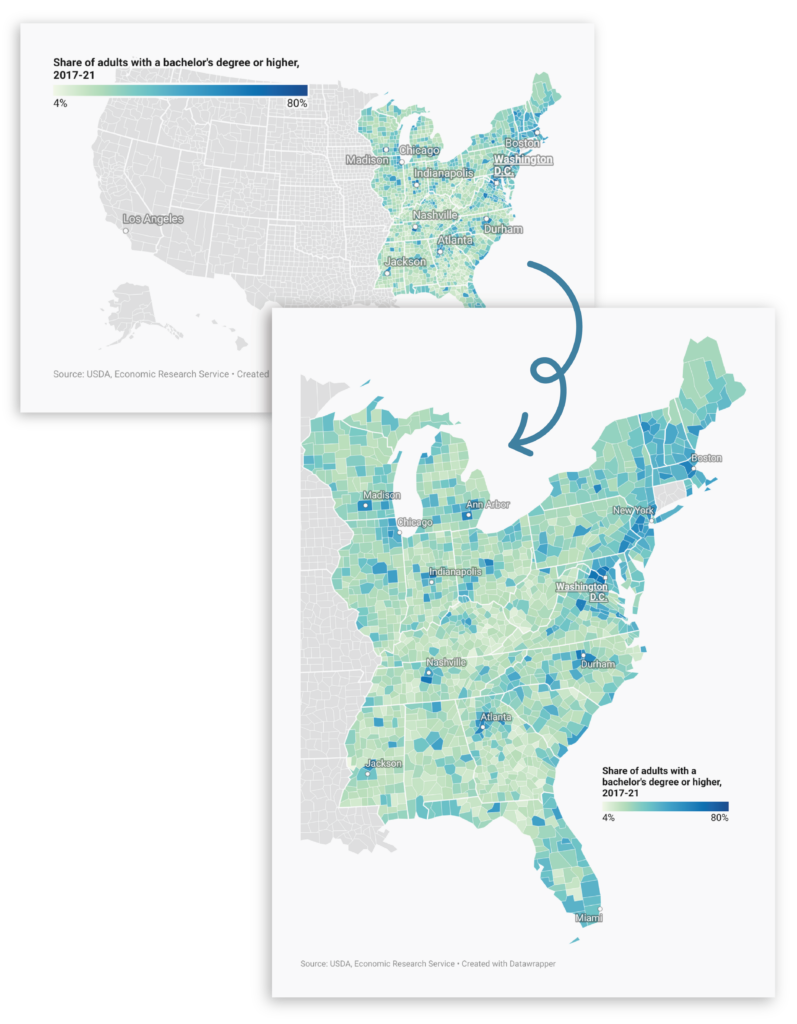
But sometimes, you might have or want to show data for only one part of that map – for example, only states in the east of the U.S., or only election districts in northern Berlin. Starting today, you can set a restricted map view to fit any basemap more closely to your needs. We’re also introducing inset maps that help your readers understand which part of the world they’re looking at.
Set a map view
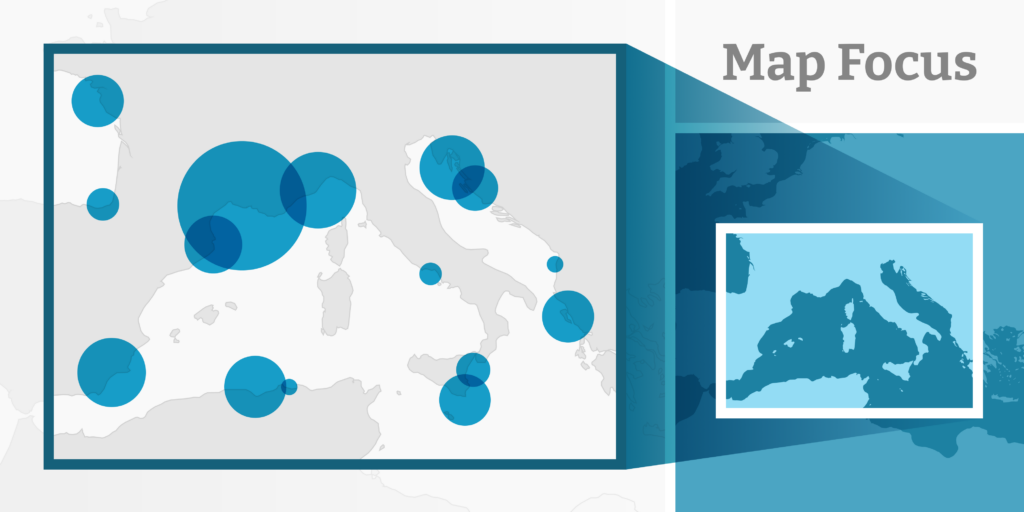
With the new map view feature in choropleth and symbol maps, you can choose whether to show the whole map, or crop to only show regions with data.

In choropleth maps, this is similar to the existing “hide regions without data” control — but now you have the option of cropping the view without hiding any data-empty regions that fall inside it.
Keep the context with an inset map
When the map view is cropped, it might be harder for readers to tell which part of the world they’re looking at. That’s why you can now add an inset map. An inset map is a miniature version of your main basemap that highlights the visible region, helping your readers orient themselves.
Inset maps aren't just useful for cropped map views. They're also available if you decide to make your map zoomable, so that readers don’t lose sight of the big picture when zooming in.
Refine the layout
When you use our new map view feature, Datawrapper will automatically figure out how cropped your map should be. But sometimes you may want to show a bit more of the surrounding area, or just leave extra space for annotations or a color legend. The extra padding option allows you to do just that. And, as in our locator maps, you can choose the position for your inset map to make the best use of the available space.
Do you have any thoughts about our new map view feature? Let us know at support@datawrapper.de.


Comments