Data Vis Dispatch, February 18: German election polls, corruption, and tariffs
February 18th, 2025
9 min
Datawrapper lets you show your data as beautiful charts, maps or tables with a few clicks. Find out more about all the available visualization types.
Our mission is to help everyone communicate with data - from newsrooms to global enterprises, non-profits or public service.
We want to enable everyone to create beautiful charts, maps, and tables. New to data visualization? Or do you have specific questions about us? You'll find all the answers here.
Data vis best practices, news, and examples
250+ articles that explain how to use Datawrapper
Answers to common questions
An exchange place for Datawrapper visualizations
Attend and watch how to use Datawrapper best
Learn about available positions on our team
Our latest small and big improvements
Build your integration with Datawrapper's API
Get in touch with us – we're happy to help
This article is brought to you by Datawrapper, a data visualization tool for creating charts, maps, and tables. Learn more.
The best of last week’s big and small data visualizations
Welcome back to the 89th edition of Data Vis Dispatch! Every week, we’ll be publishing a collection of the best small and large data visualizations we find, especially from news organizations — to celebrate data journalism, data visualization, simple charts, elaborate maps, and their creators.
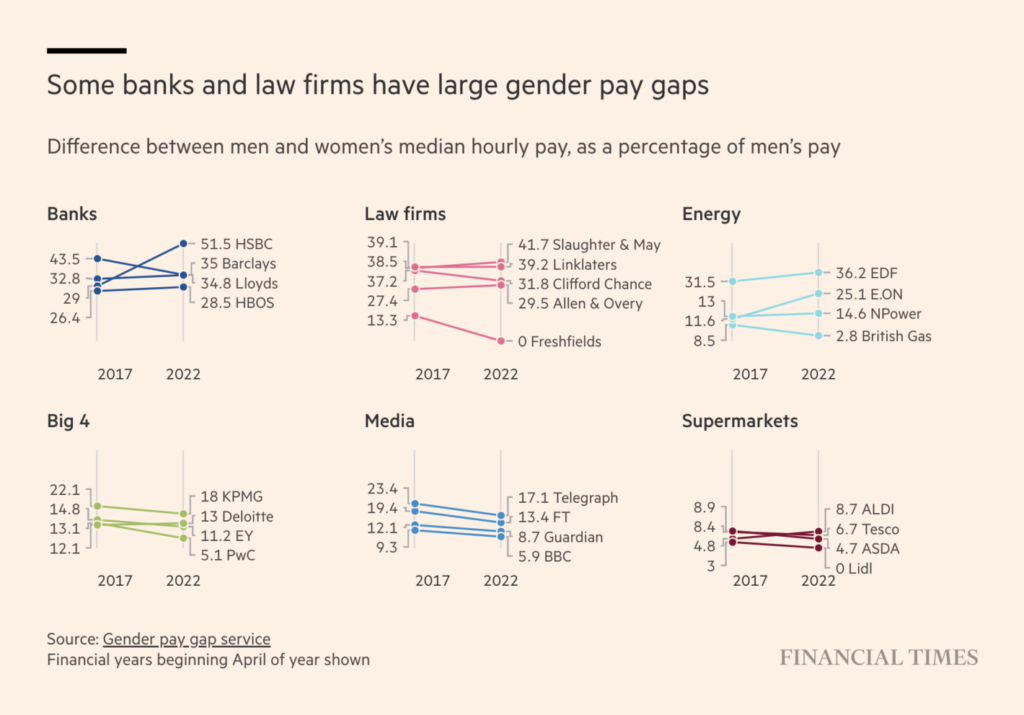
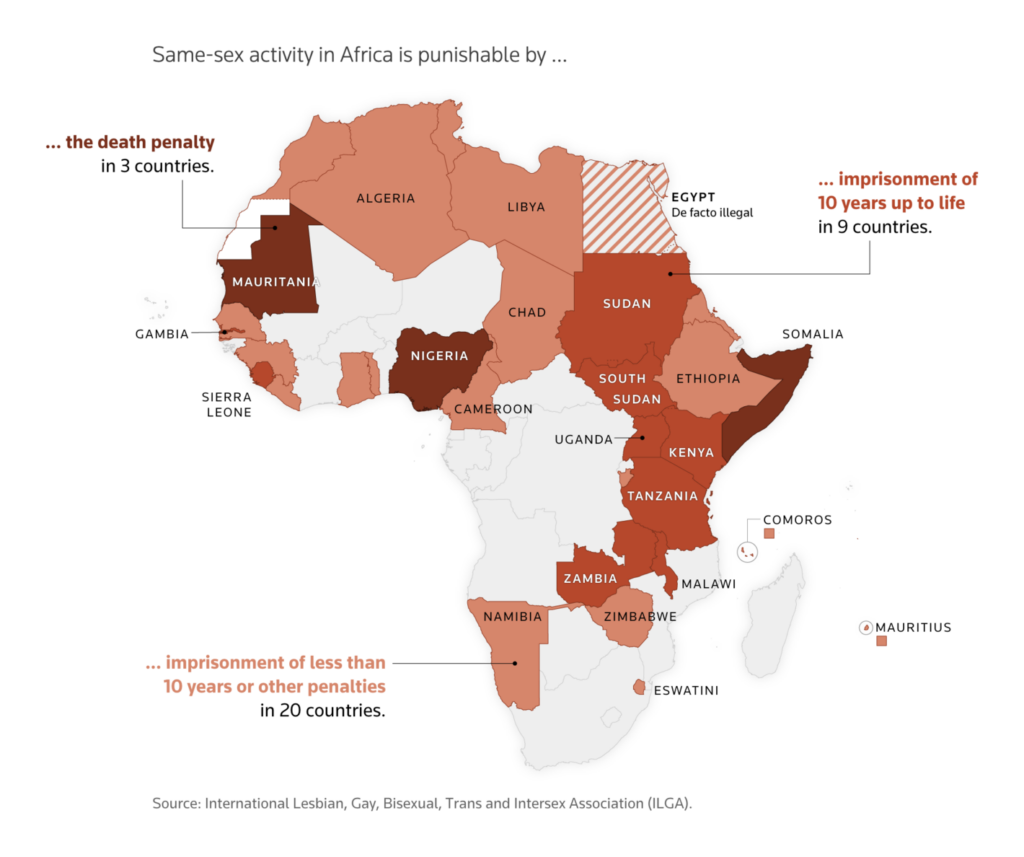
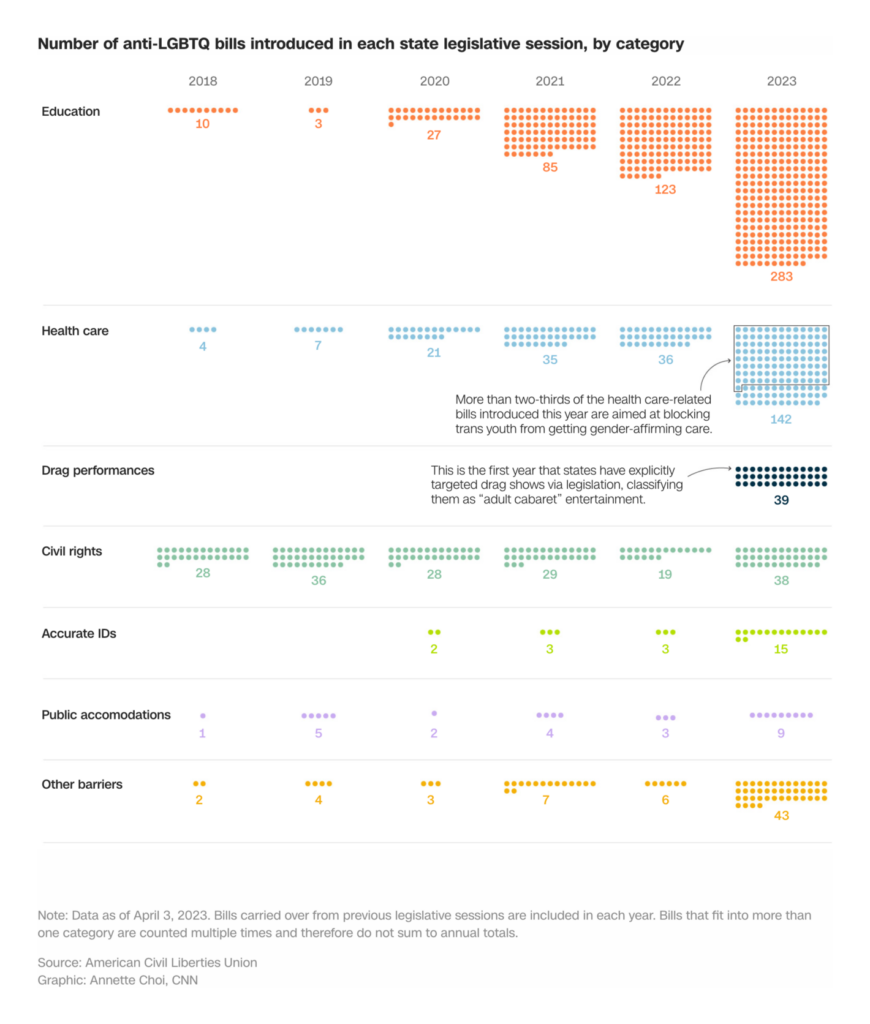
Recurring topics this week include the aftermath of a pandemic, gender pay gaps, and dwindling LGBTQ rights.
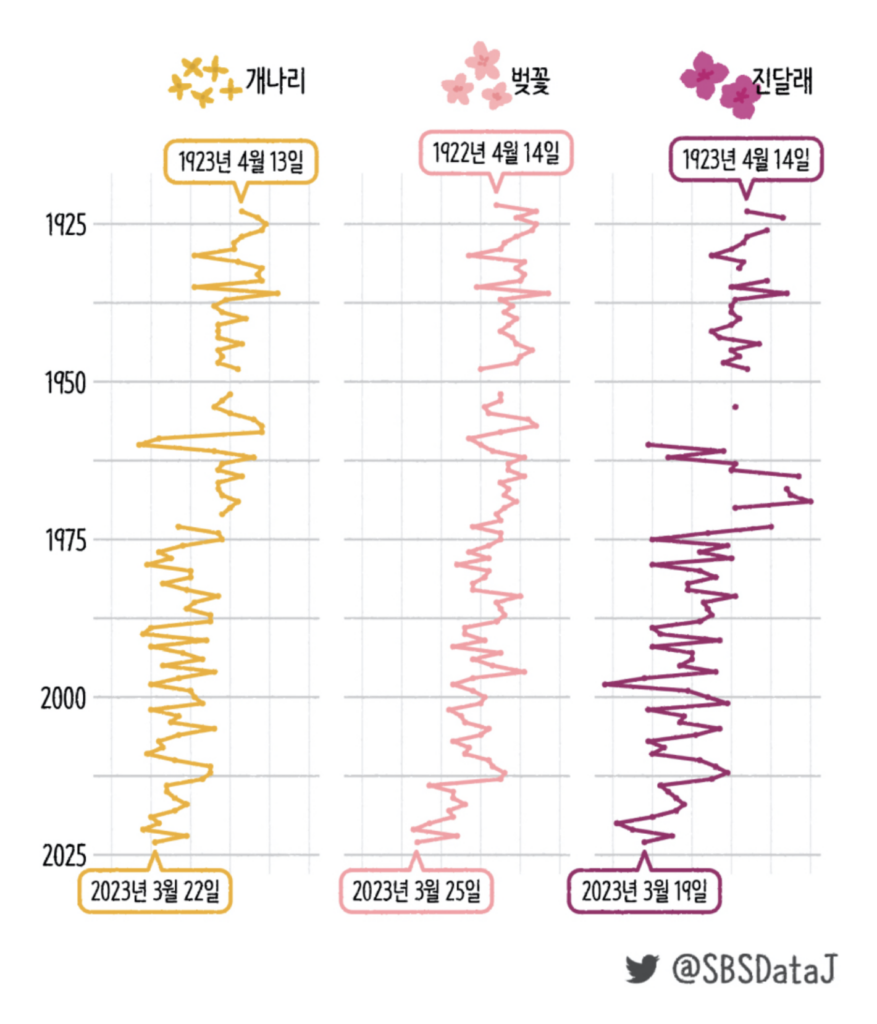
Following the Easter weekend, let’s first look at two charts: an early bloom in Korea and falling church attendance in the U.S., which has not recovered since the COVID pandemic.

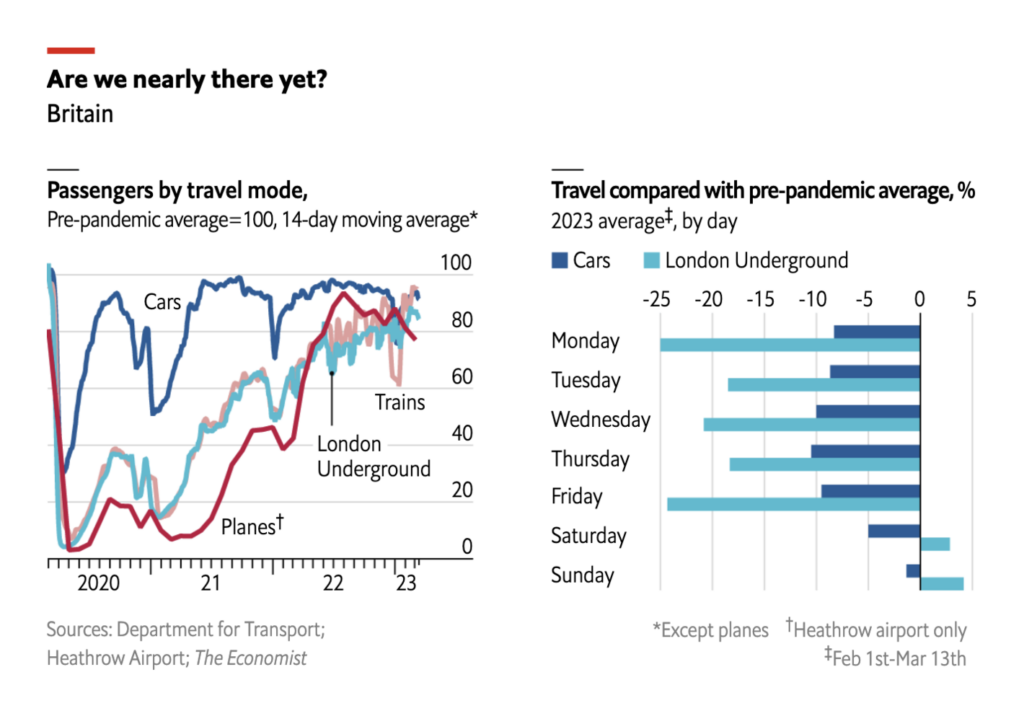
In the U.K., travel (by all means of transport) has nearly reached pre-pandemic levels.
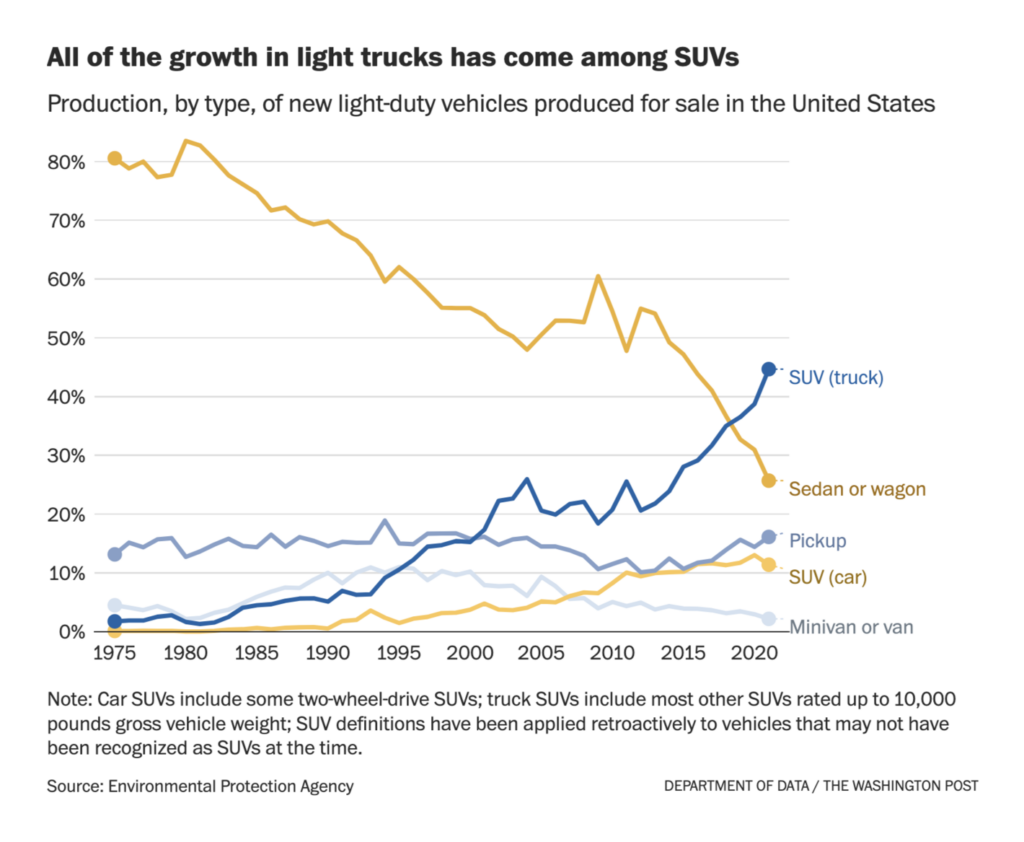
And the roads of all 50 states of the U.S. are now dominated by trucks that have taken over cars in the past few years. It’s considered bad news for safety as well as climate.
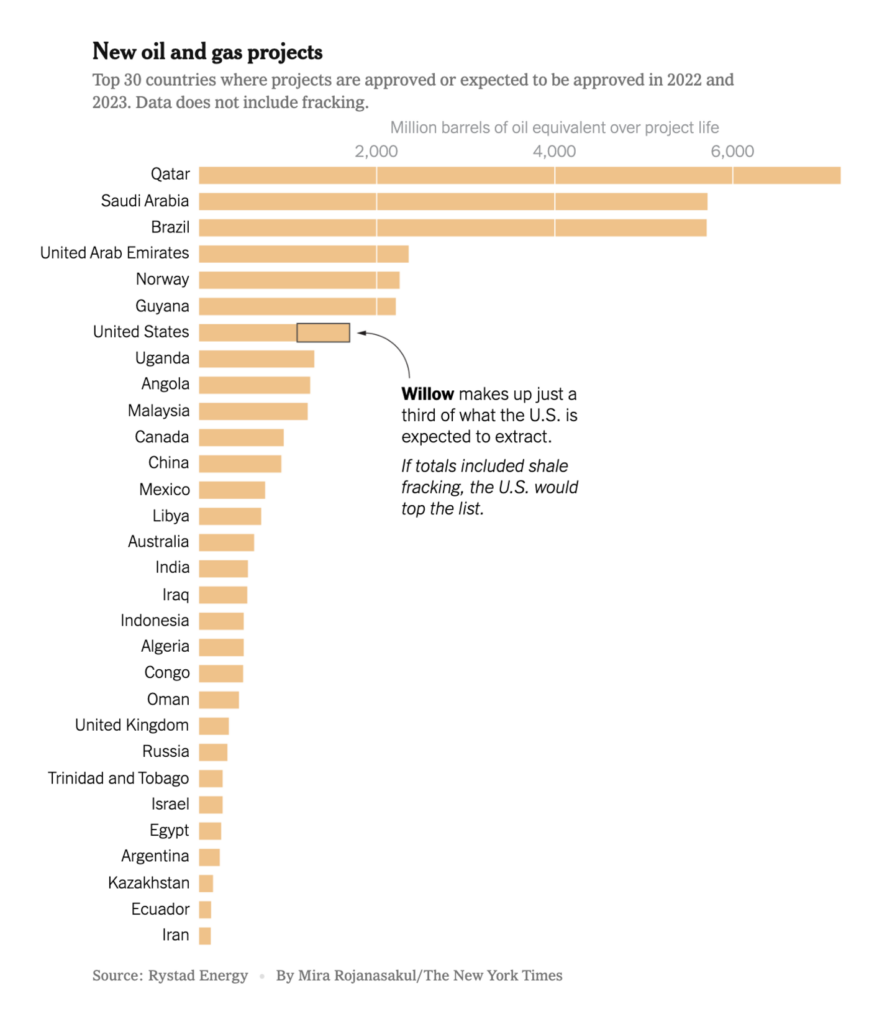
The world has also largely returned to fossil fuels, with hundreds of new oil and gas projects approved.
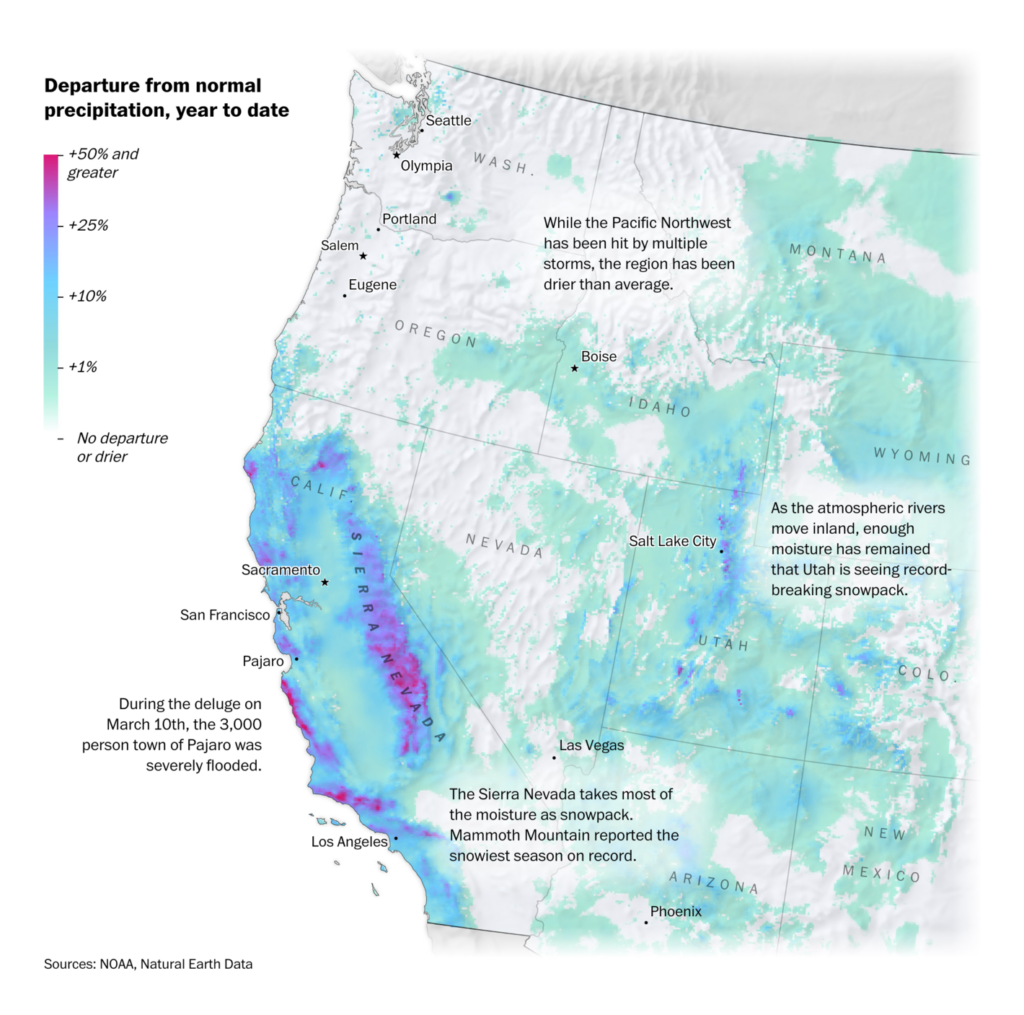
Meanwhile, the effects of climate change continue to be felt in the form of extreme weather.
Some good news: the south of Turkey boasts strong potential for solar power generation.
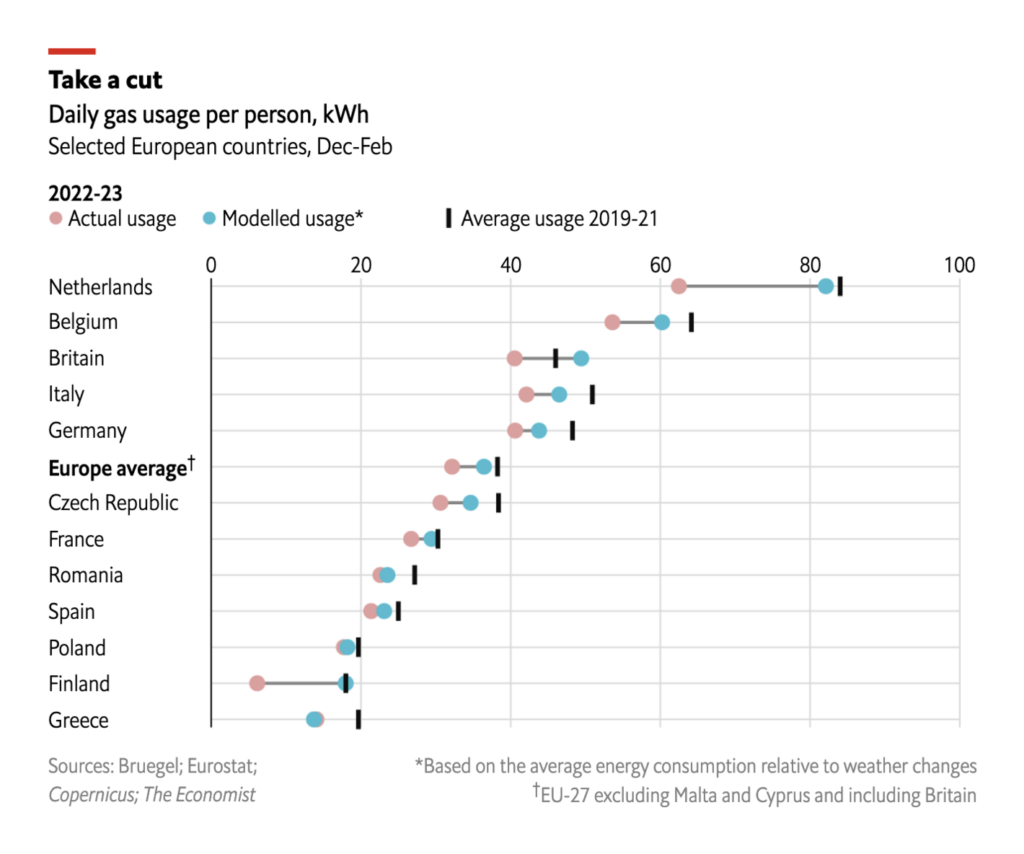
And Europe decreased its energy consumption this winter, partly thanks to mild temperatures and partly due to high energy costs caused by the war in Ukraine.
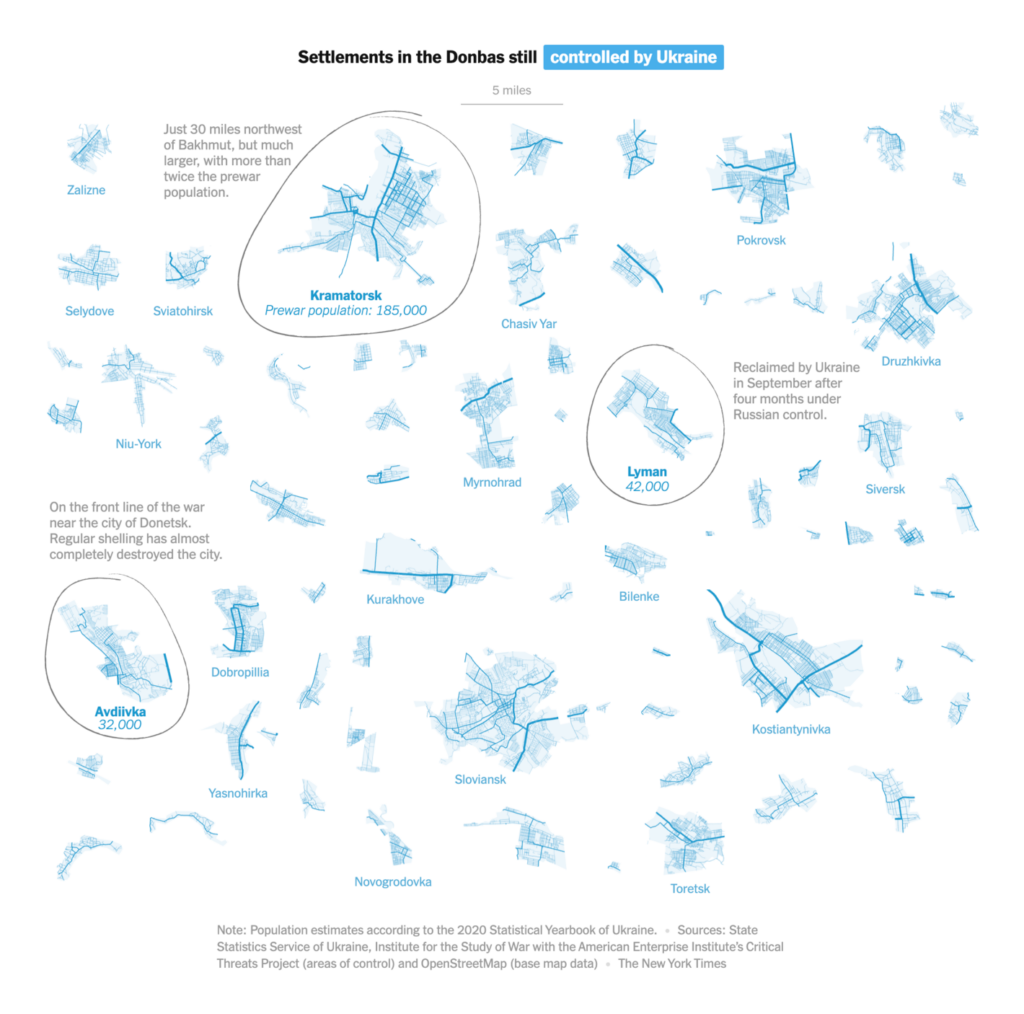
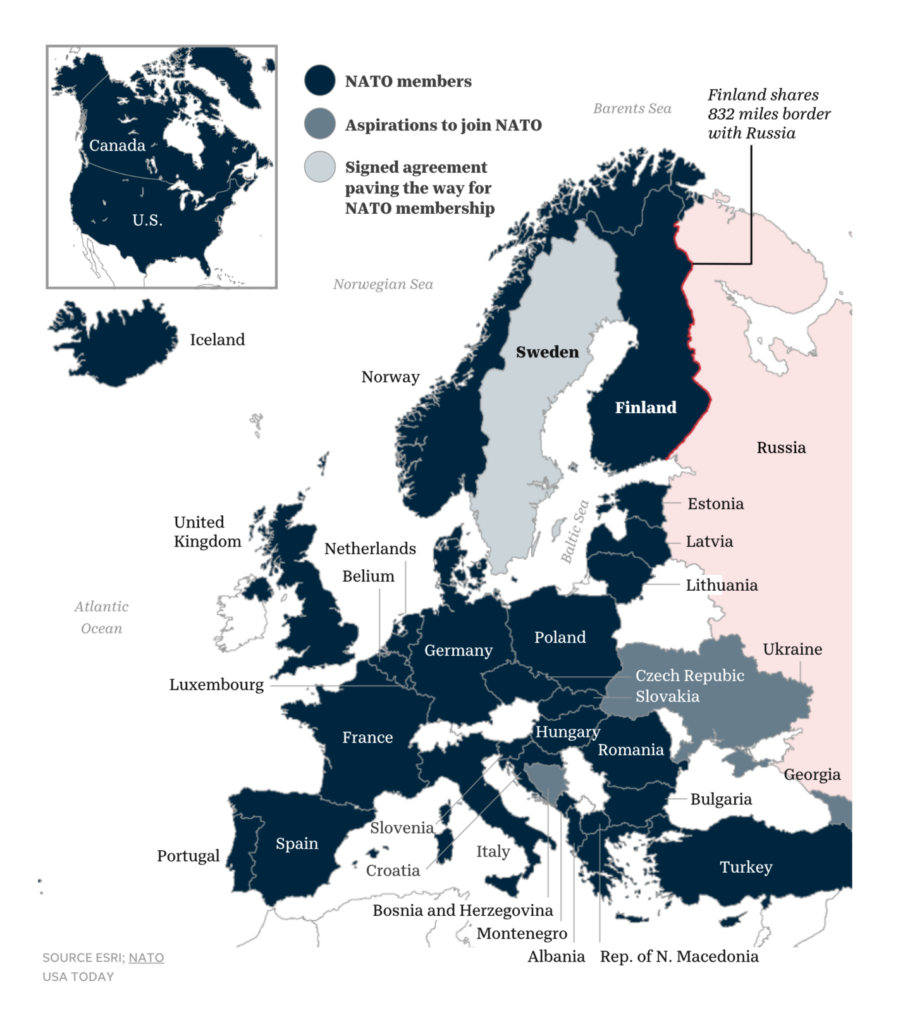
Global trade is expected to lag this year due to the Ukraine war and inflation.

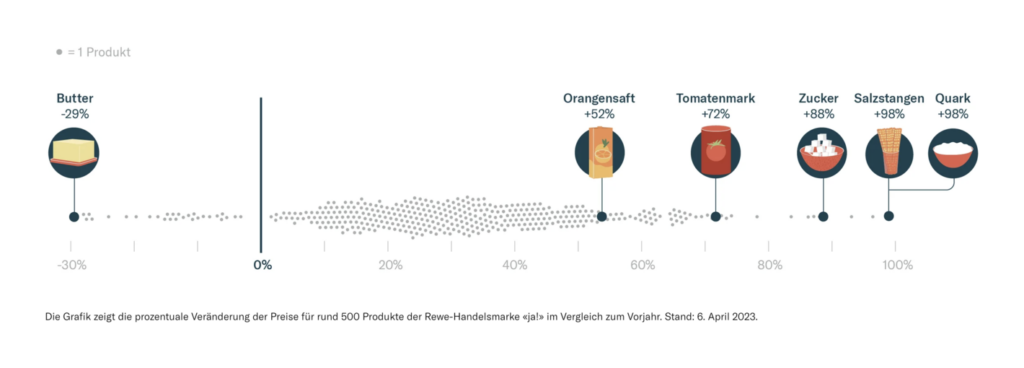
Finance and insurance companies reported the largest gender pay gap in the U.K.

And Uganda and the U.S. passed bills targeting LGBTQ rights.
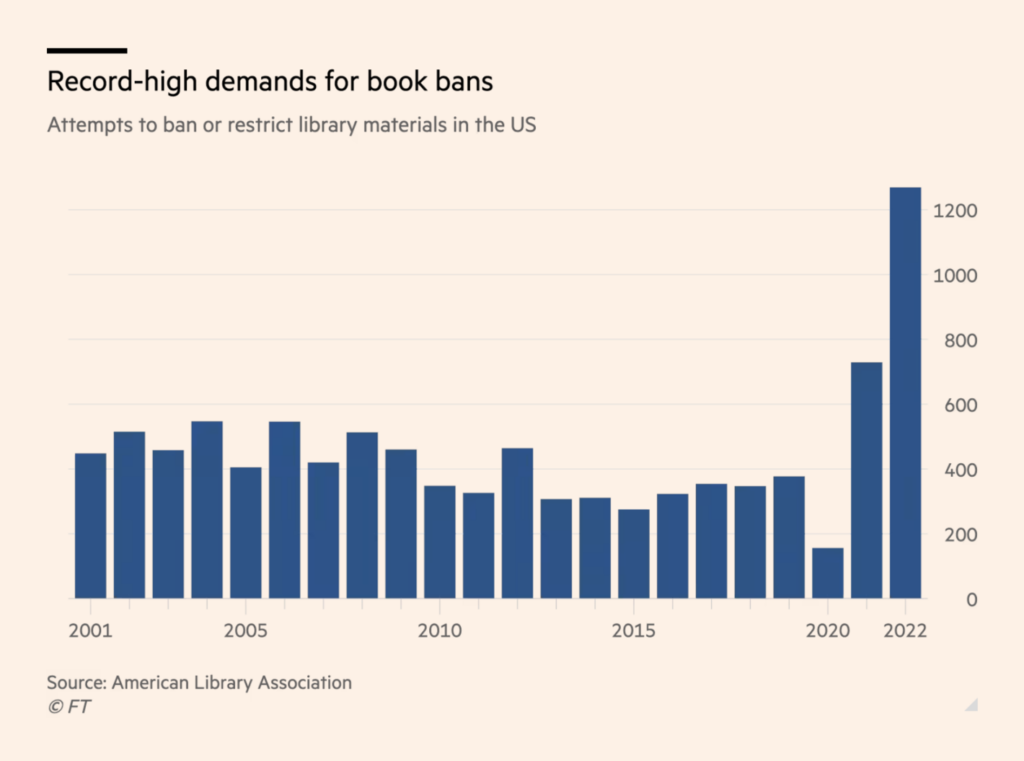
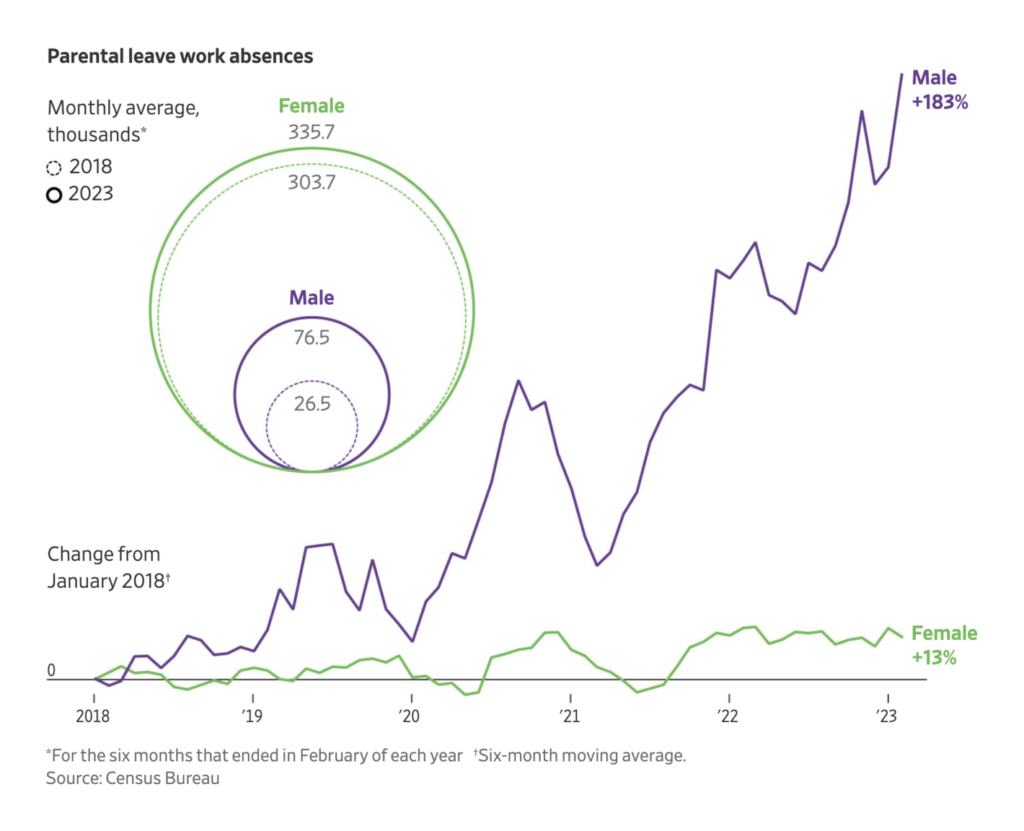
Although more Americans now take parental leave, other social programs introduced during the pandemic have ended.

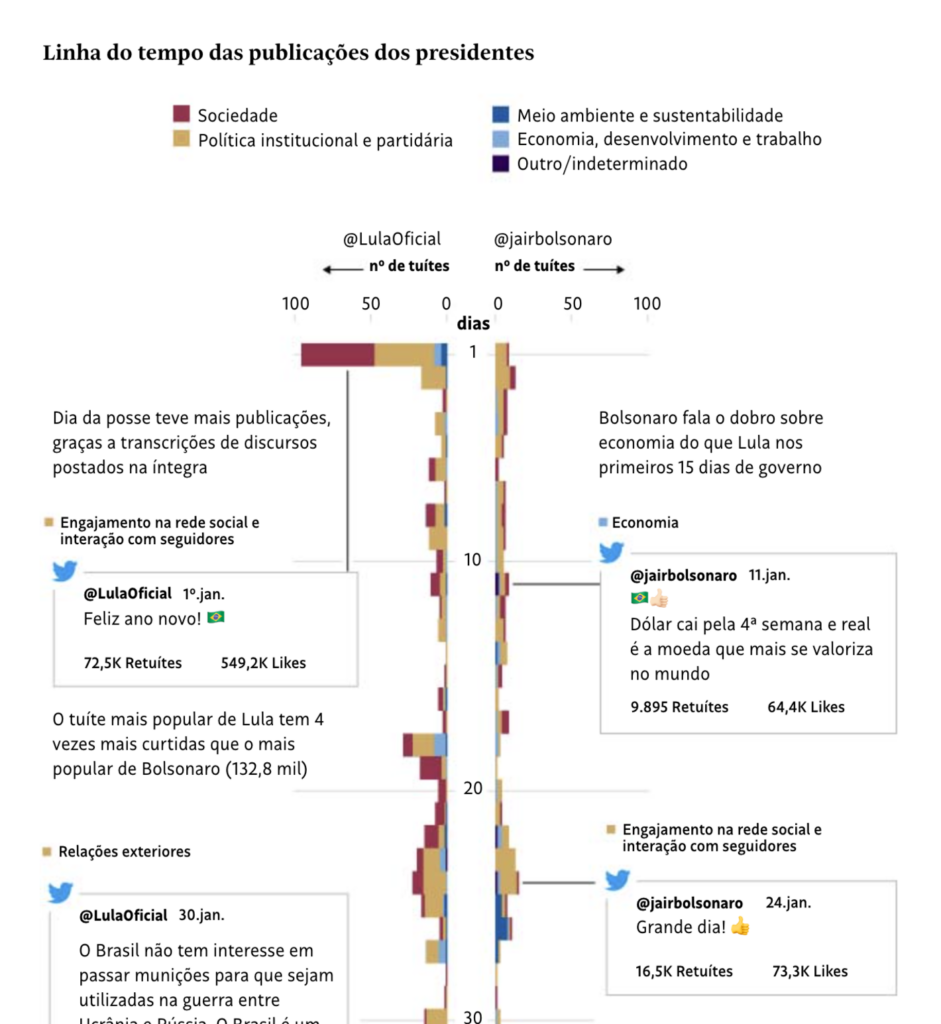
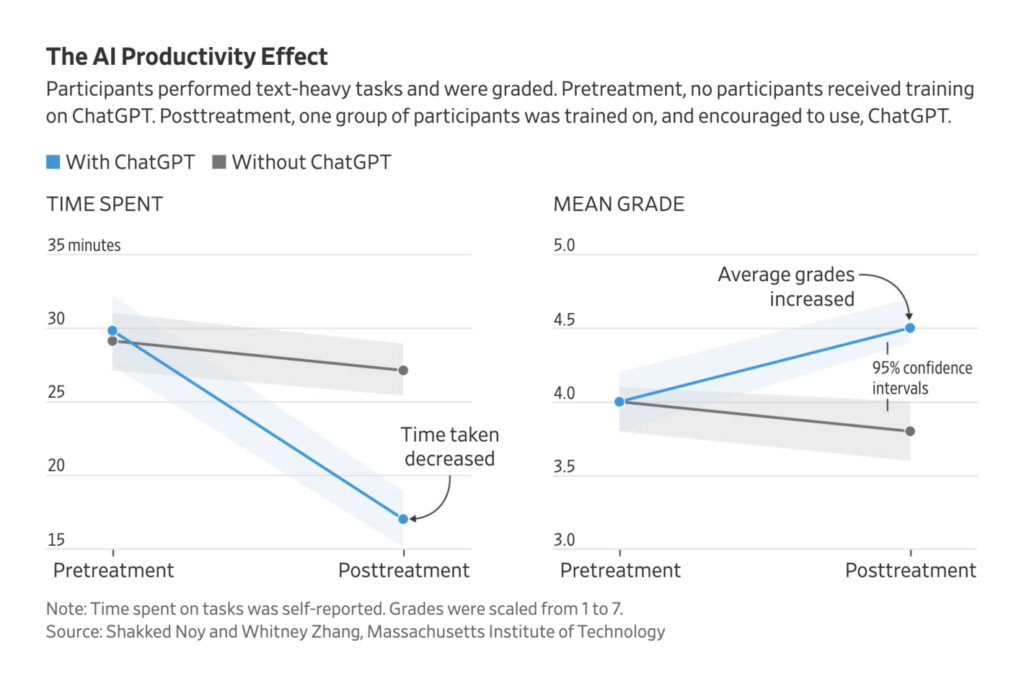
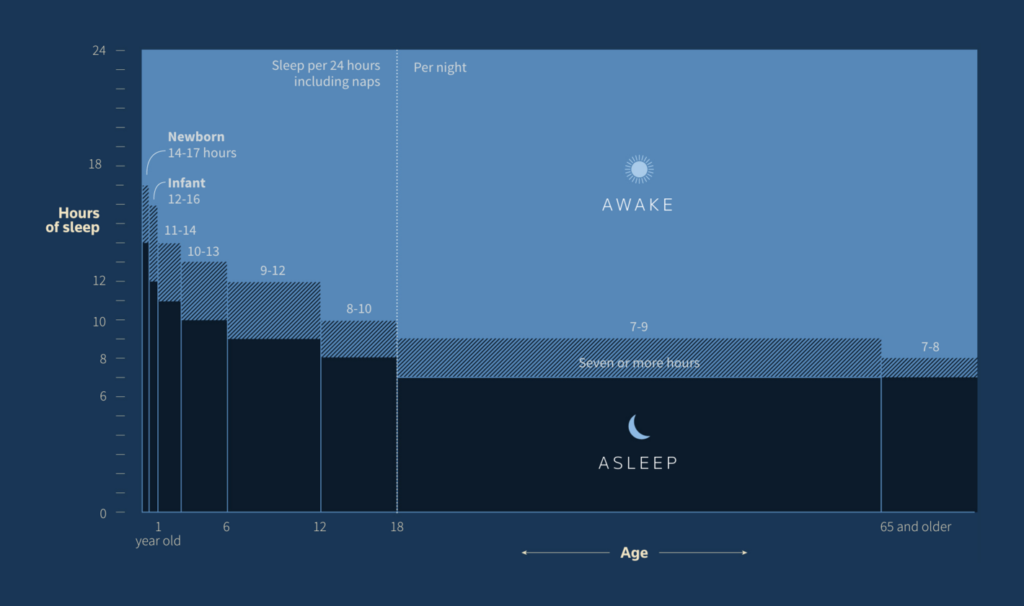
Other notable charts this week covered the tweets of Brazil’s president Lula, the effects of AI on productivity, and the importance of a good night’s sleep.
Applications are open for…
Help us make this dispatch better! We’d love to hear which newsletters, blogs, or social media accounts we need to follow to learn about interesting projects, especially from less-covered parts of the world (Asia, South America, Africa). Write us at hello@datawrapper.de or leave a comment below.
Want the Dispatch in your inbox every Tuesday? Sign up for our Blog Update newsletter!
Comments