We want to enable everyone to create beautiful charts, maps, and tables. New to data visualization? Or do you have specific questions about us? You'll find all the answers here.
The best of last week’s big and small data visualizations
Vivien Serve
Welcome back to the 155th edition of the Data Vis Dispatch! Every week, we publish a collection of the best small and large data visualizations we find, especially from news organizations — to celebrate data journalism, data visualization, simple charts, elaborate maps, and their creators.
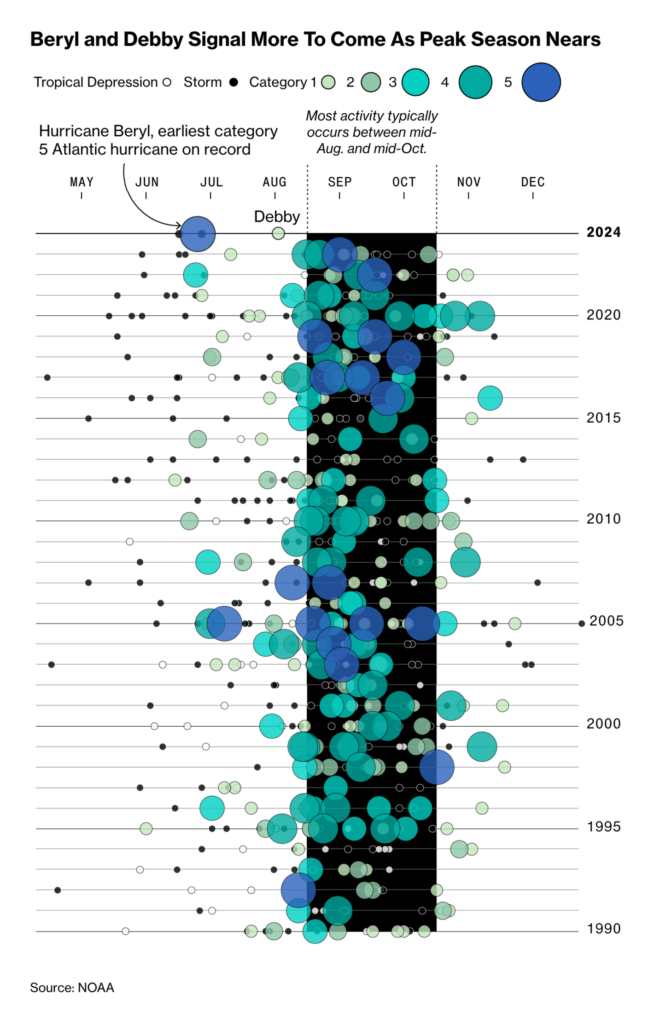
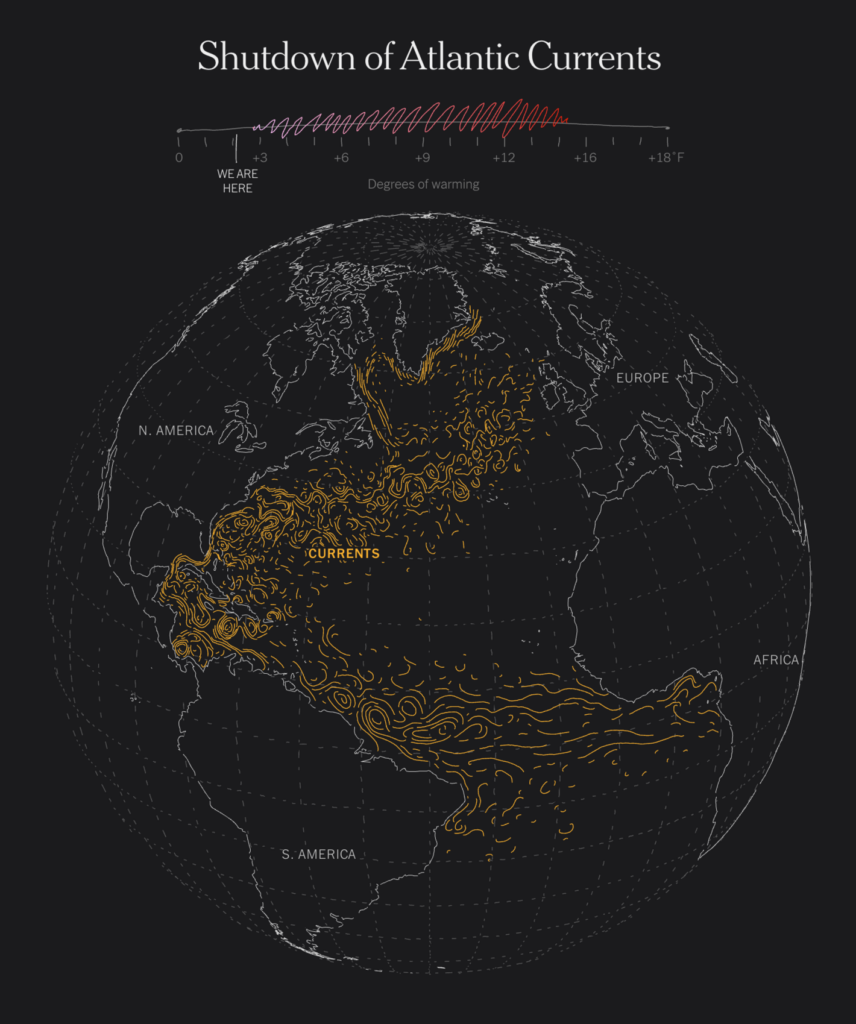
Recurring topics this week include climate phenomenons, artificial land, and the Olympics:
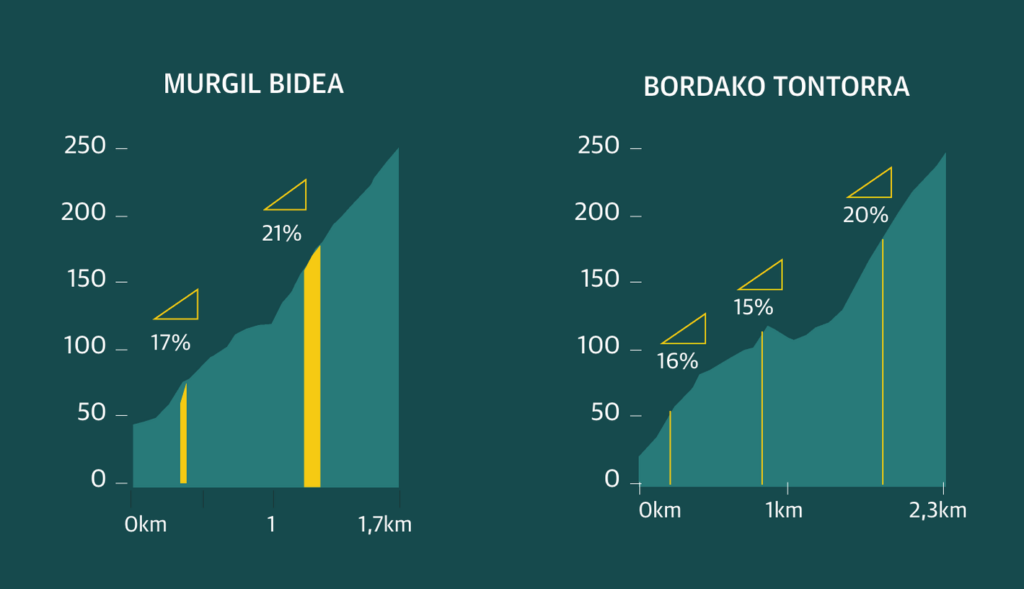
First up, the sporting event that has us all most excited this week: the 10th San Sebastian Classic, a road cycling day race:
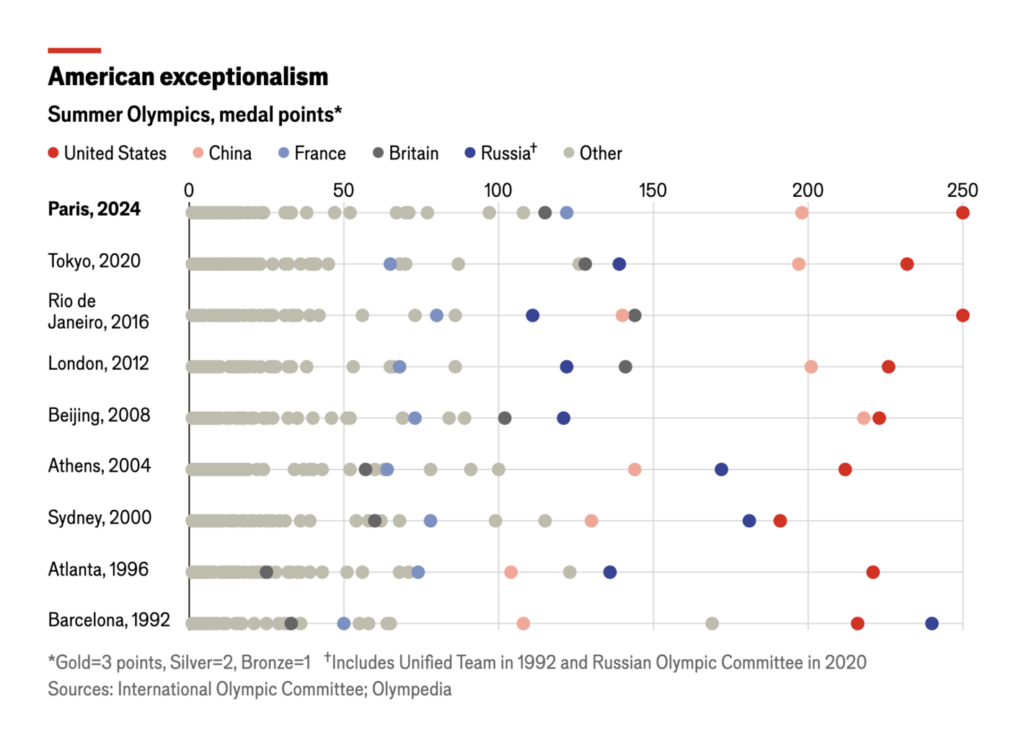
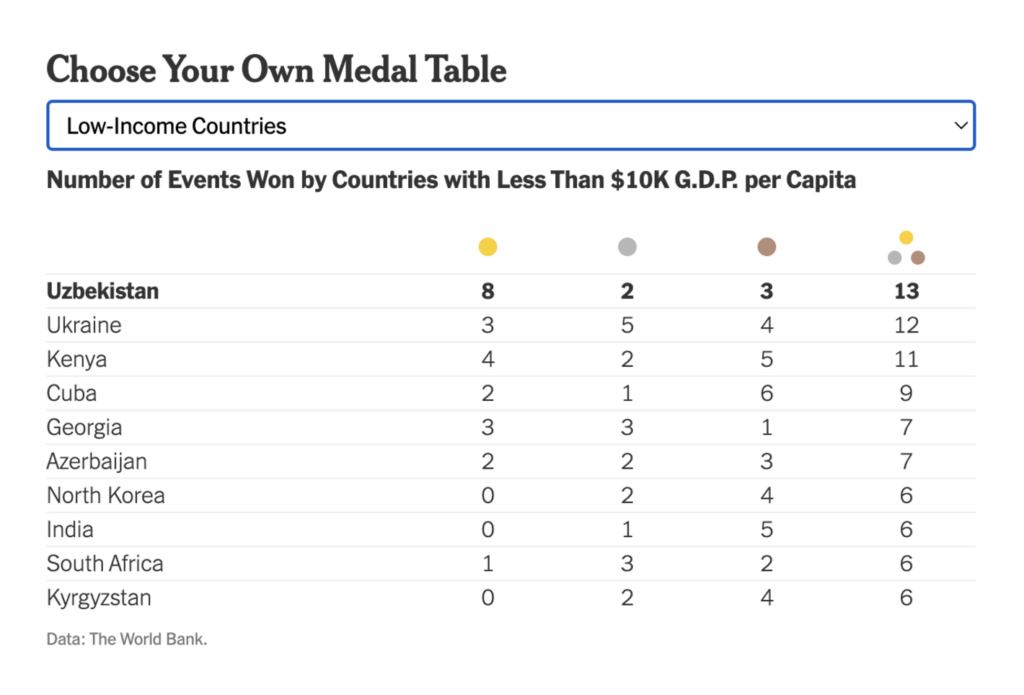
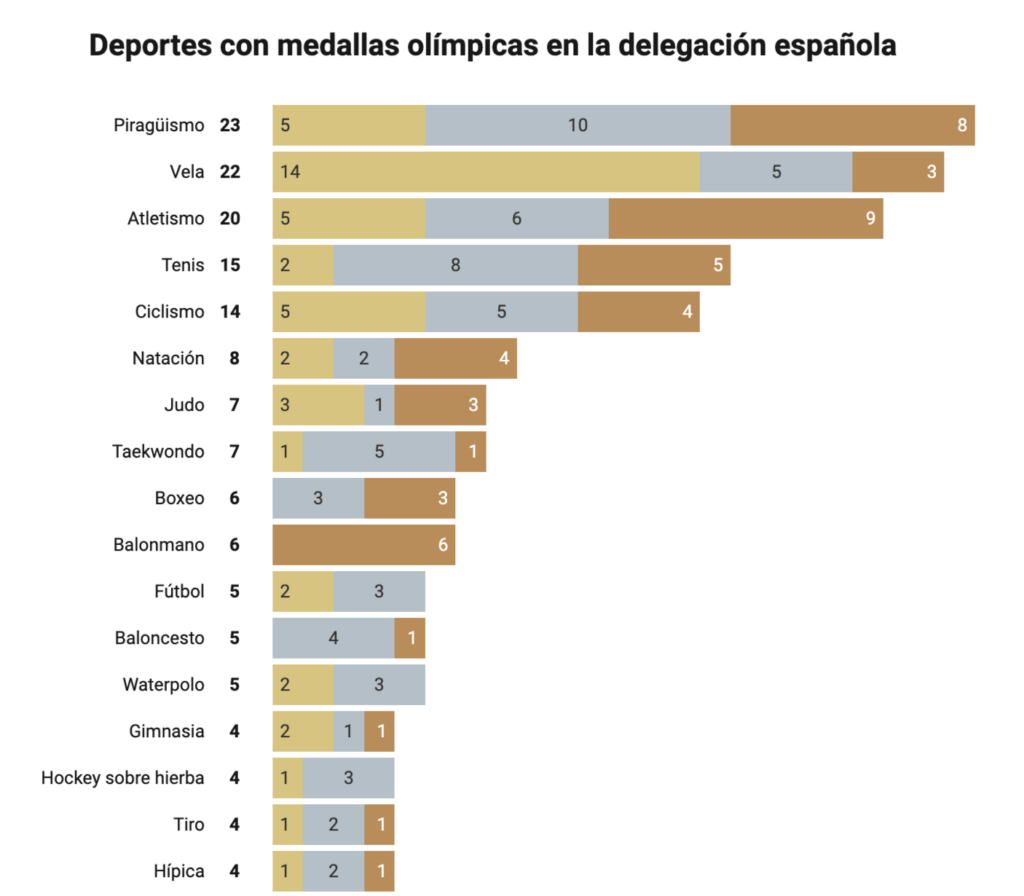
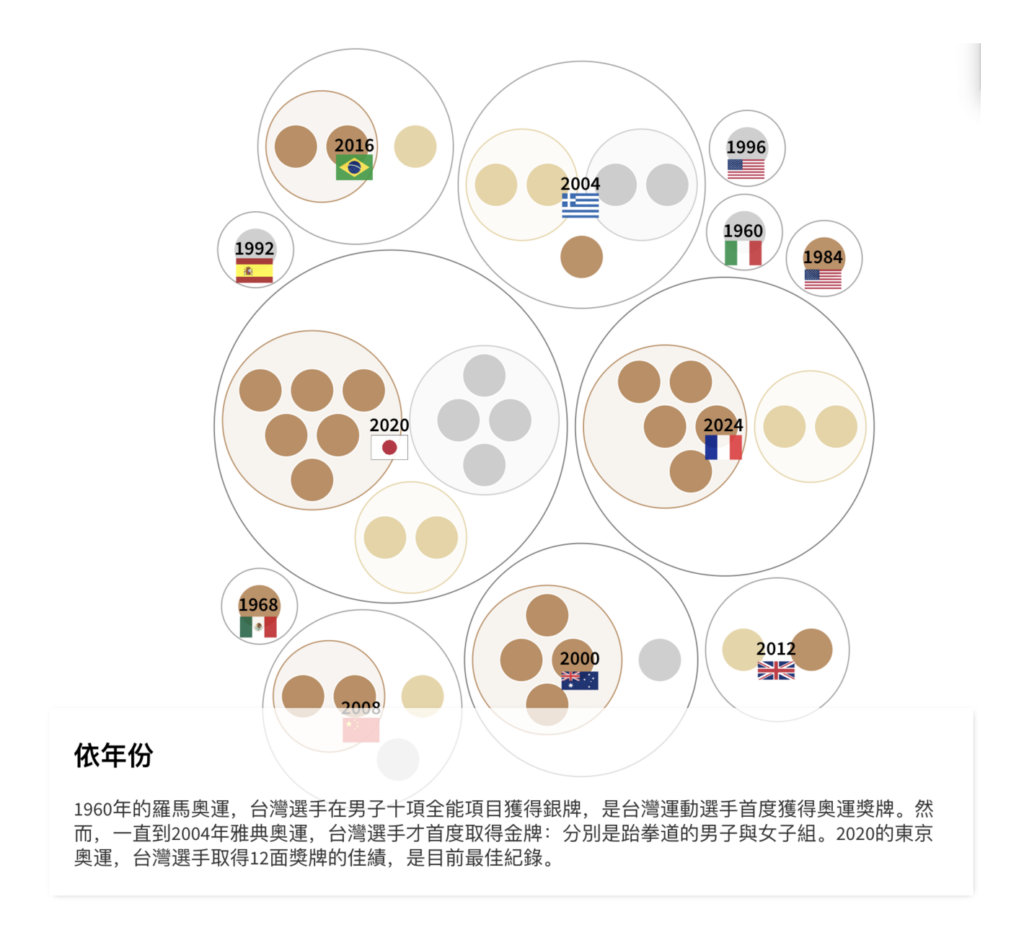
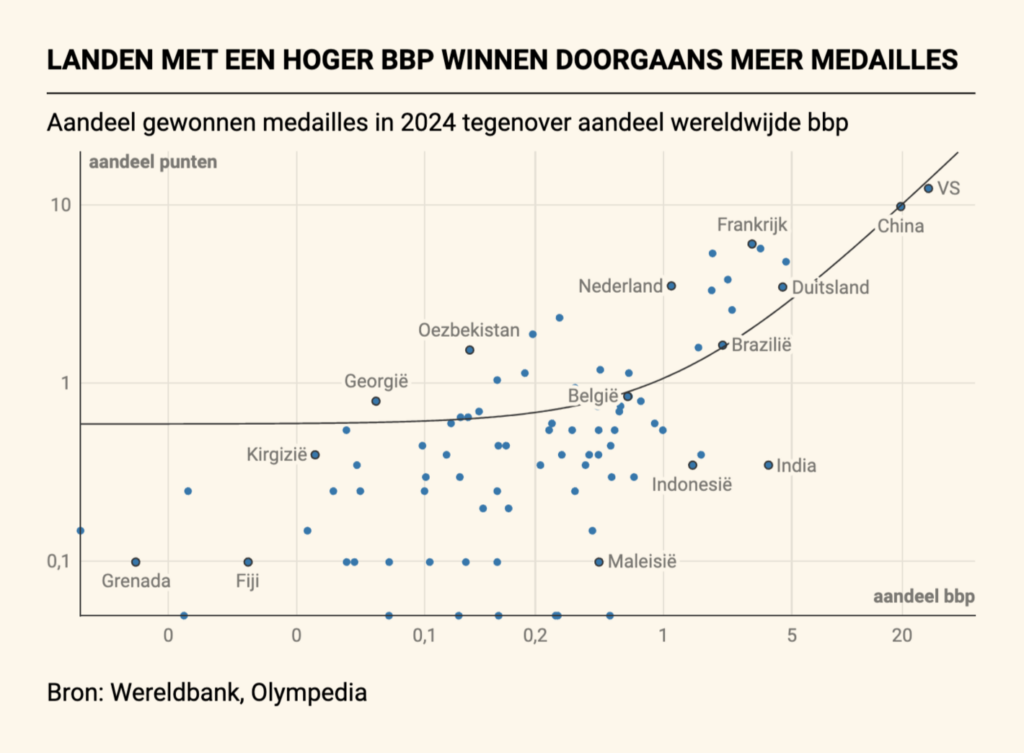
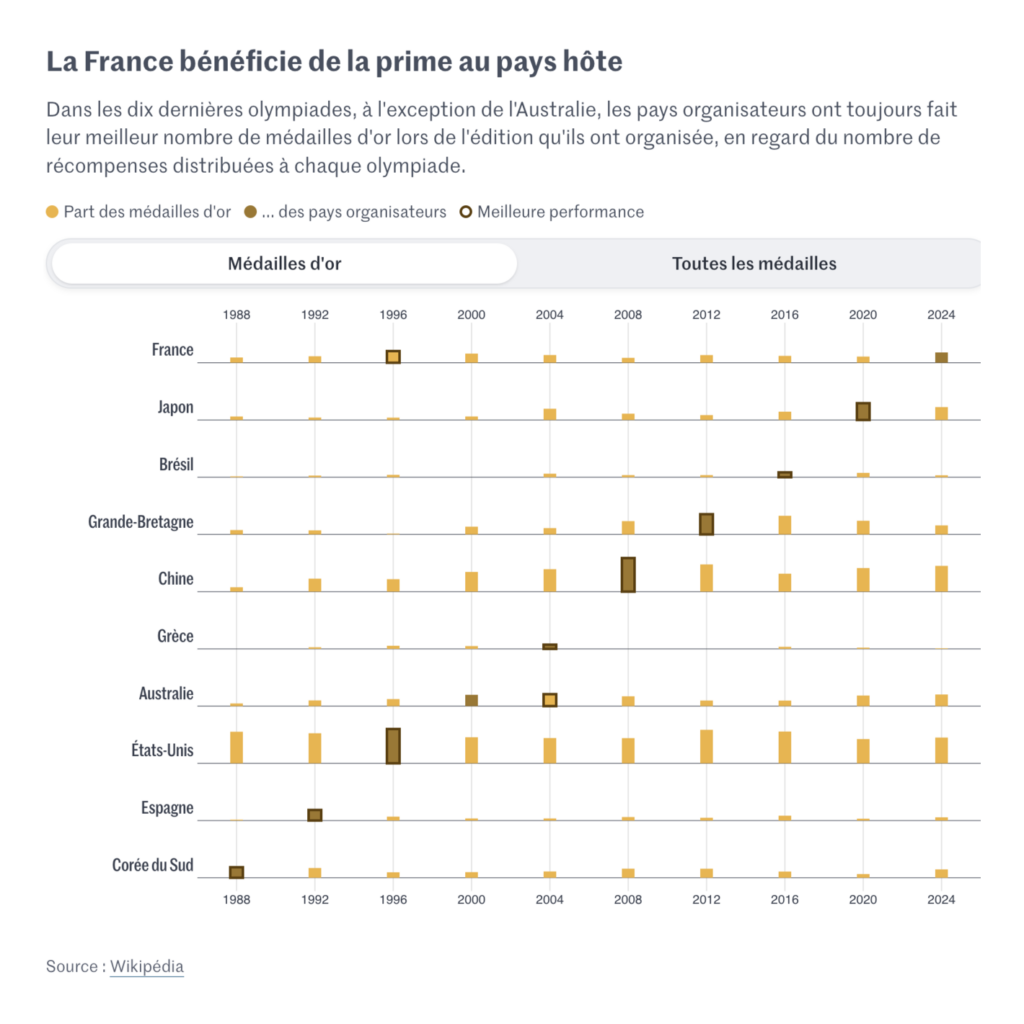
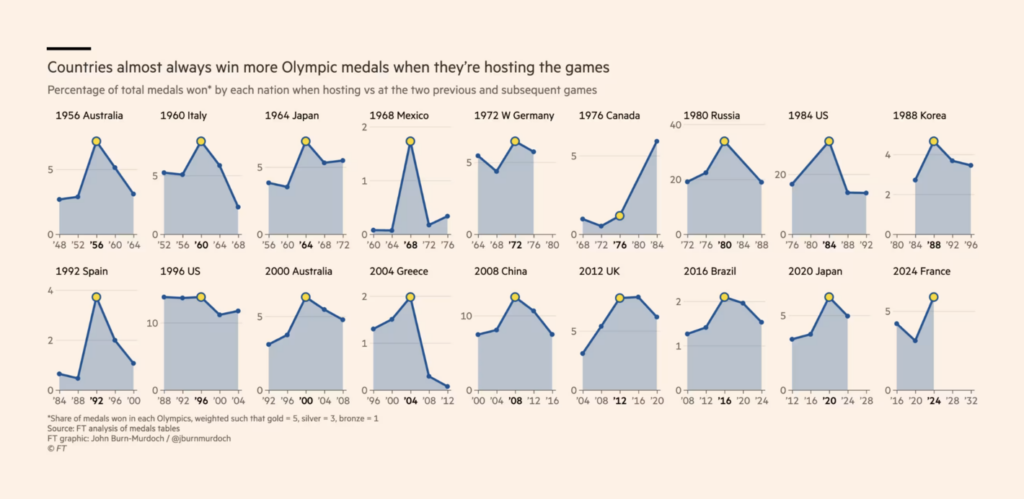
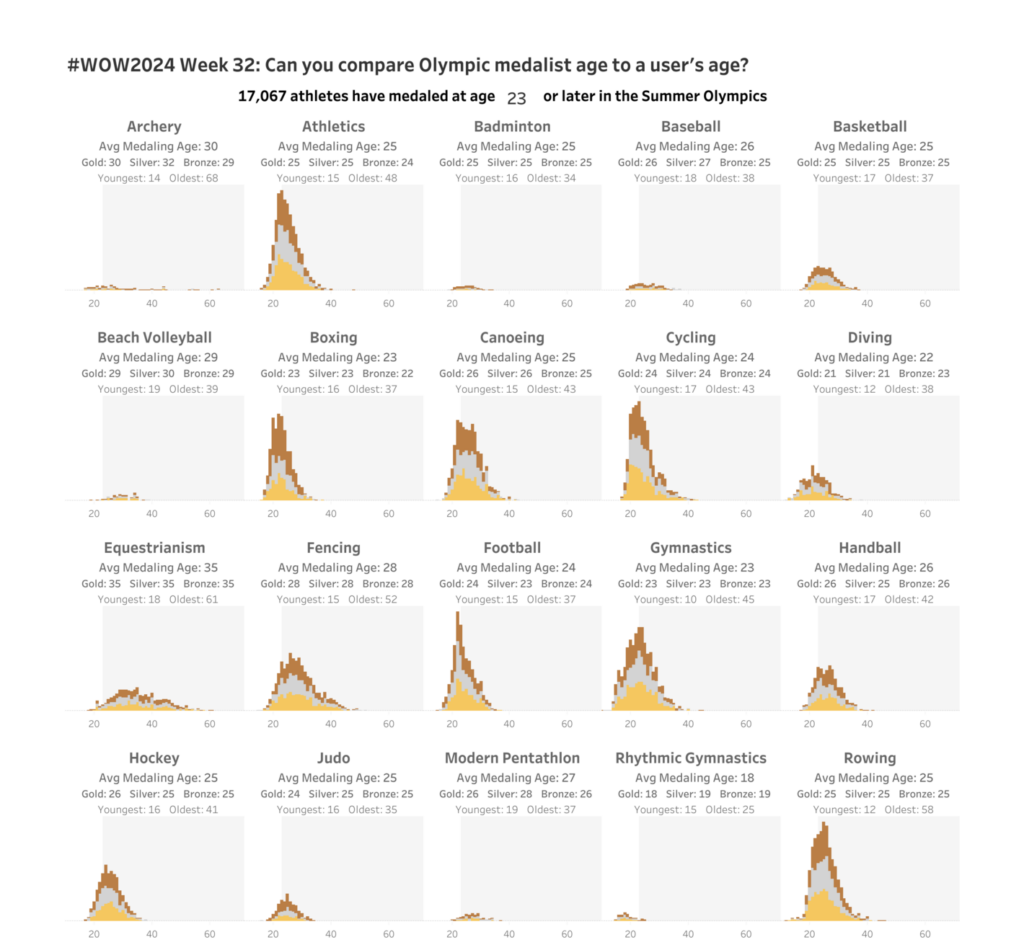
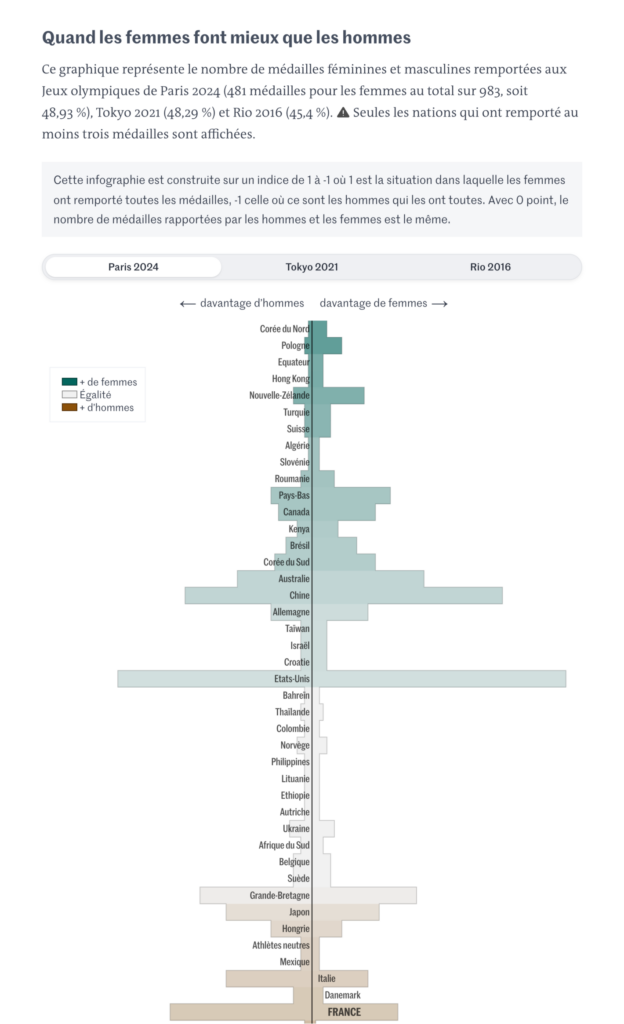
Okay, not quite! We were all in Olympic fever for another week until the games ended Sunday 11th. Here are final medal counts and a look at individual countries:
Let’s start the next section with a quote from a 64-year-old Club France fan, Christine Frant: “Now we have to wake up from this beautiful dream“. Because France has not yet formed an absolute majority in the National Assembly after the elections at the beginning of July:
Le Monde: Construisez votre majorité absolue à l’Assemblée nationale avec notre simulateur de coalition [Build your absolute majority in the National Assembly with our coalition simulator], August 6
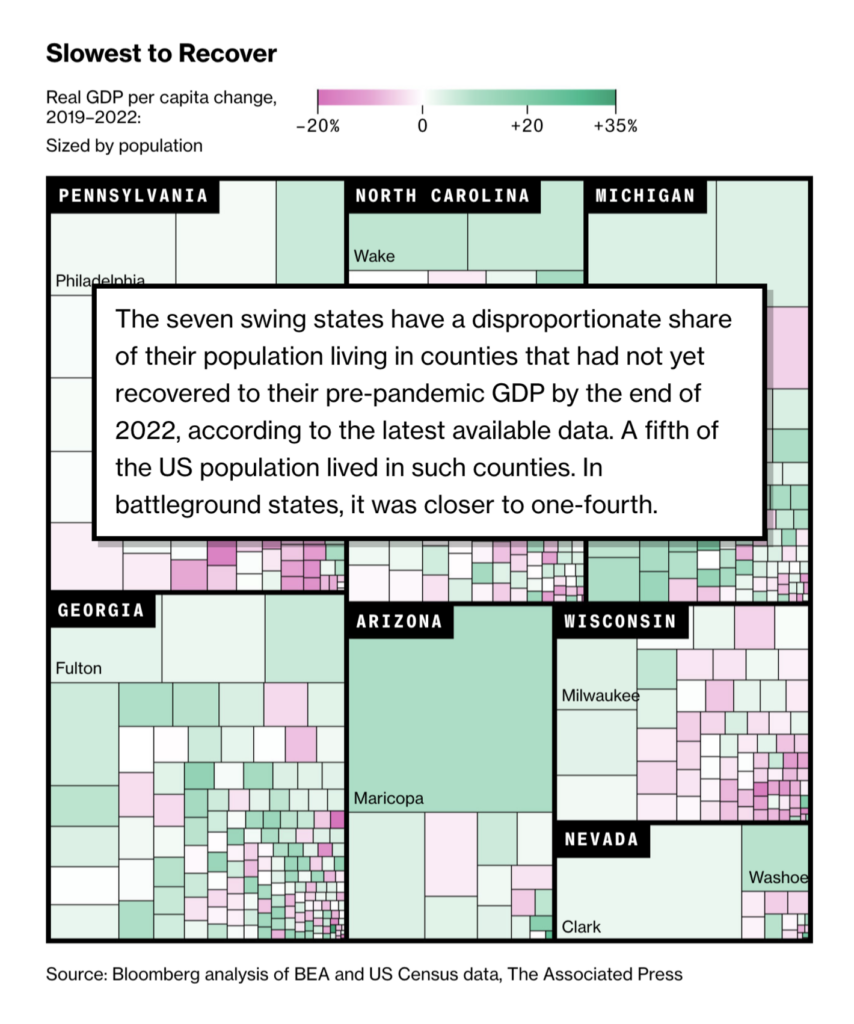
More on the elections: In the U.S., fewer and fewer voters are undecided:
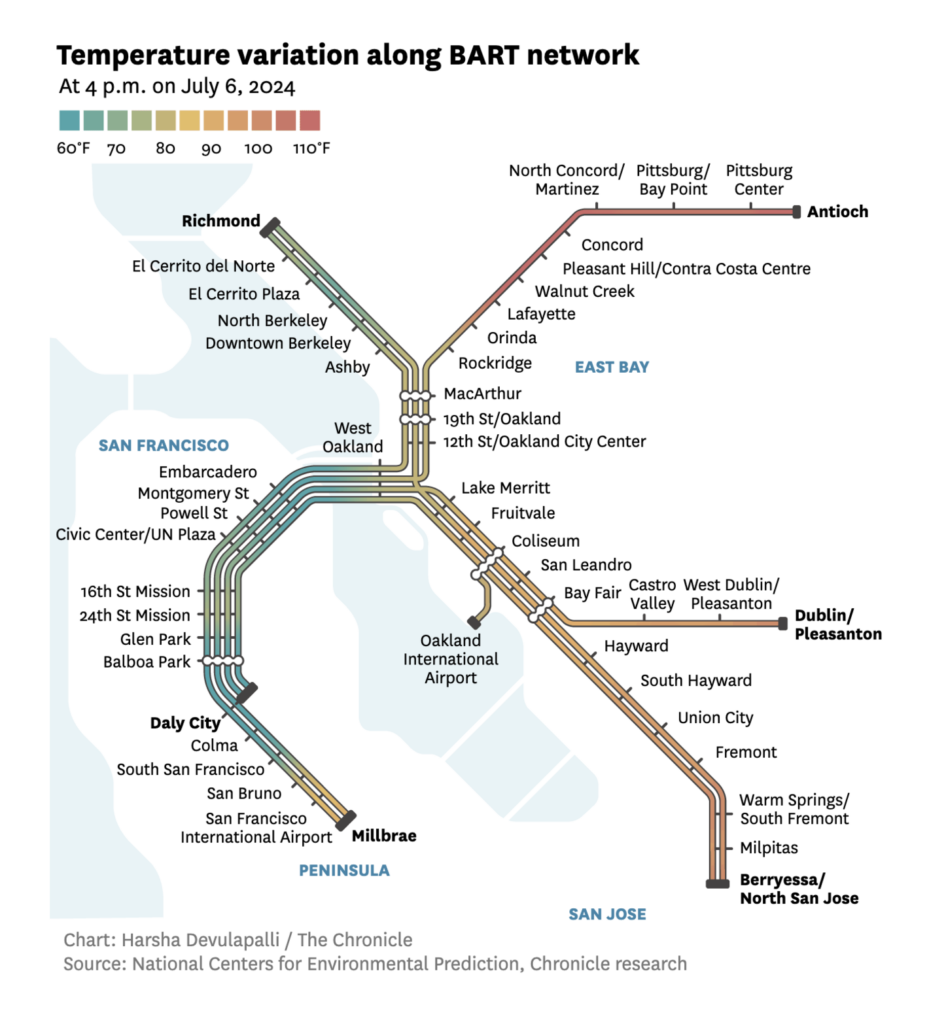
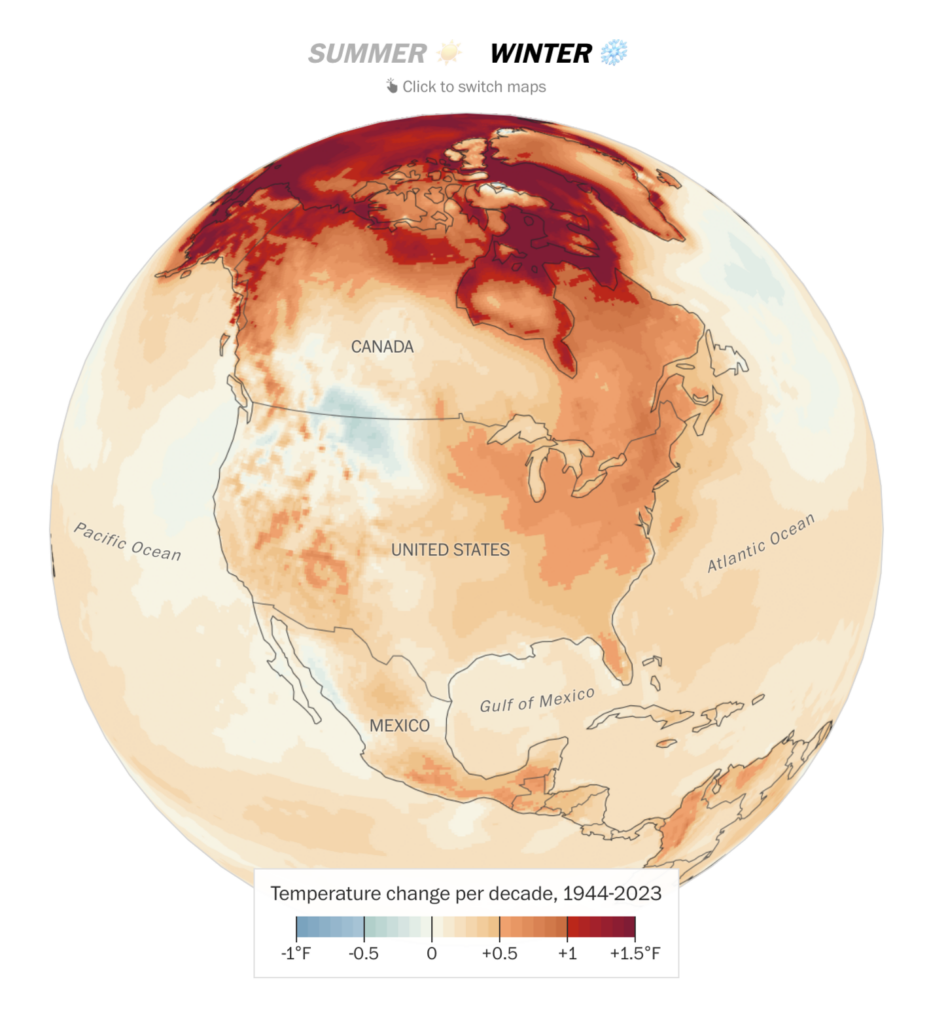
Well, we’re going to stay in the U.S., specifically on the West Coast (close enough). Here you can get on the train in moderate temperatures and get off somewhere else in unbelievably hot temperatures:
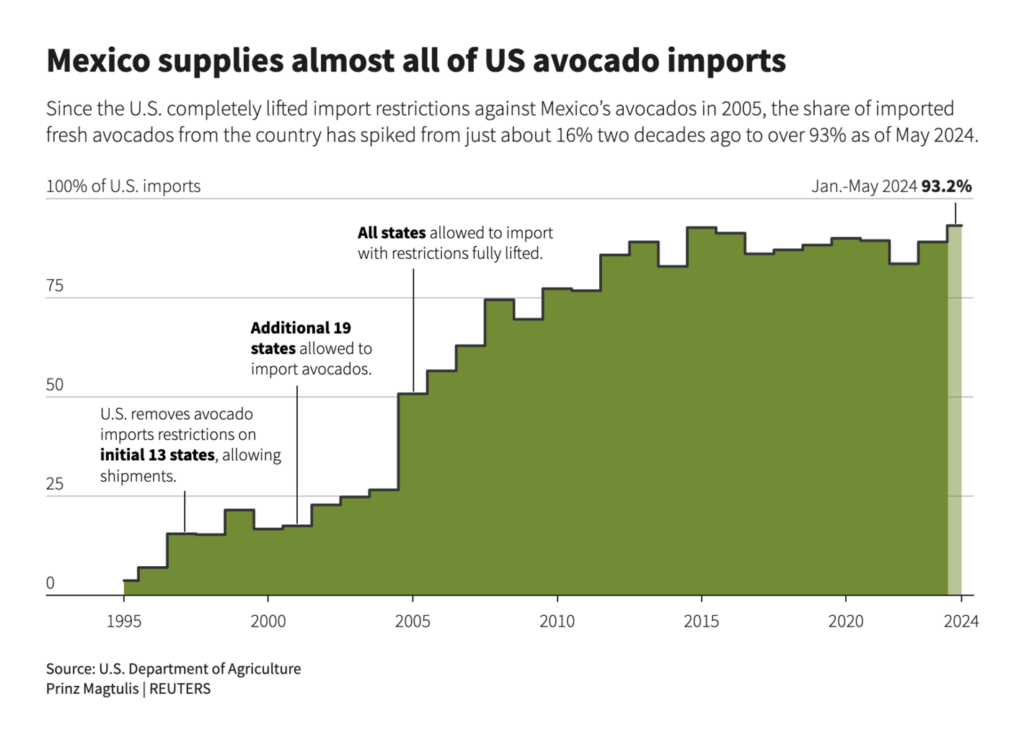
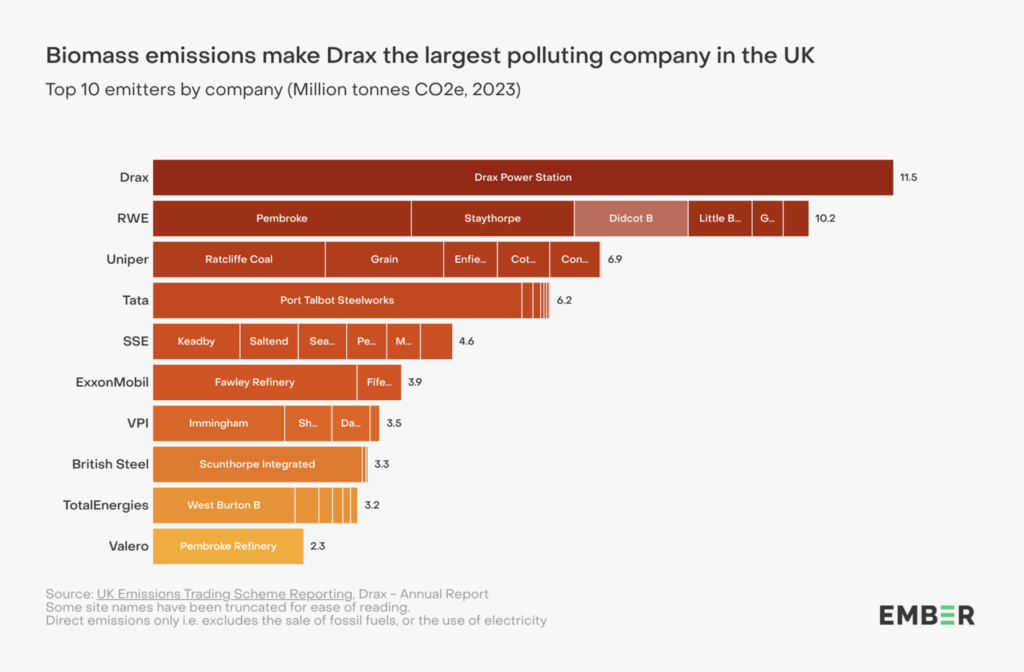
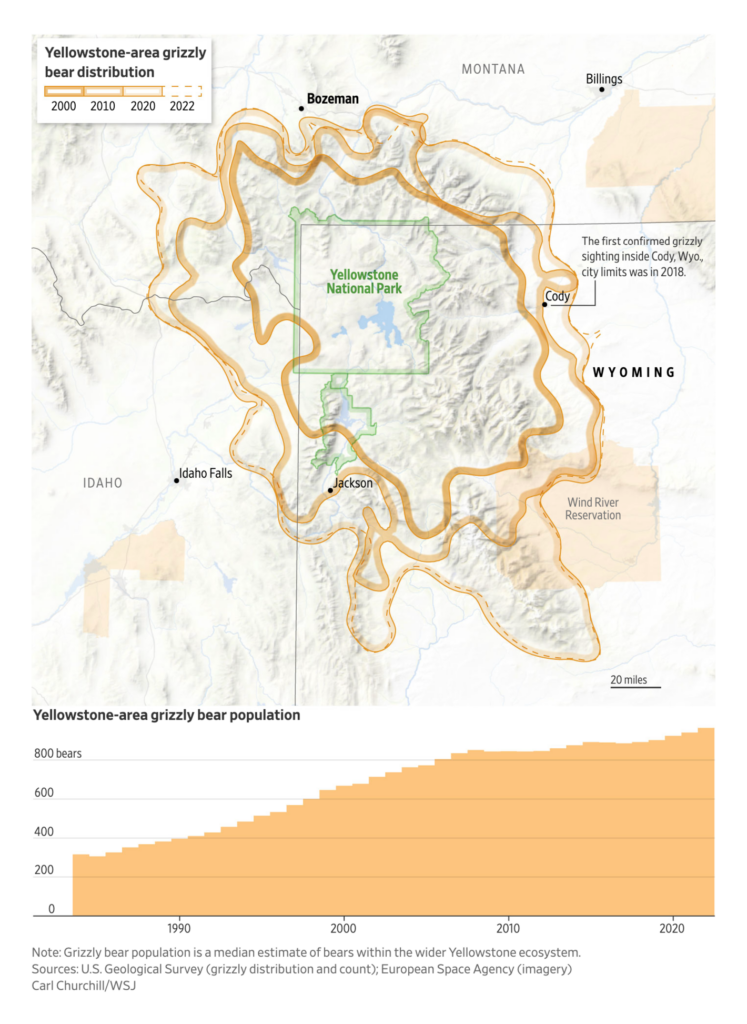
This week’s environmental stories are a rollercoaster of emotions, U.S. avocado imports from Mexico lead to deforestation and overuse of water (😢), European second-hand app Vinted avoided over 600,000 tons of CO2 (😇), Drax is the UK’s biggest CO2 emitter (😢), and the grizzly population is growing (😇):
Reuters: Avocado goldrush links US companies with Mexico’s deforestation disaster, August 6 theeuropeancorrespondent: “Vinted, Europe’s leading reselling platform with over 100 million members, is transforming the fashion industry by promoting sustainable behavior. Through the purchase of secondhand clothing, Vinted members contribute to a significant reduction in CO2e emissions. This shift away from fast fashion helps lower the environmental impact associated with new garment production. By choosing pre-owned fashion, consumers actively participate in the fight against climate change. Created by Mandy Spaltman,” August 8 (Instagram Post) Ember: The largest emitters in the UK: annual review, August 9The Wall Street Journal: America Saved the Grizzlies, and Now the Bears are Invading Towns, August 10
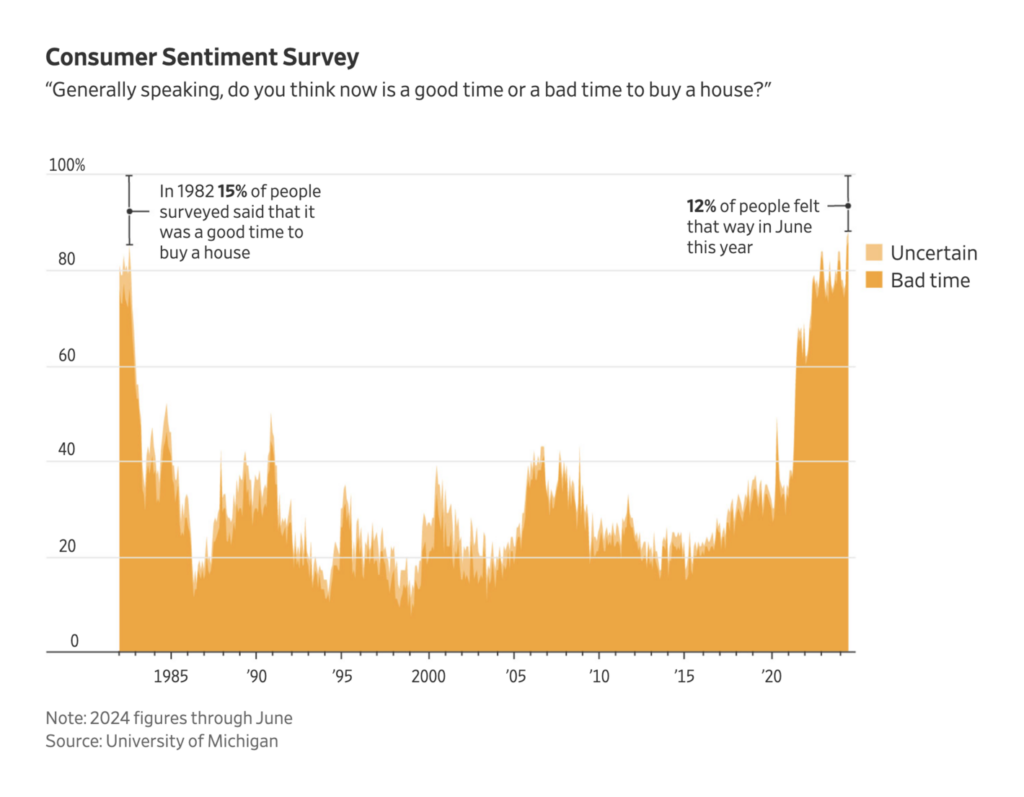
Also on a roller coaster this week: the global financial market. Buying houses, on the other hand, is a downhill ride:
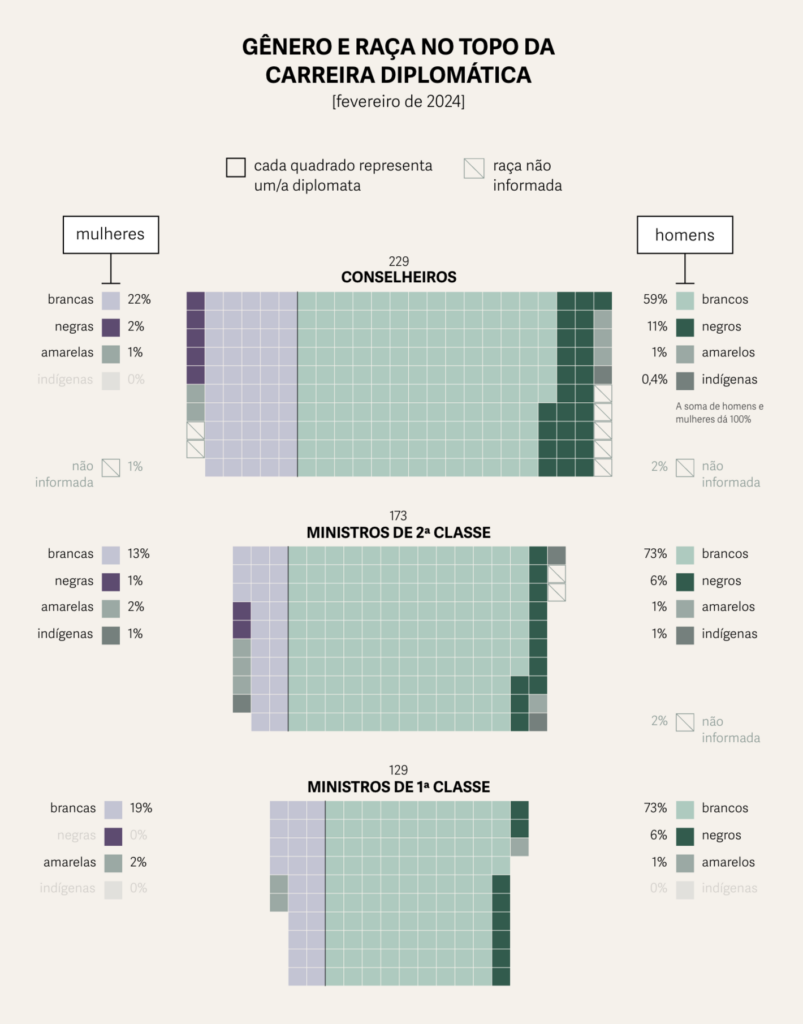
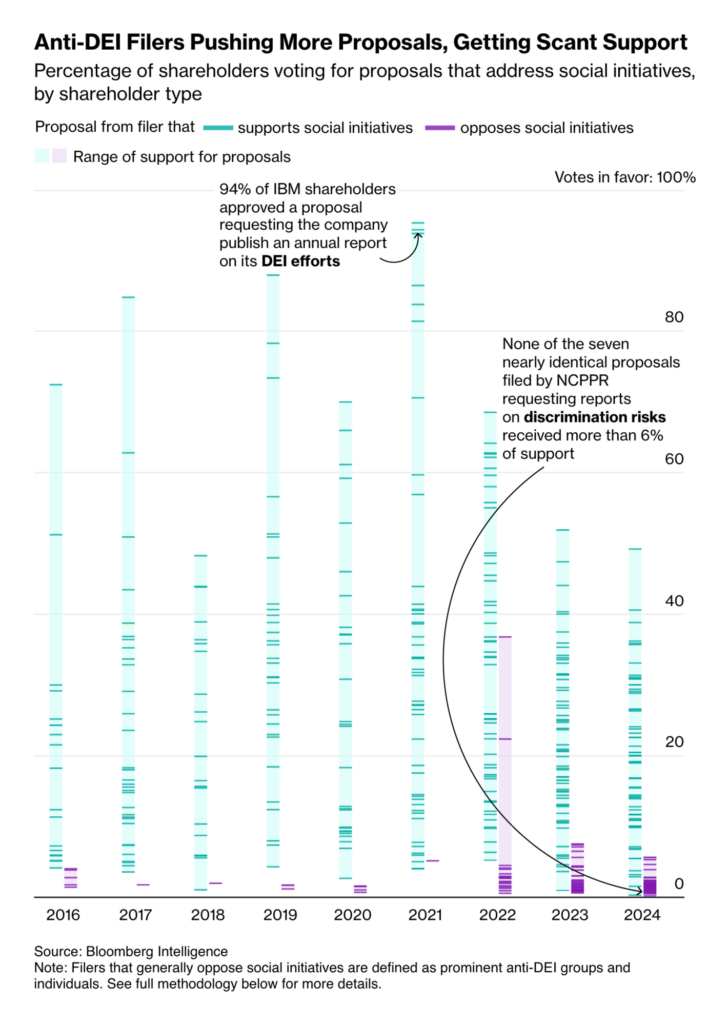
The news on (gender) equality is rather bad. In Brazil, people in diplomatic positions are overwhelmingly white men, and more anti-DEI records are being filed:
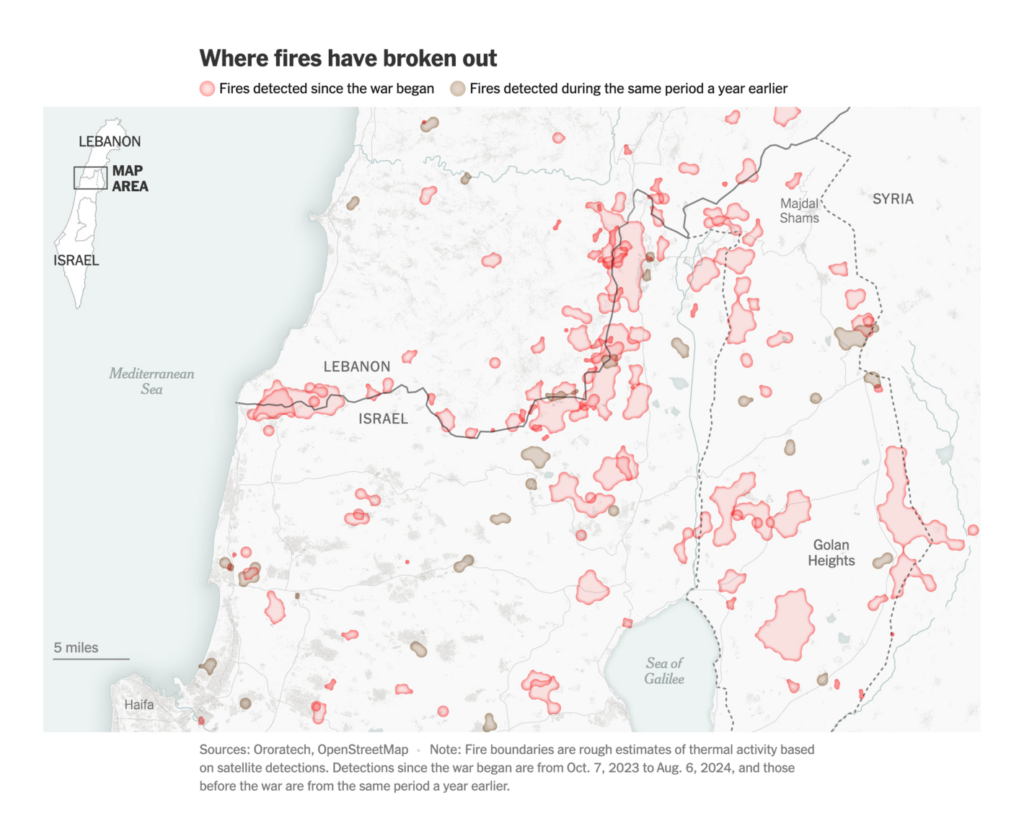
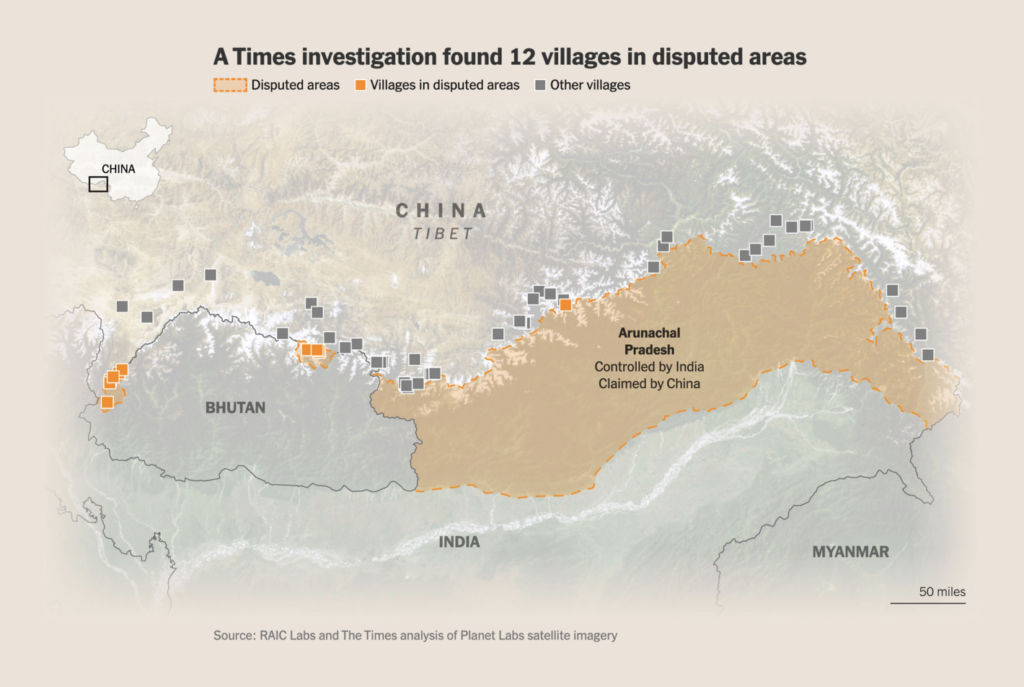
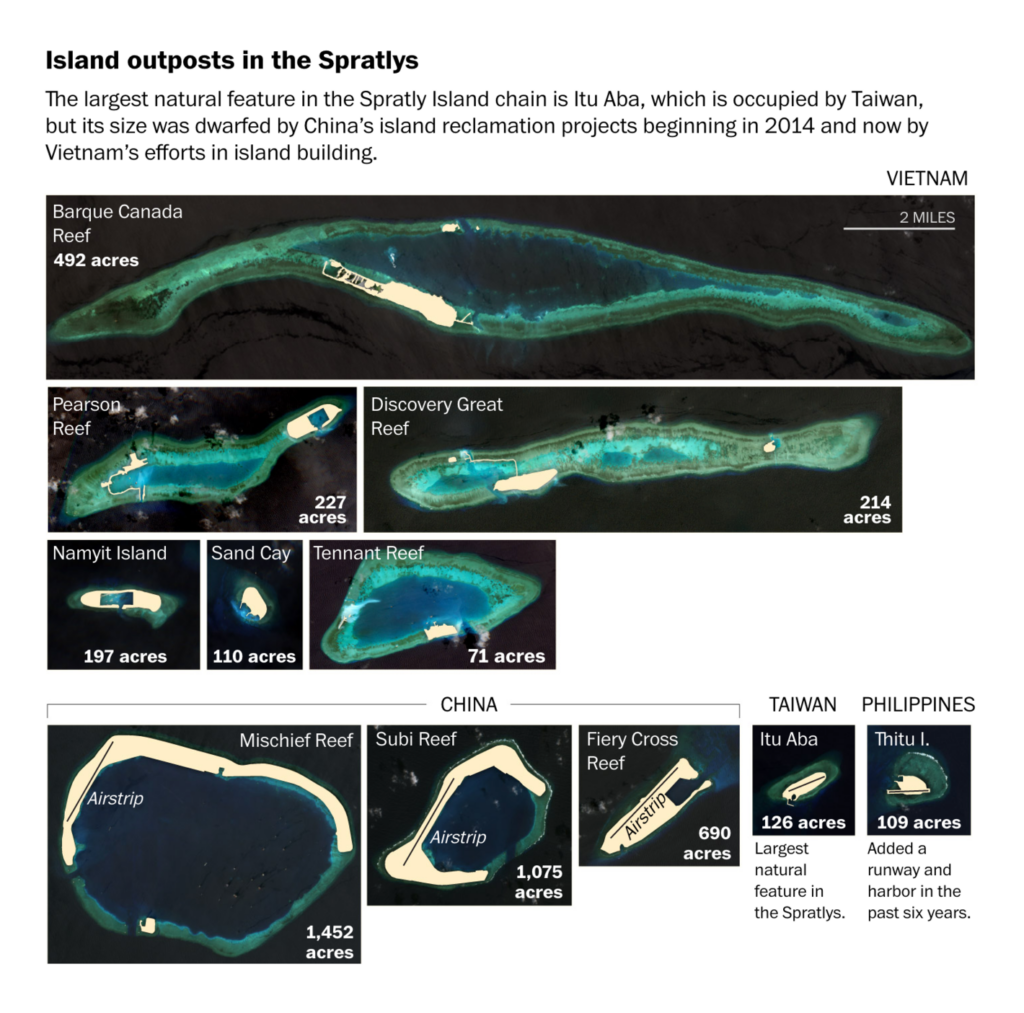
We end with a look at Asia, where China is building cities to protect its borders and Vietnam is building islands to challenge China. Oh, and yes, Singapore is happy to be a year older:
Visual Agency: “How can we align data with our experience of it? A poetic approach could help: sometimes “feeling” a phenomenon is as vital as “seeing” the data behind it. Prof Ciuccarelli explores this subject #InfoPoetry #DataDesign,” August 8 (Tweet, Infopeotry Archive)
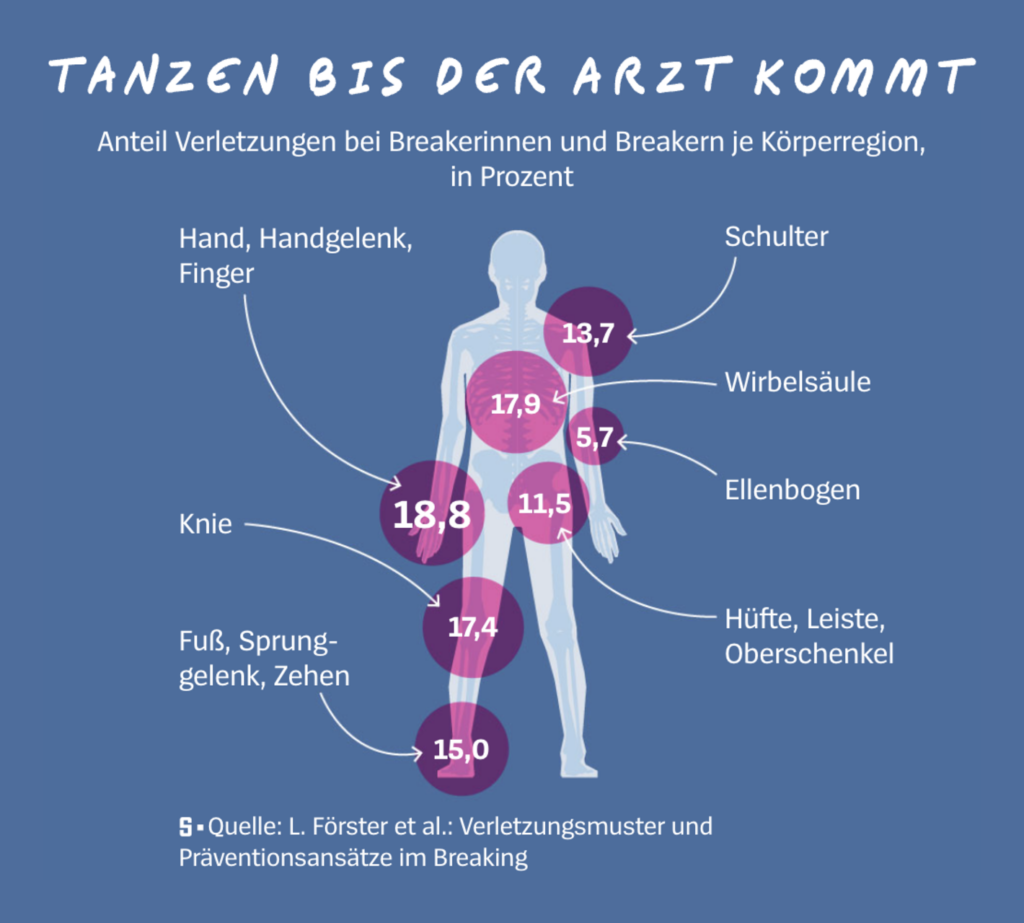
下田スケッチ: “コップの色の観察 [Observing the color of a cup], ” August 9 (Tweet)El Confidencial: BREAKing, August 9
Applications are open for…
A Front-end developer to join the Infographic team at South China Morning Post
Help us make this dispatch better! We’d love to hear which newsletters, blogs, or social media accounts we need to follow to learn about interesting projects, especially from less-covered parts of the world (Asia, South America, Africa). Write us at hello@datawrapper.de or leave a comment below.
(she/her) is a working student on Datawrapper’s Communications team. She creates the Data Vis Dispatch to keep data visualization enthusiasts up to date on exciting new projects. When she’s not working, she studies interface design, and when she’s not studying, she’s planning a festival stage or soldering light installations. Vivien lives in Potsdam.


Comments