This article is brought to you by Datawrapper, a data visualization tool for creating charts, maps, and tables. Learn more.
Data Vis Dispatch, August 3
The best of last week’s big and small data visualizations


Welcome back to the seventh edition of Data Vis Dispatch! Every week, we’ll be publishing a collection of the best small and large data visualizations we find, especially from news organizations — to celebrate data journalism, data visualization, simple charts, elaborate maps, and their creators.
Recurring topics for this week include vaccine hesitancy, cities and infrastructure, and the Olympics.
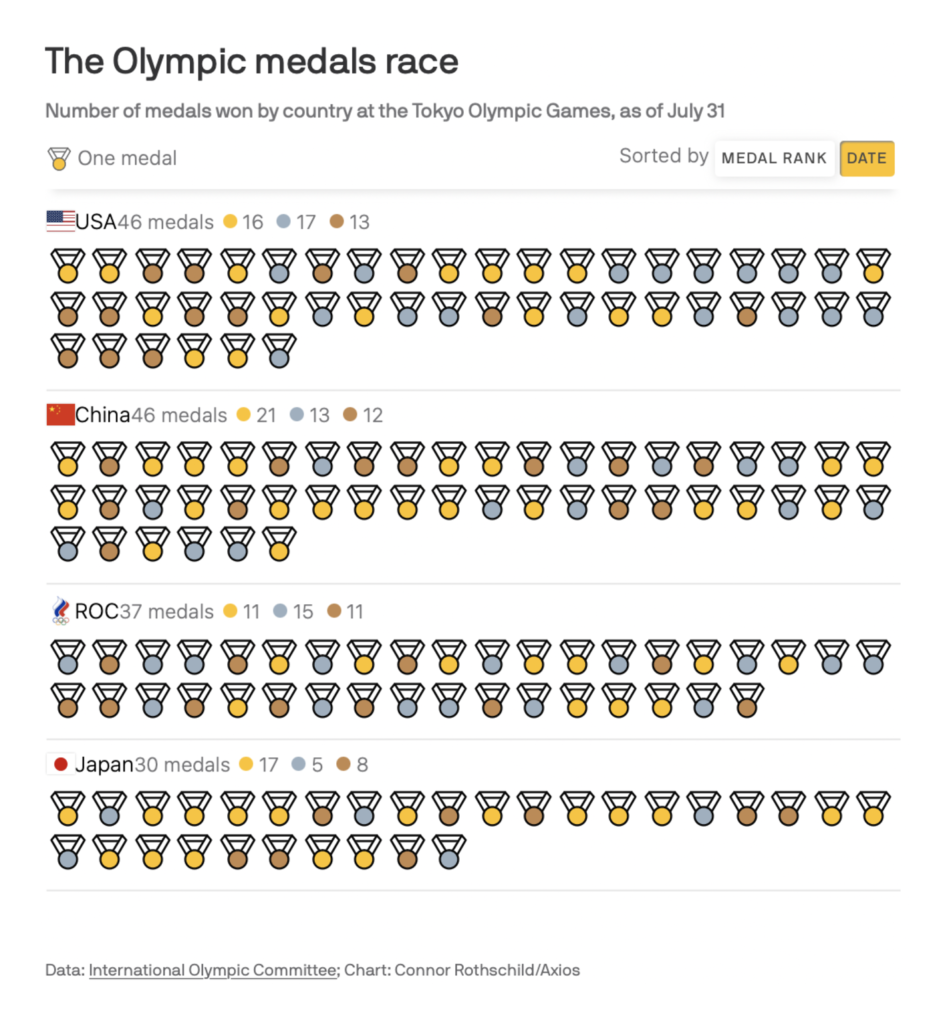
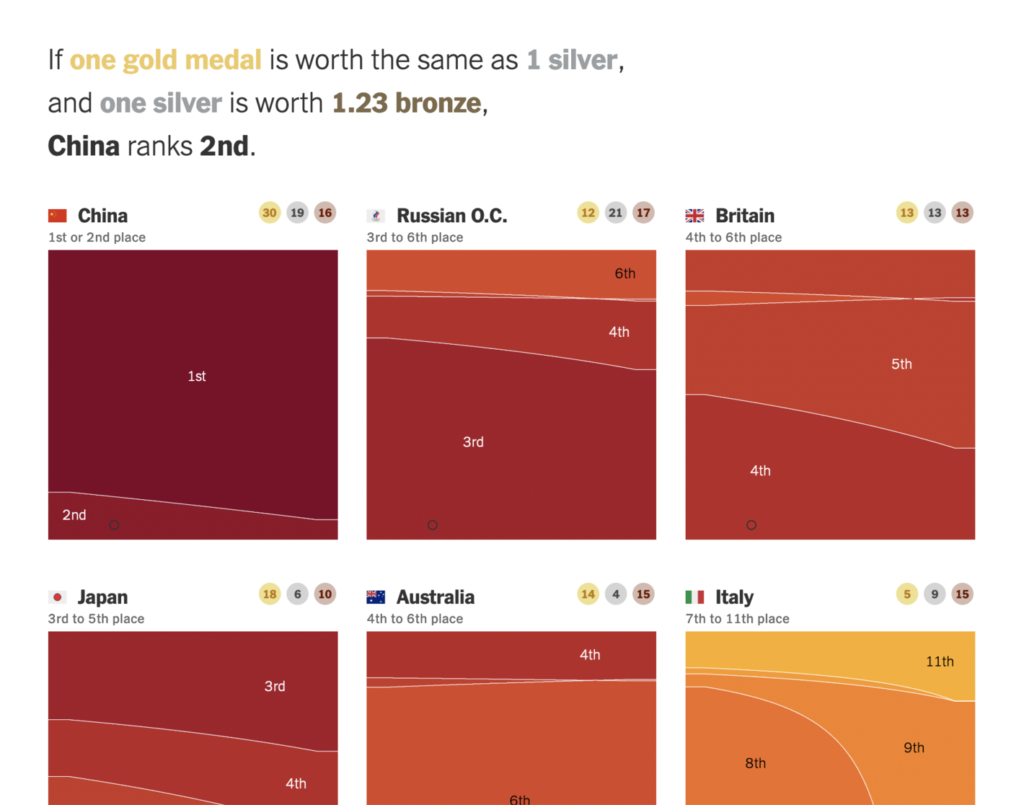
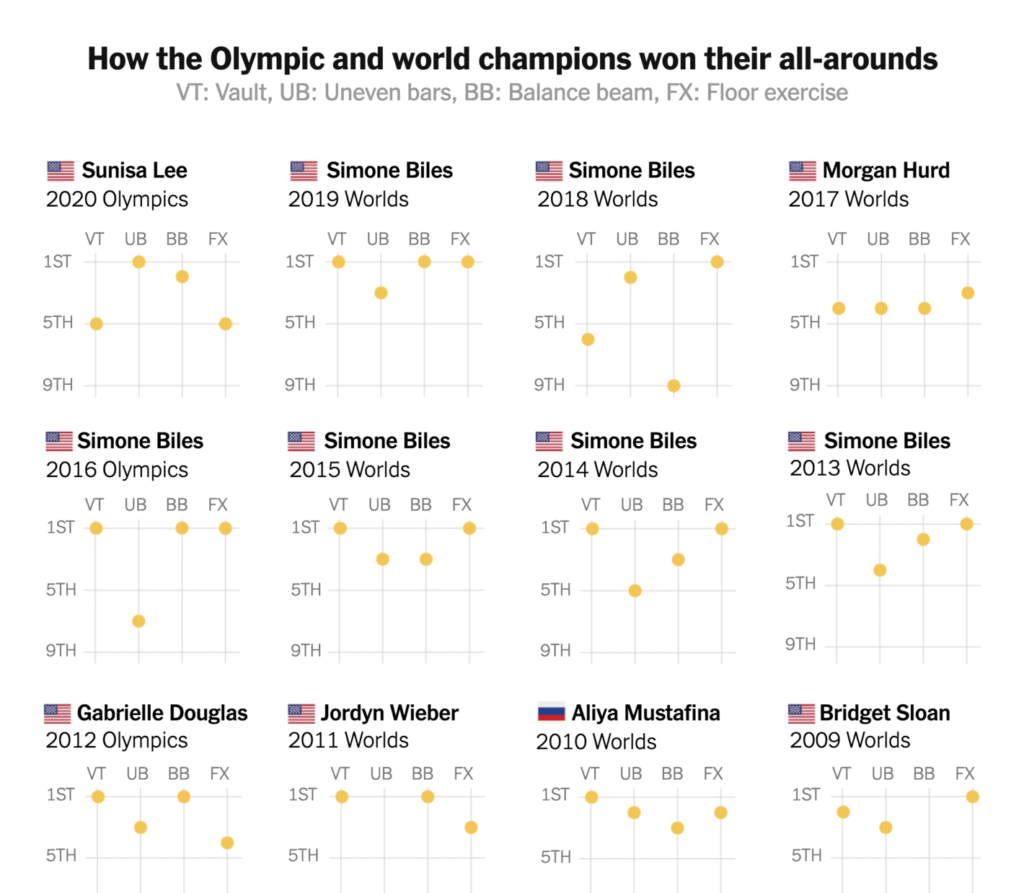
The Olympics are still in full swing! Although the competition is fierce, there’s no one right way to count who’s in the lead — especially if you’re willing to get creative:
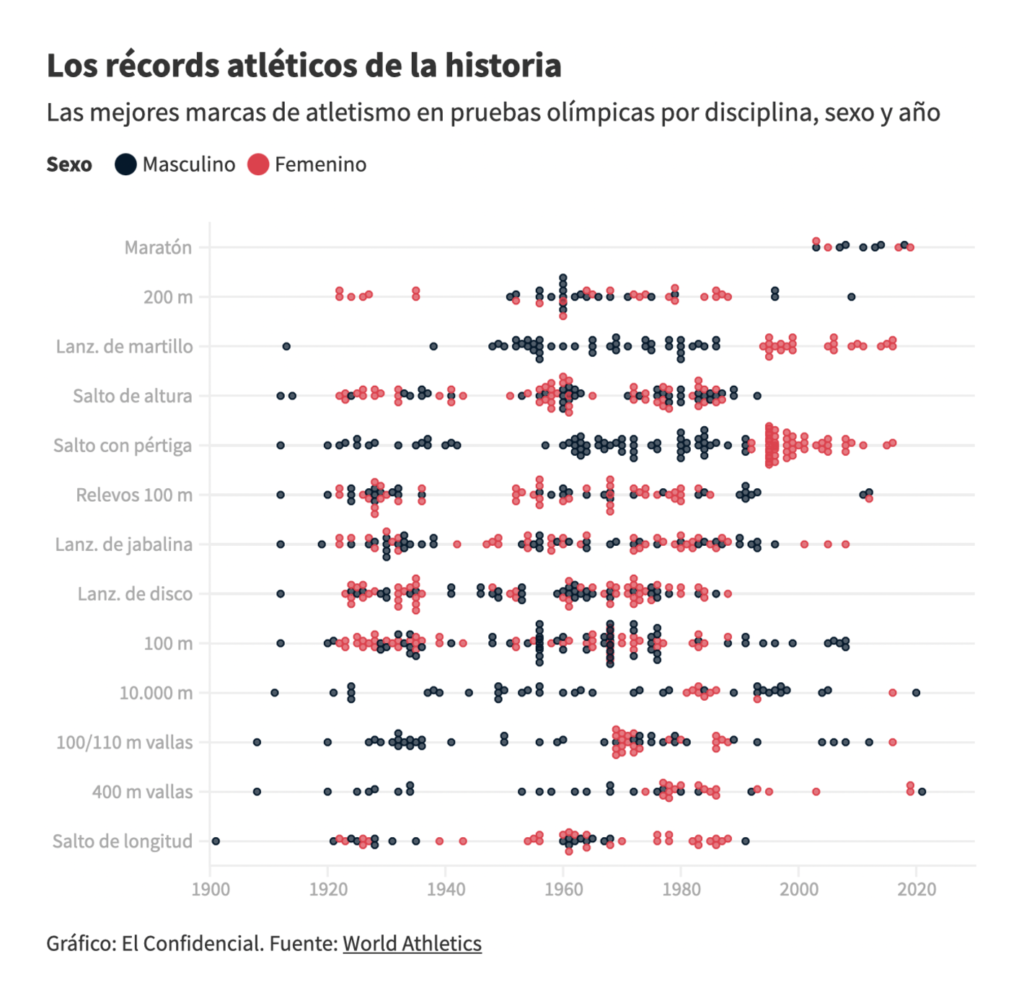
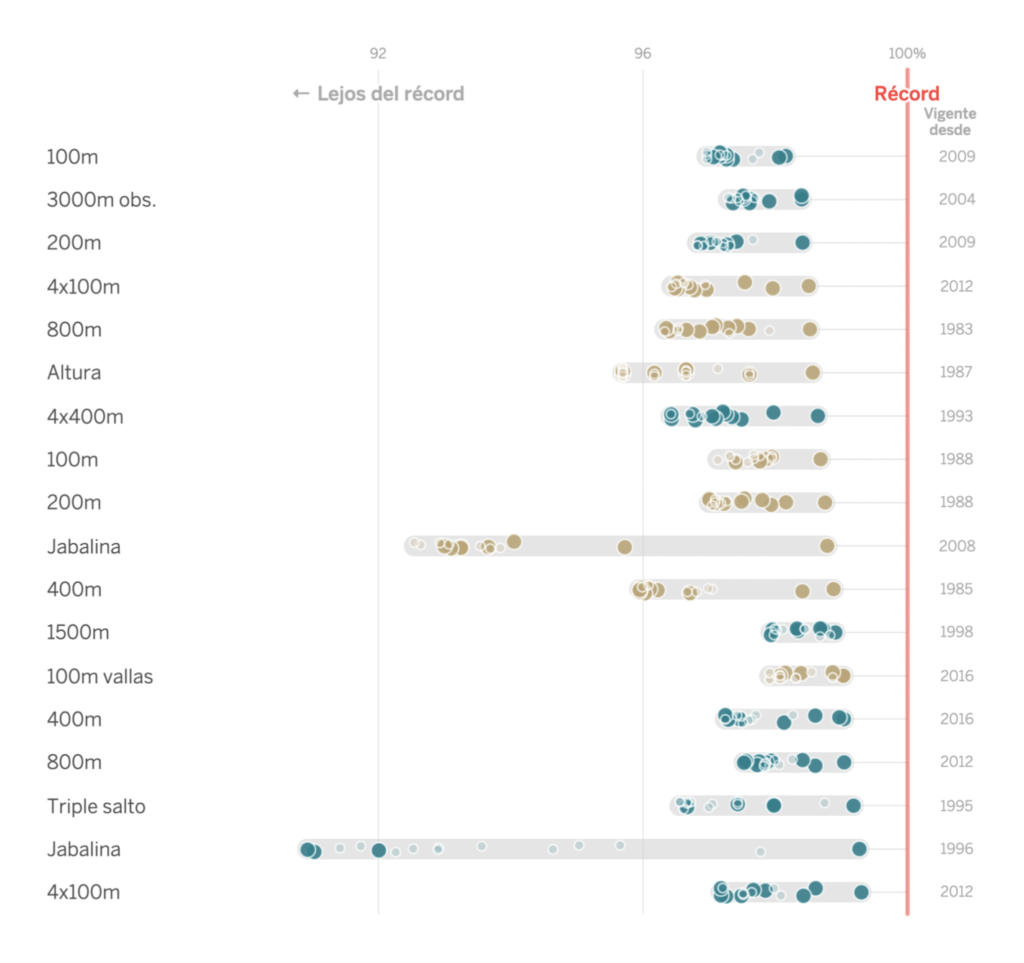
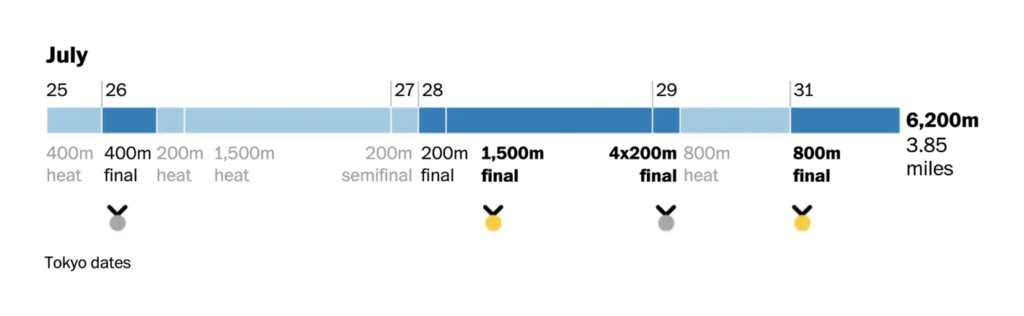
More Olympic records are sure to be broken (though a few are likely to stand the test of time):
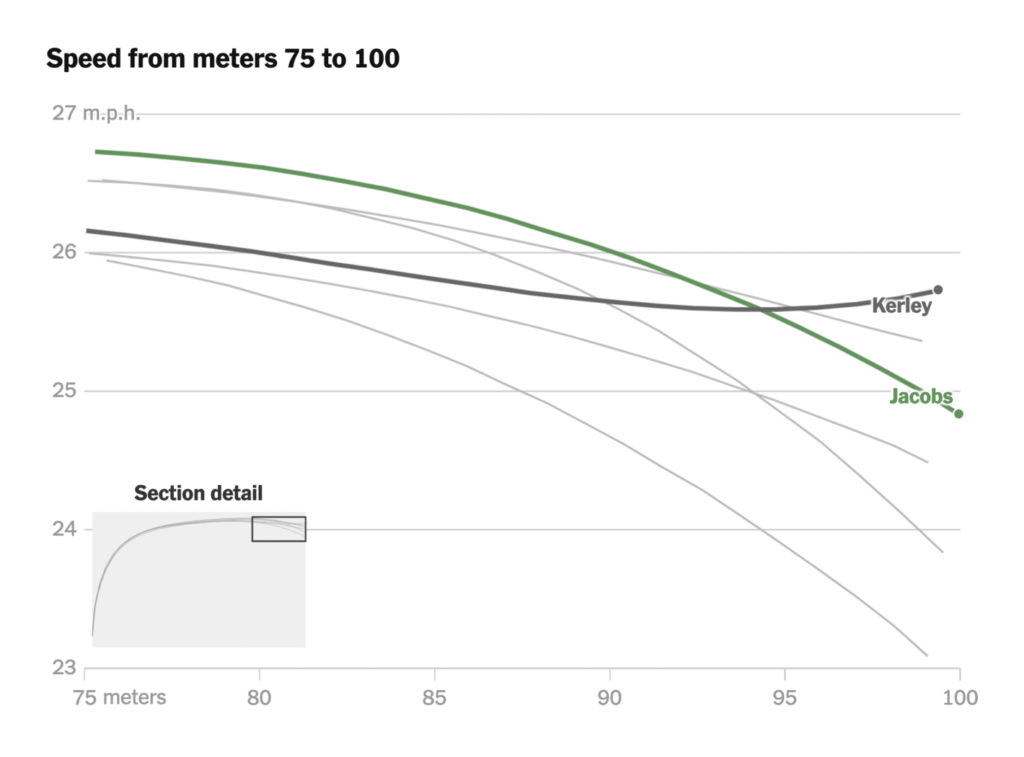
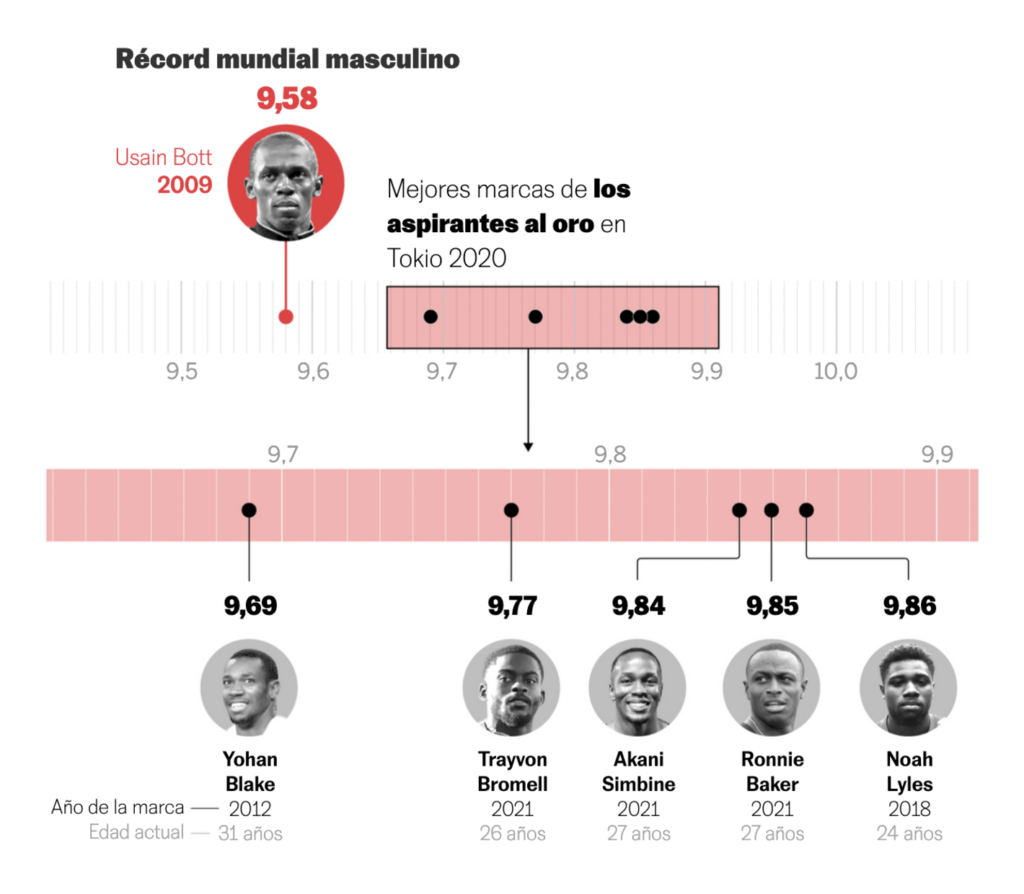
These charts helped us slow down the 100-meter dash:
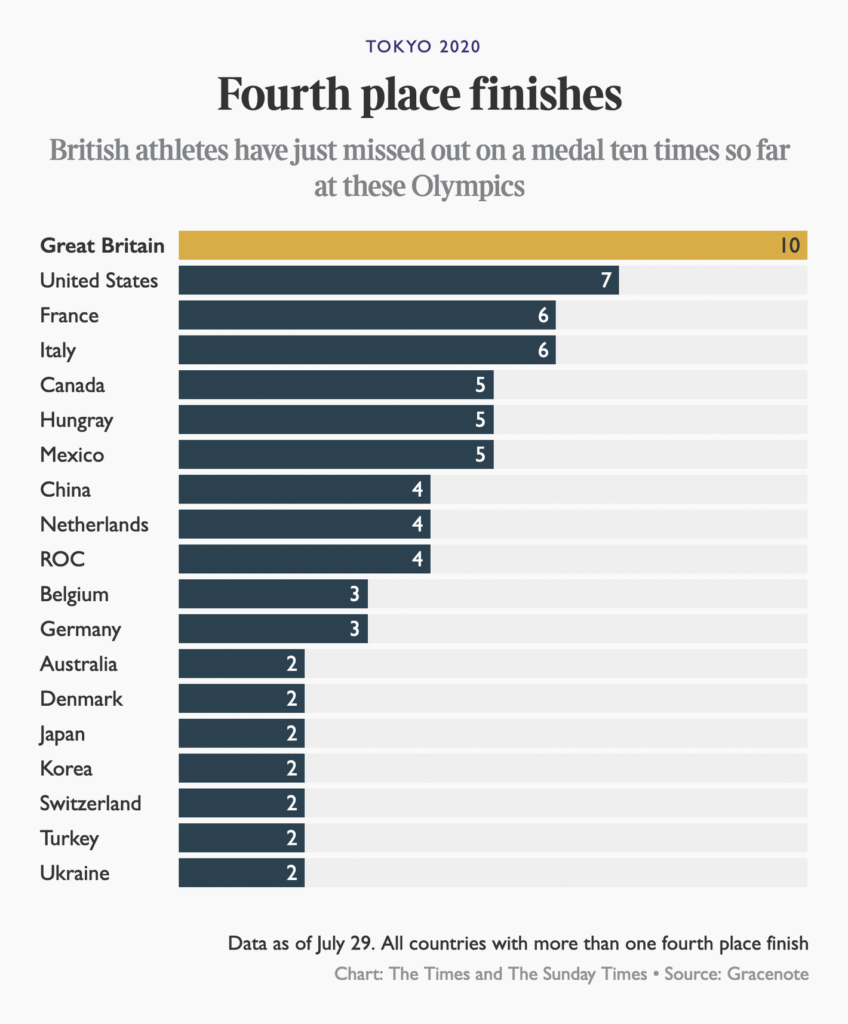
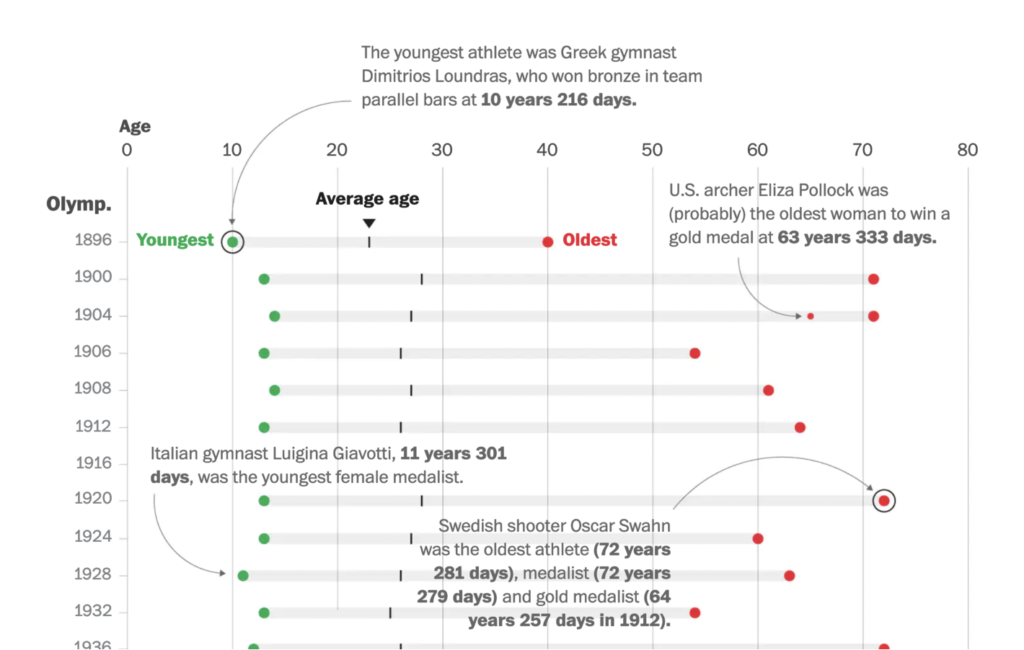
And these charted personal triumphs and national hopes:
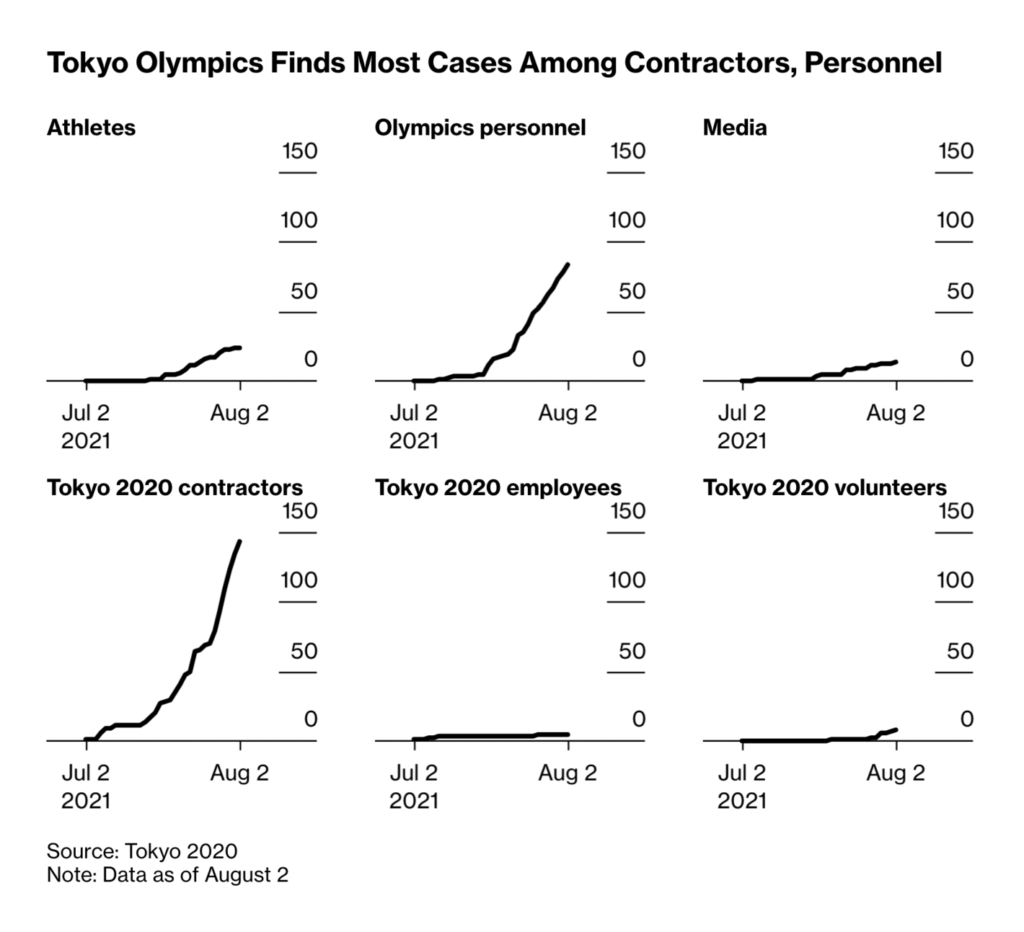
Although athletes have mostly been spared, COVID is still spreading at the Games and around the world:
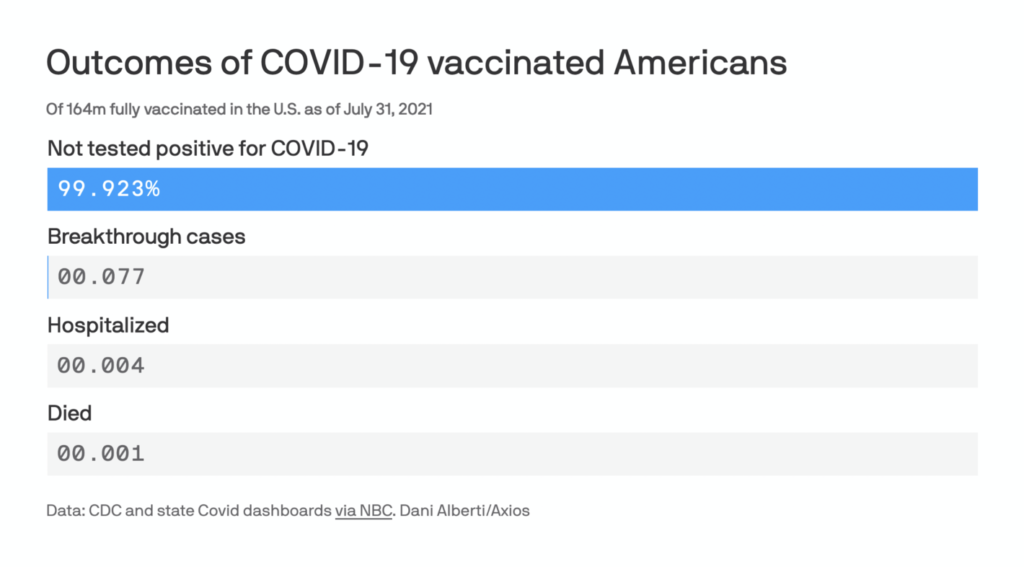
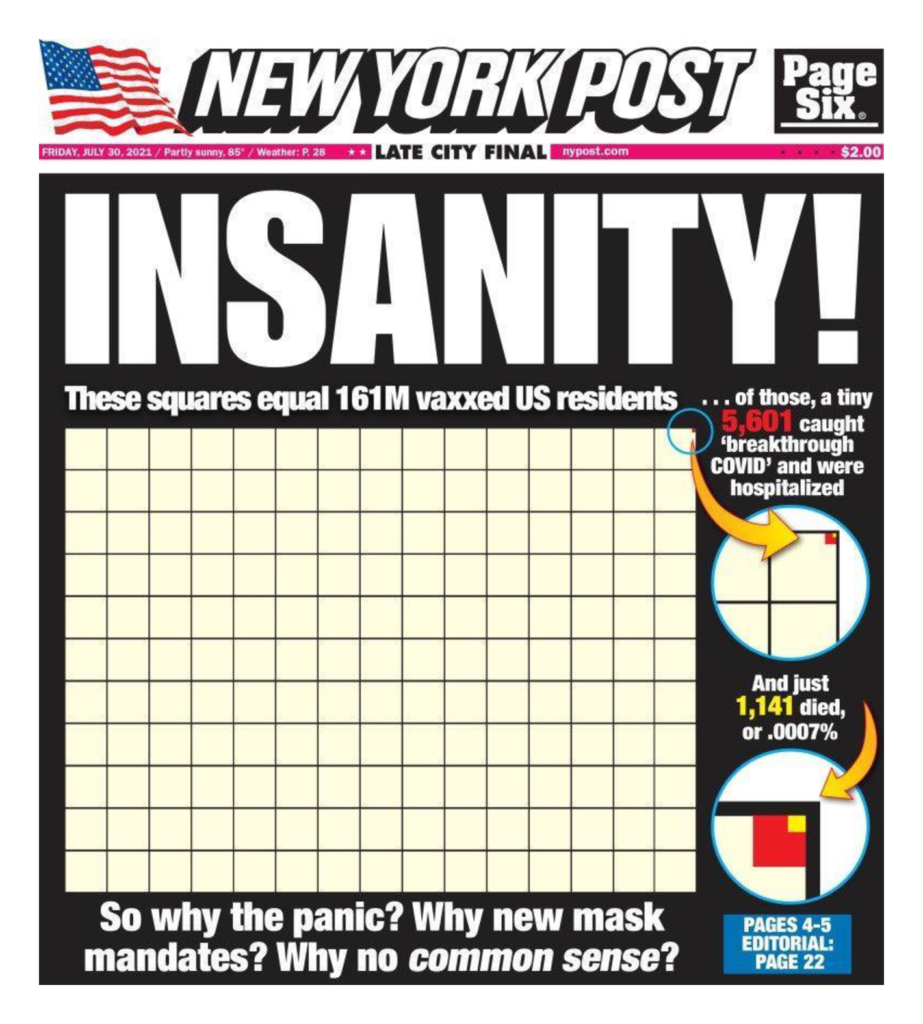
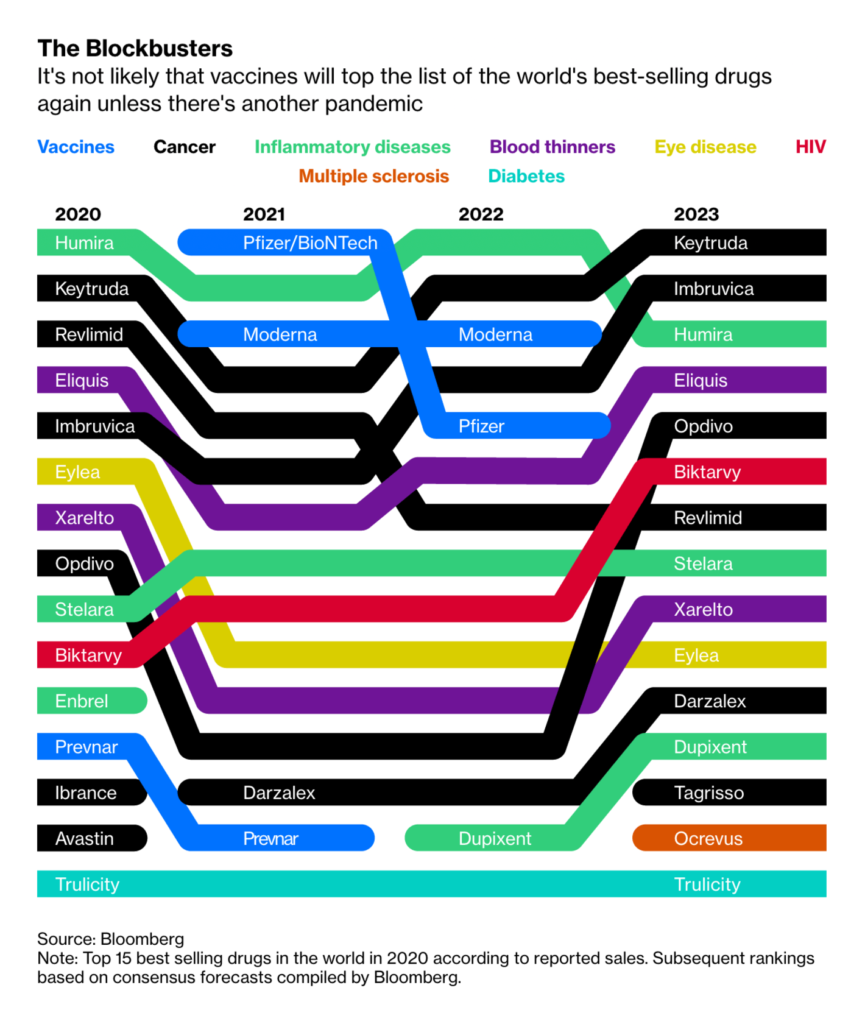
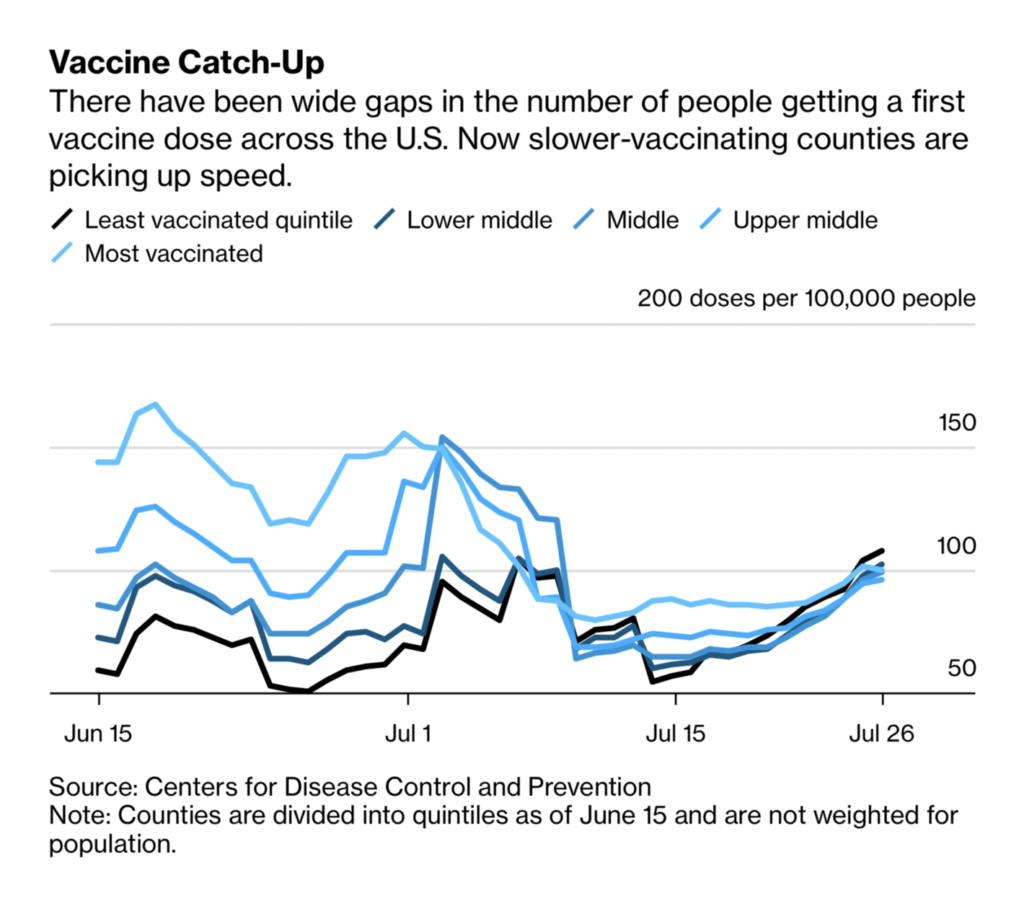
Vaccinations are highly effective (and everyone is covering it):
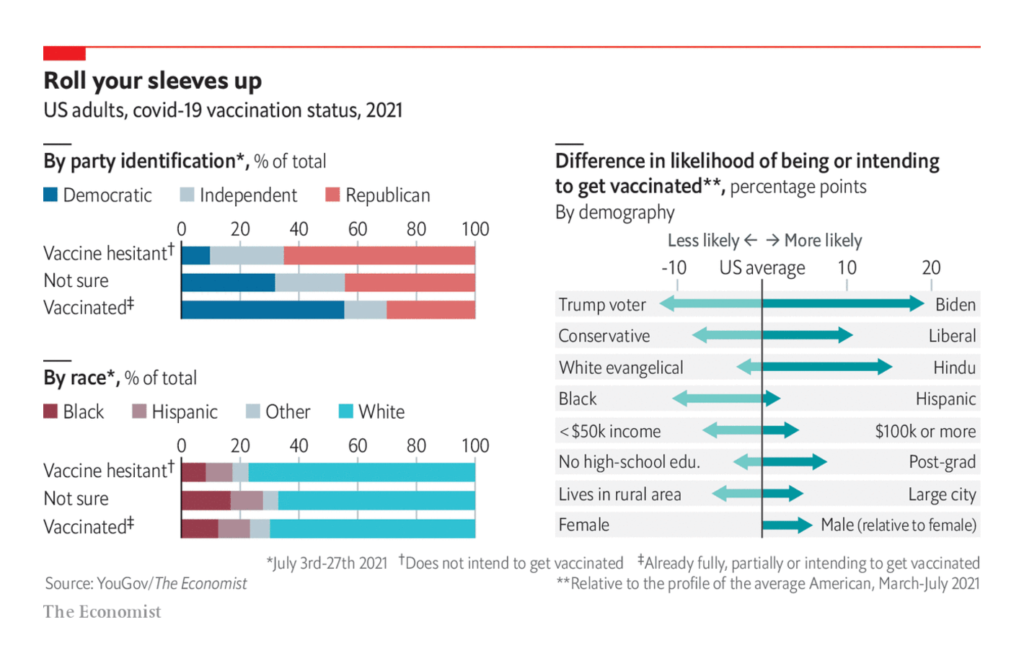
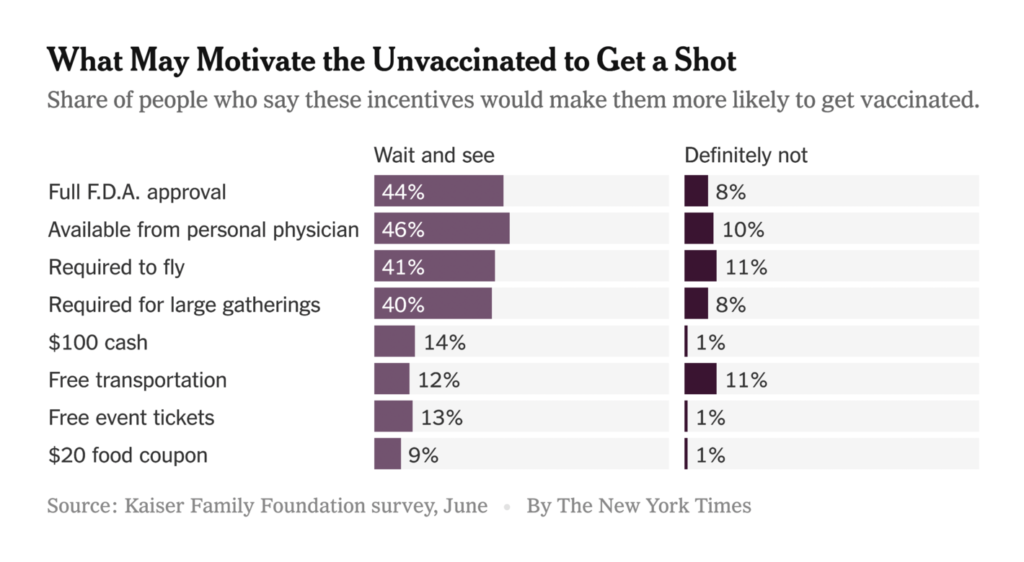
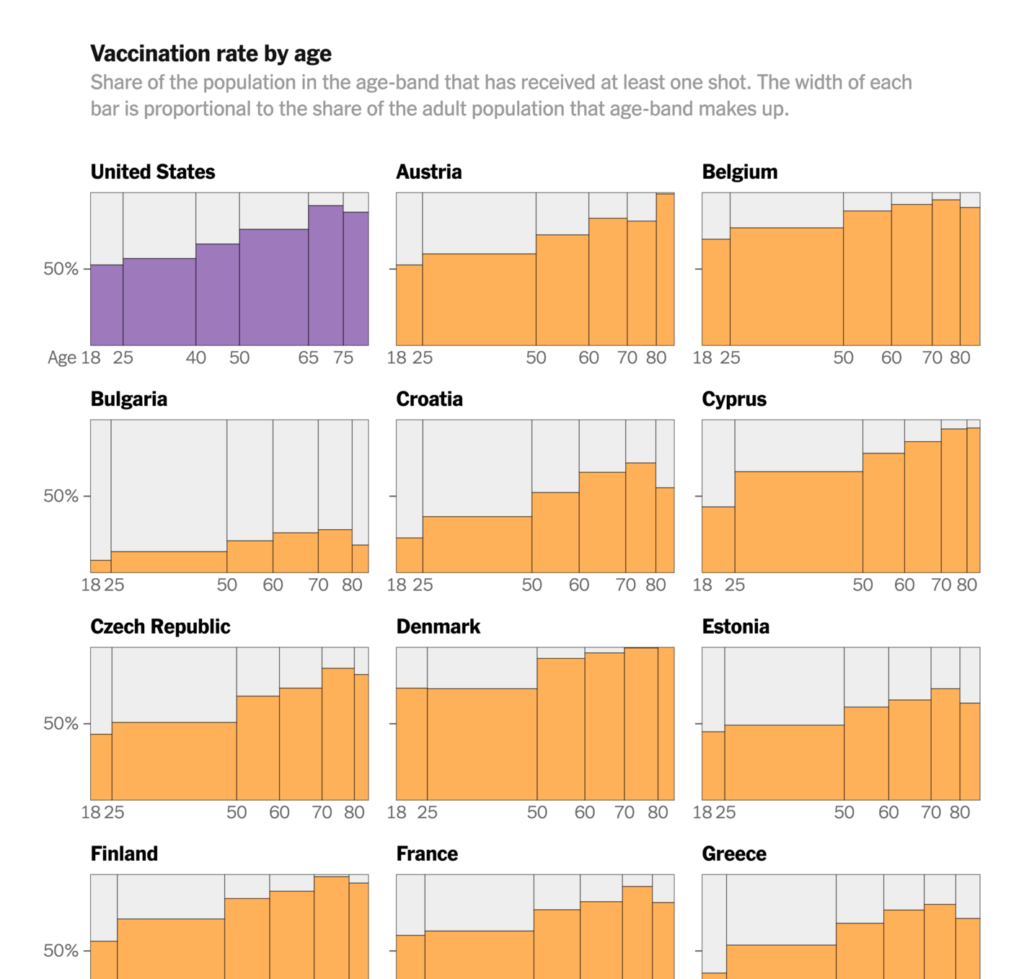
…but the shots only work if people are willing to get them:
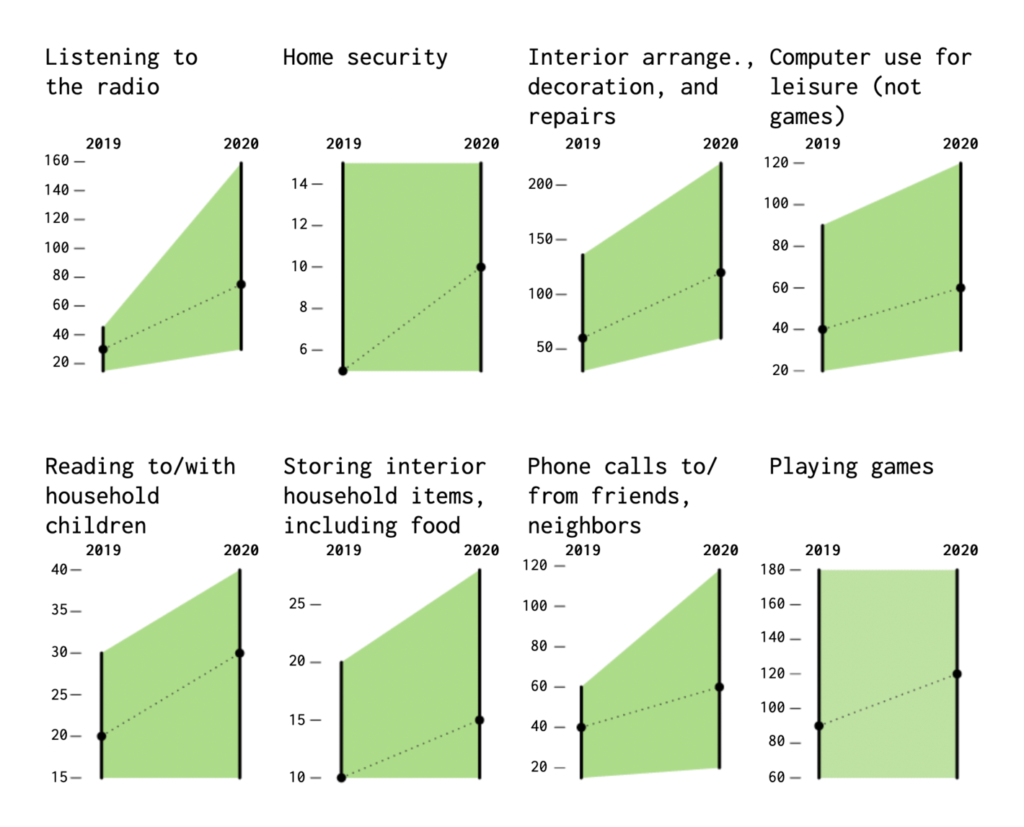
The pandemic changed how we spent our time:
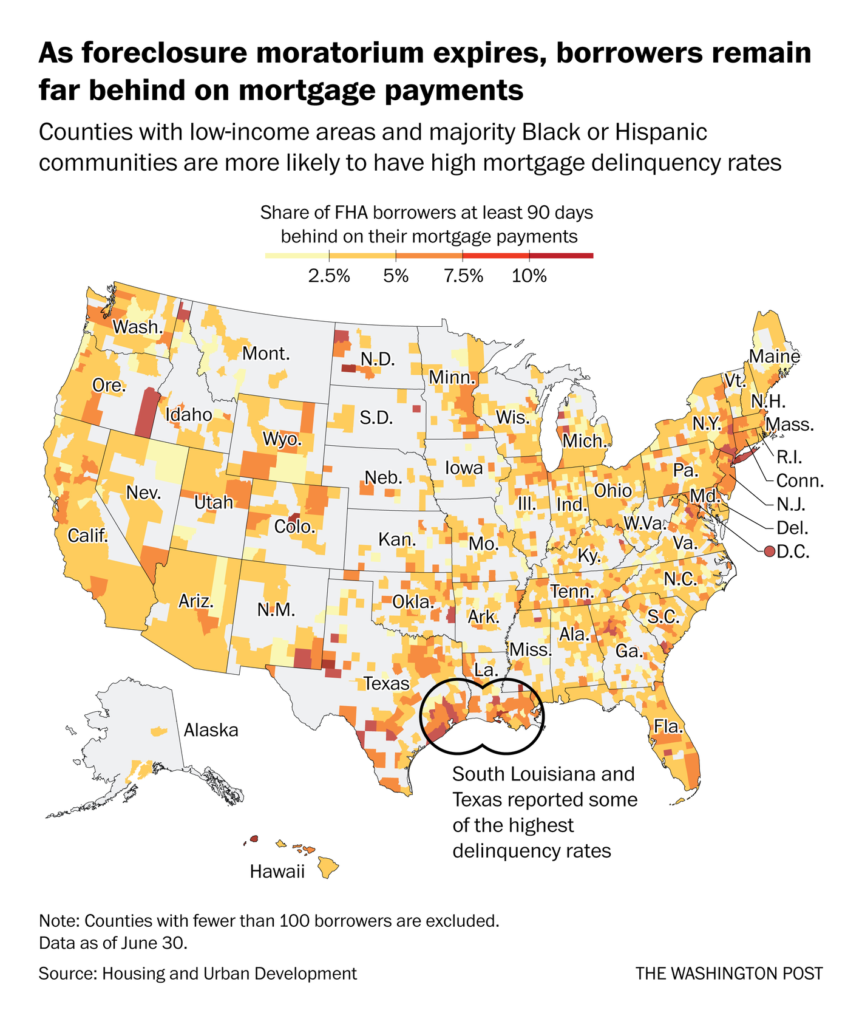
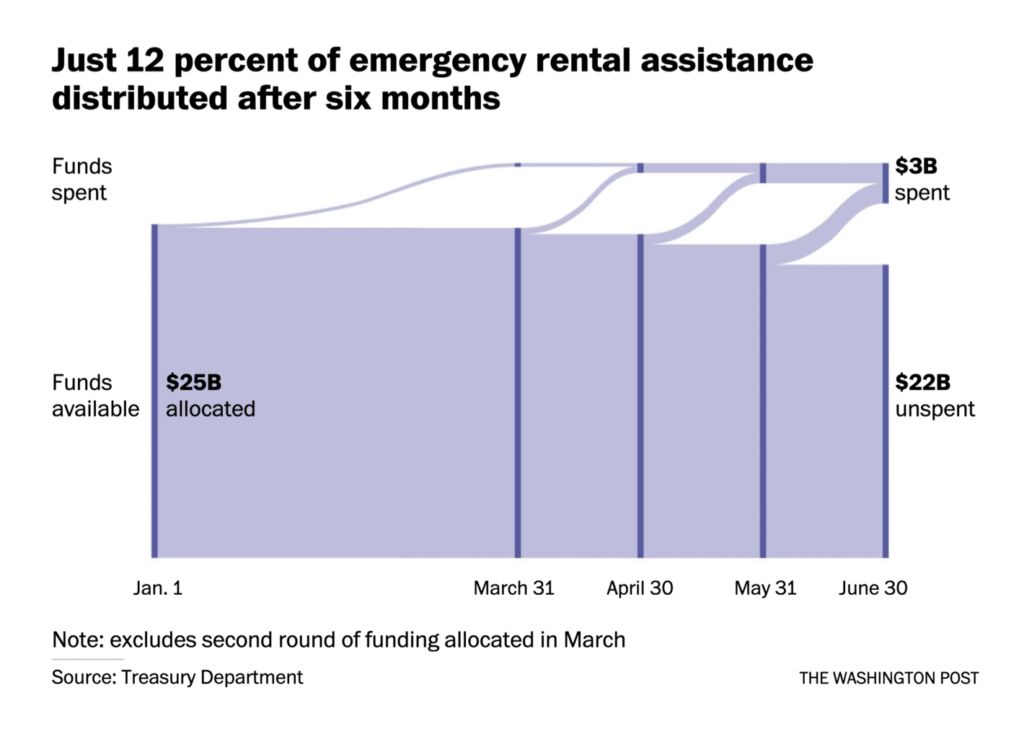
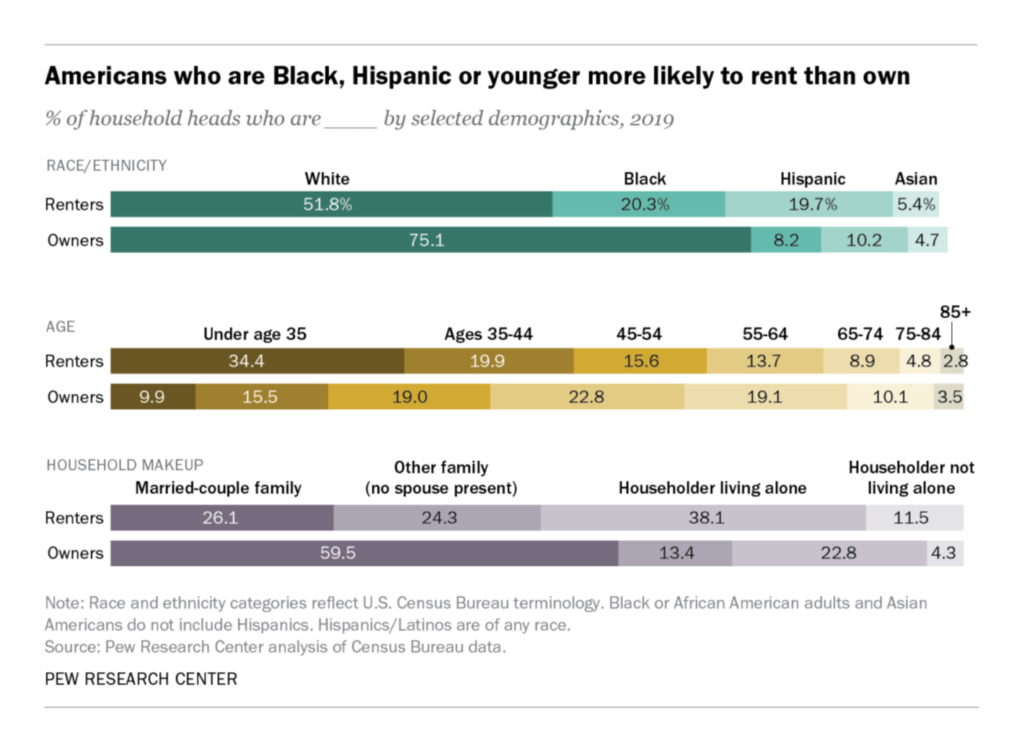
Though as relief measures end, there will be more shocks to come:
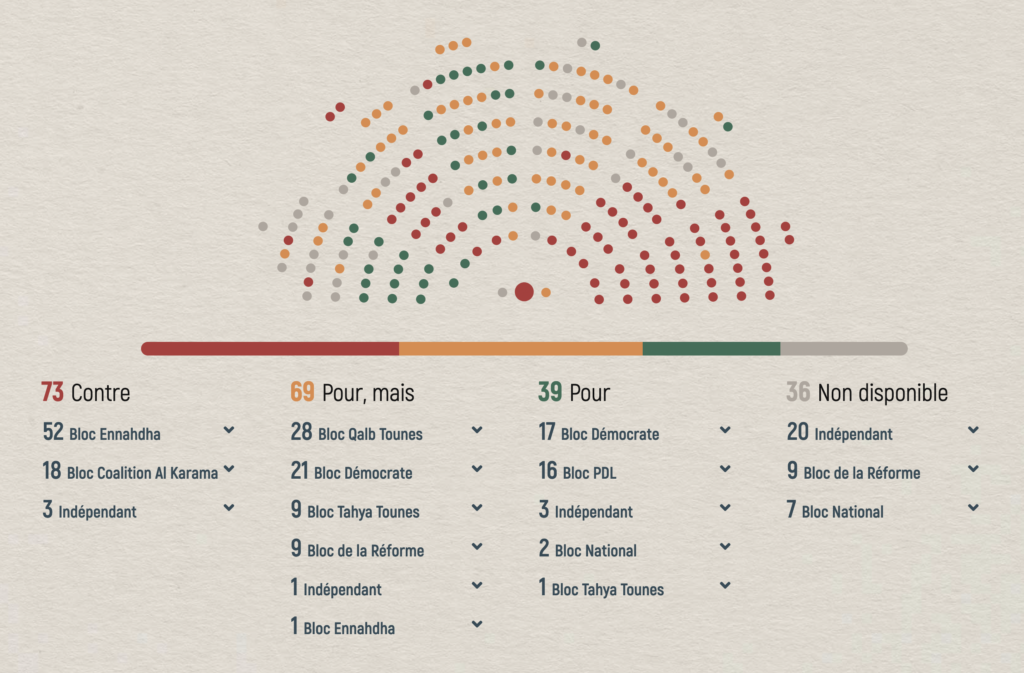
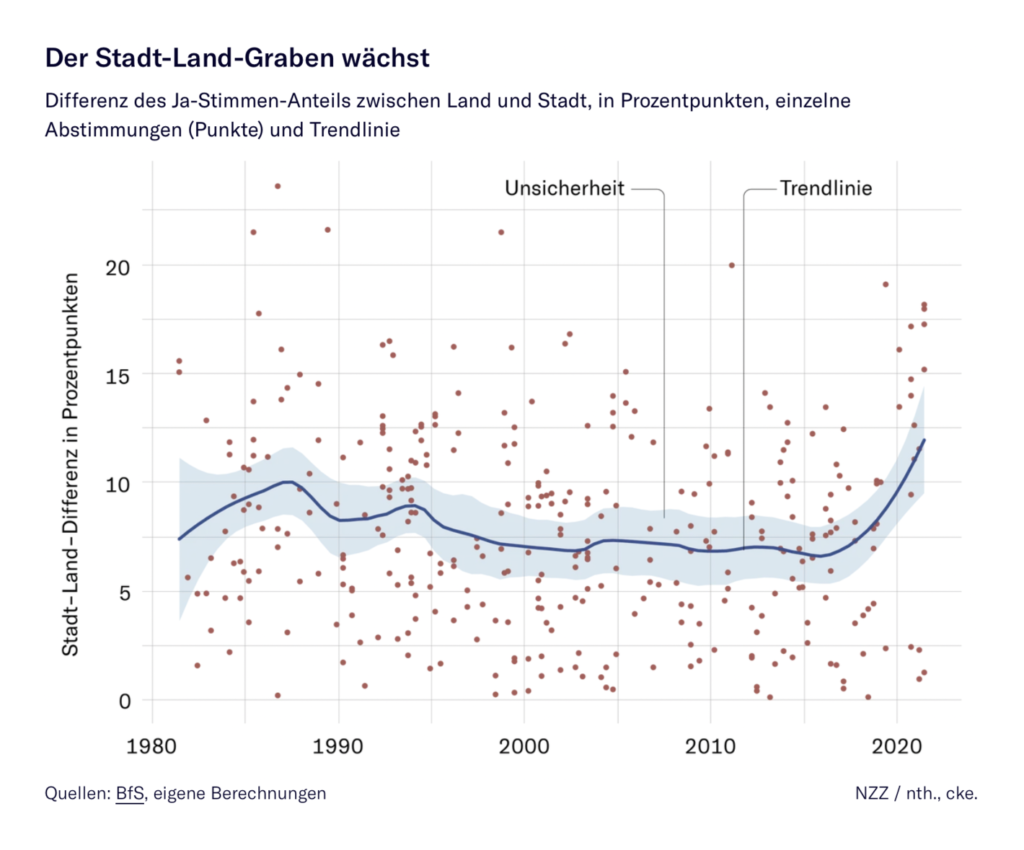
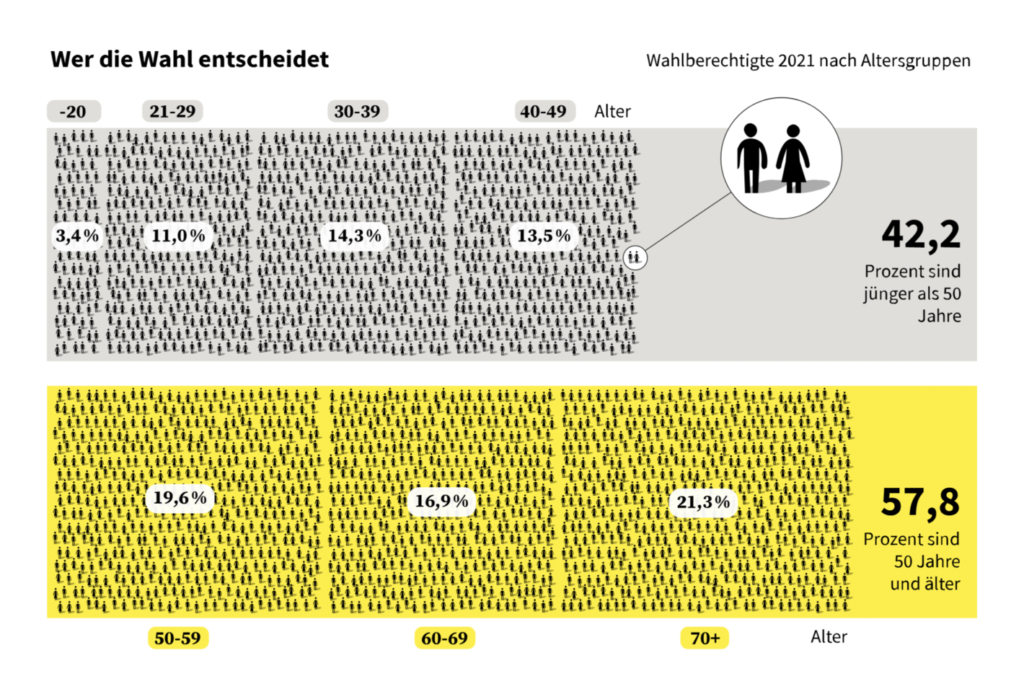
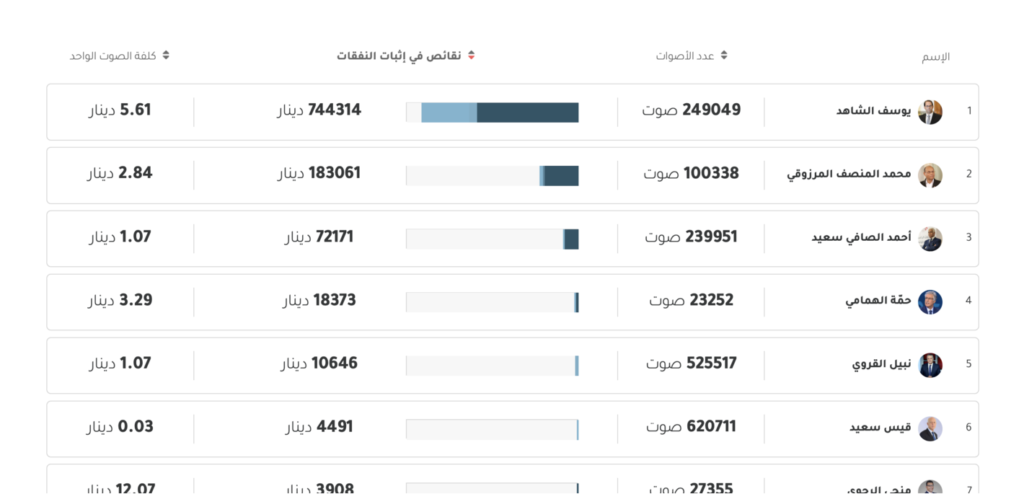
Political charts this week offered us the big picture — constitutional crisis in Tunisia, polarization in Switzerland, and the value of a vote in Germany:
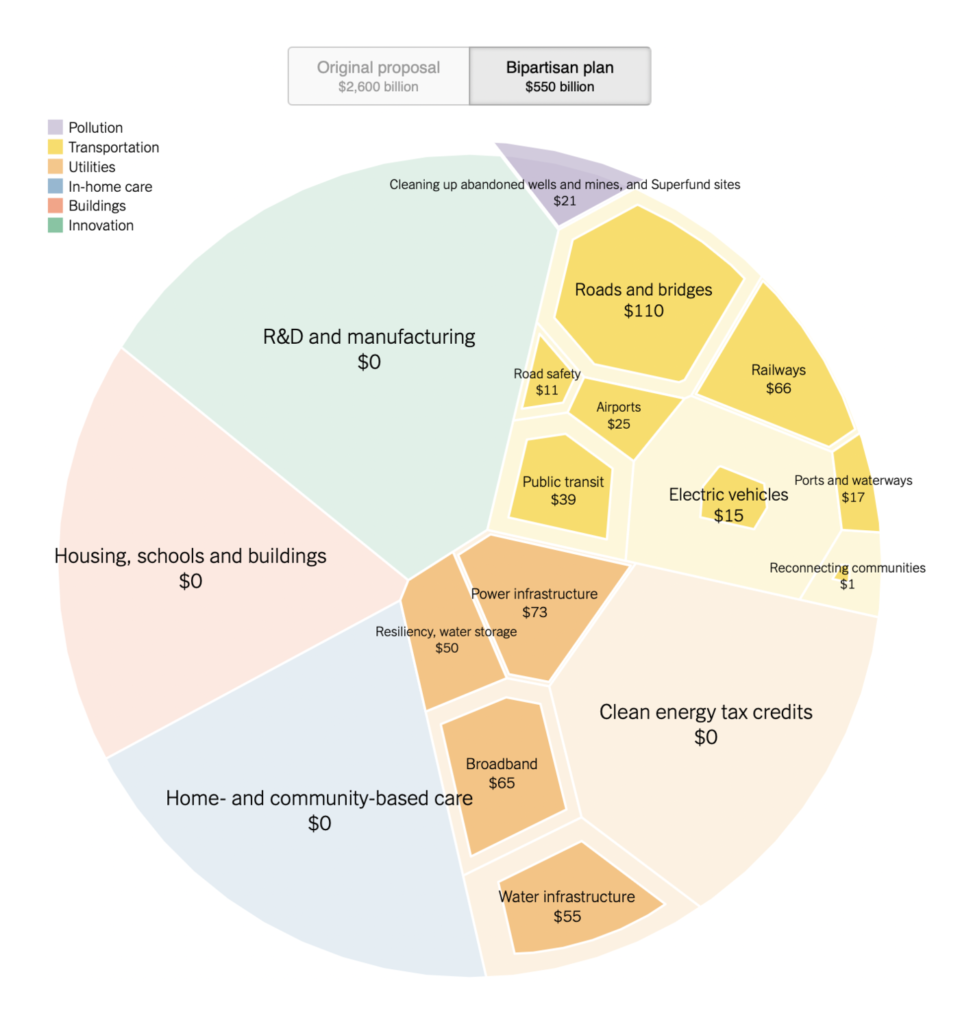
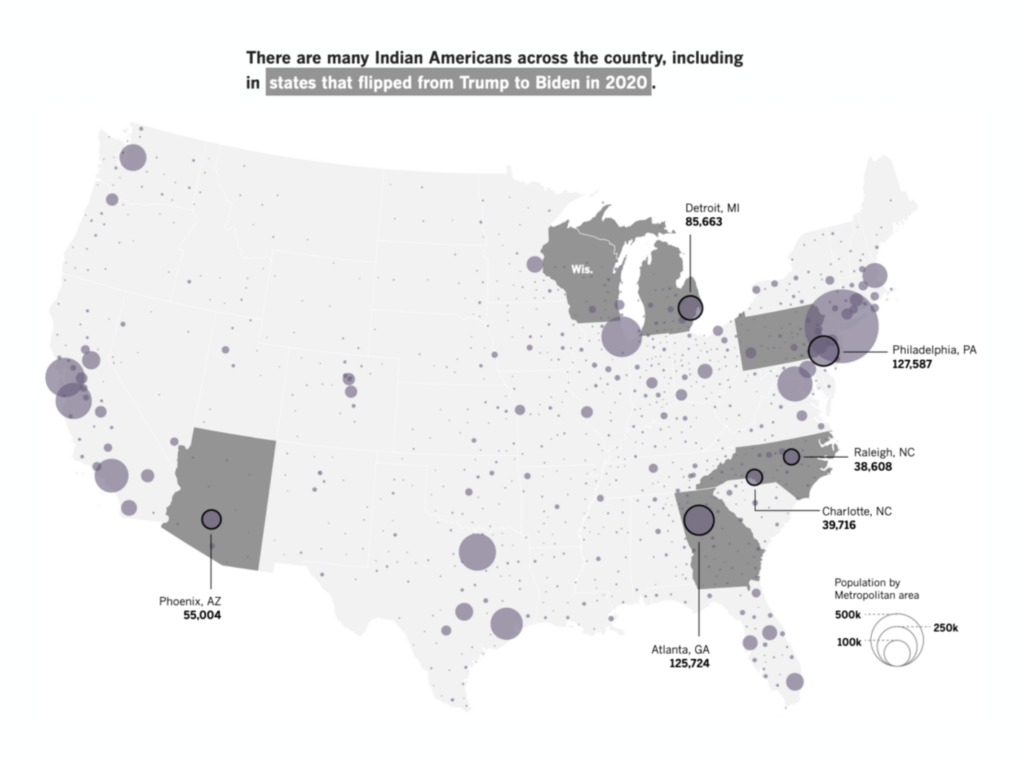
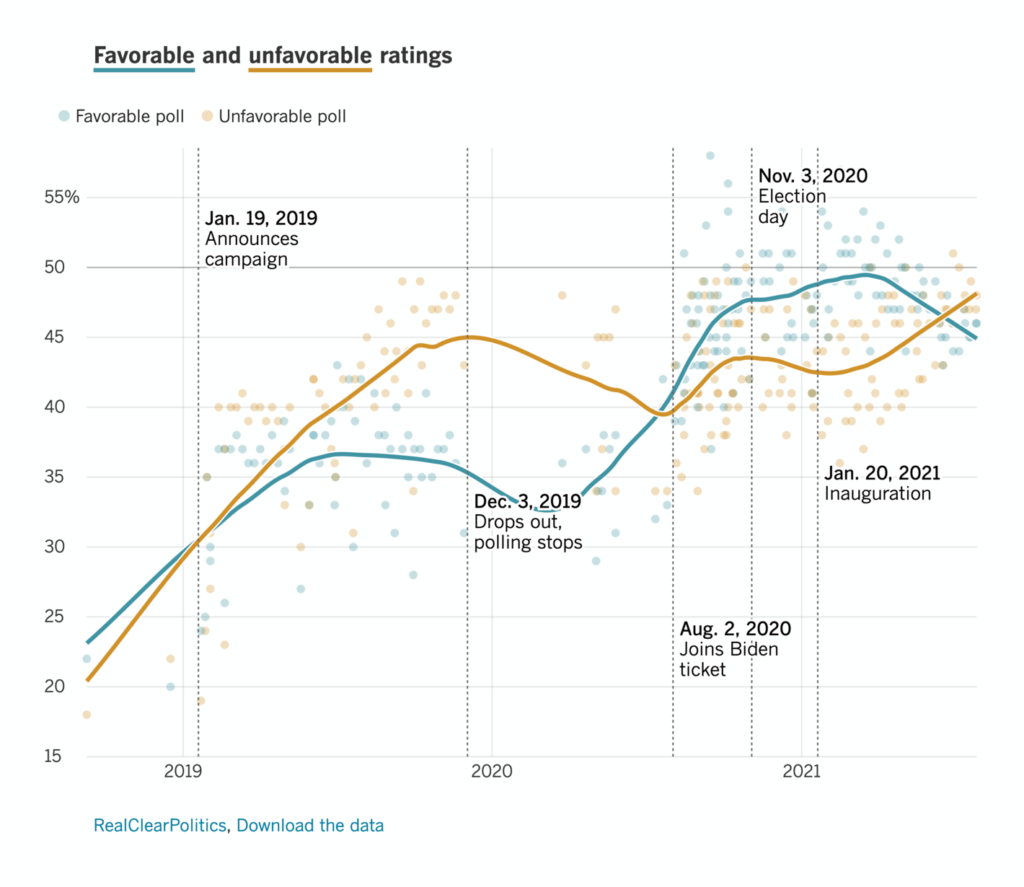
But we also got the political nitty-gritty, with charts on the US infrastructure bill, Indian-Americans in politics, and one Indian-American in particular:
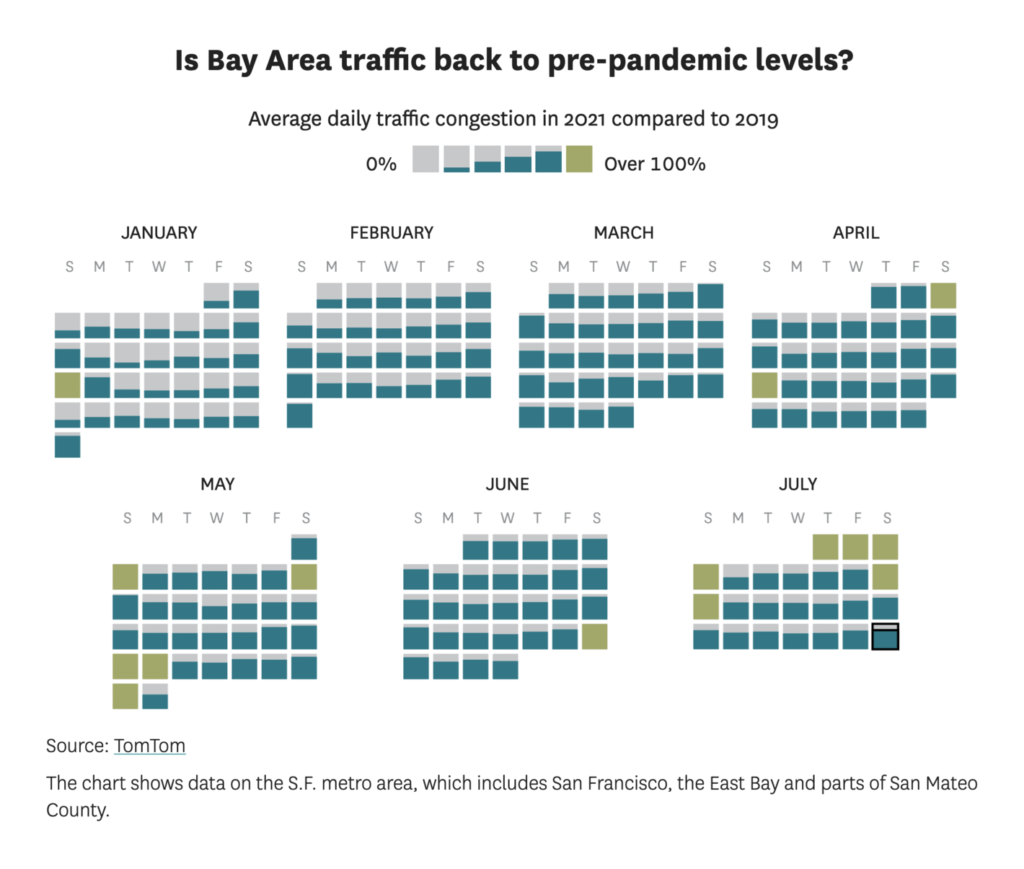
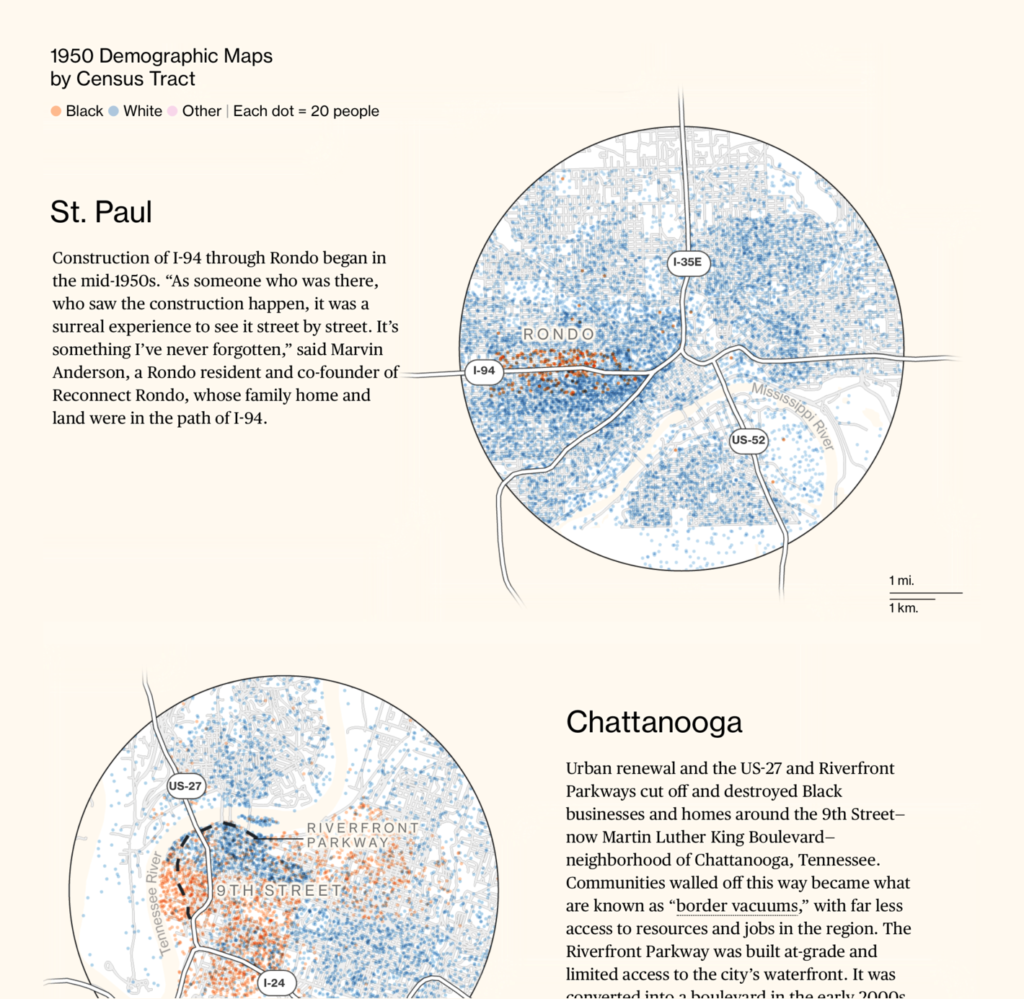
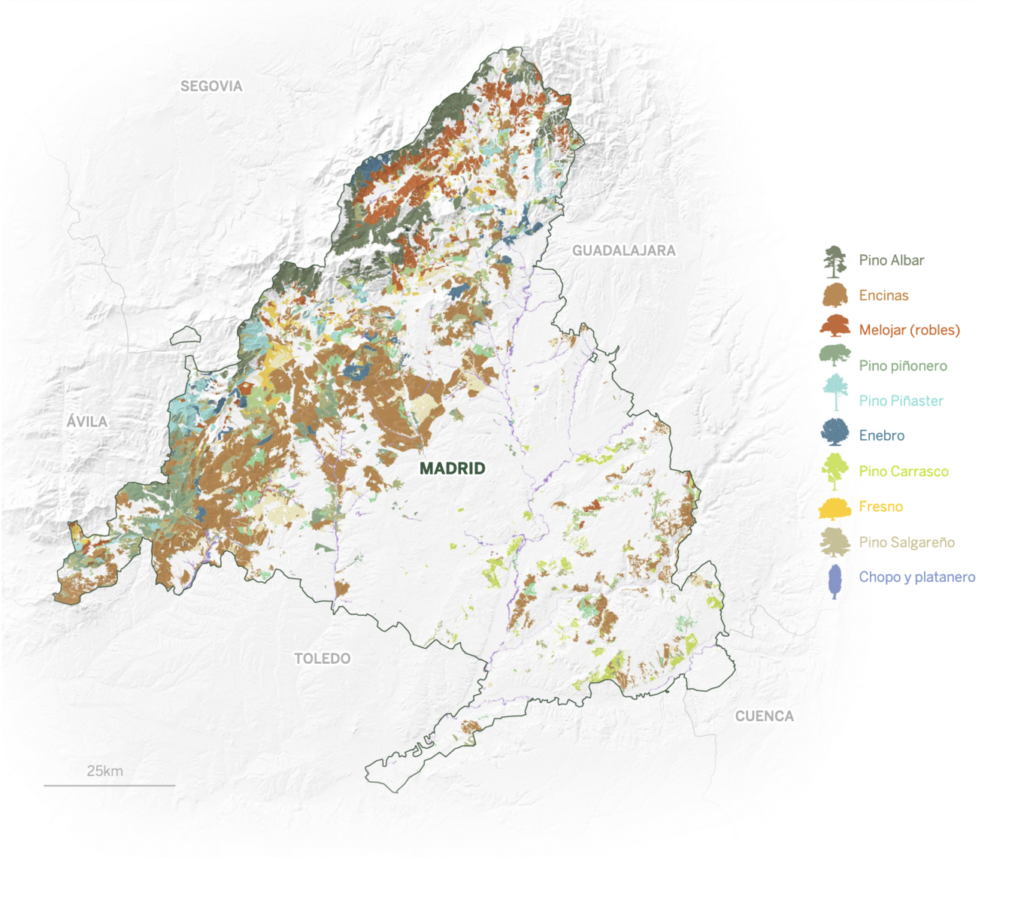
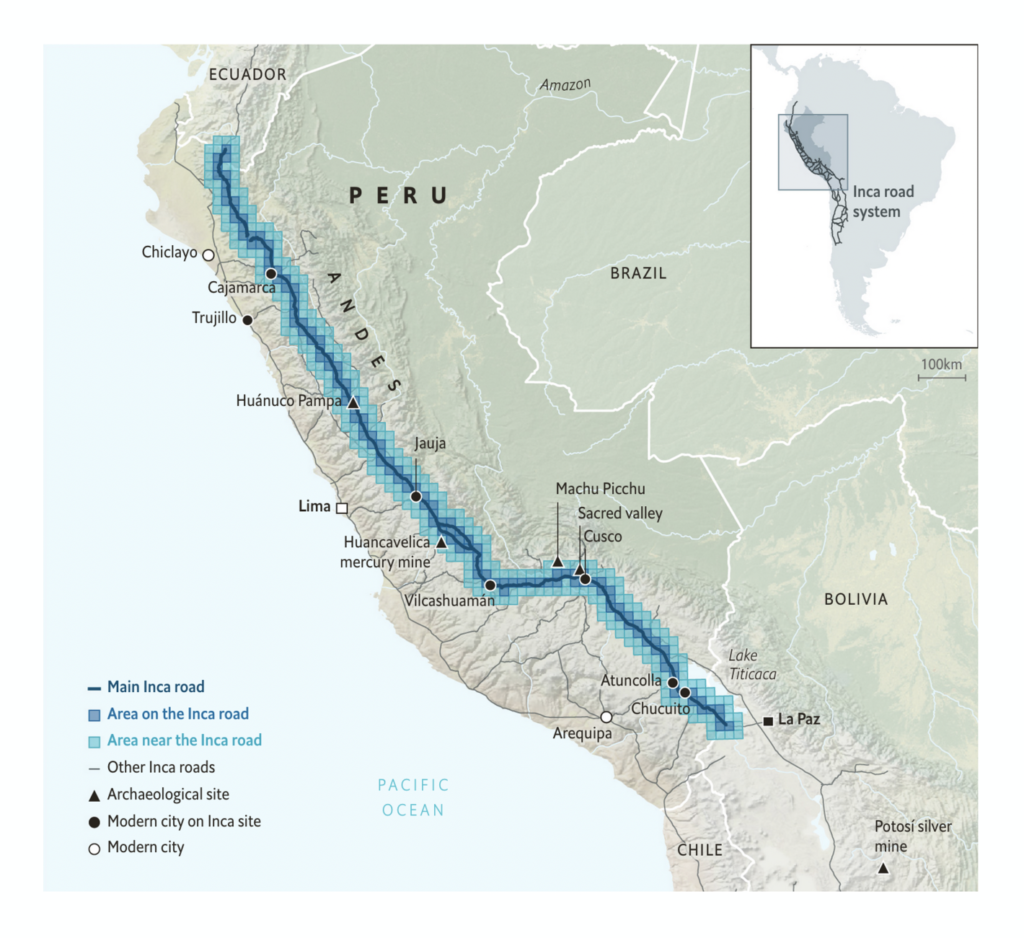
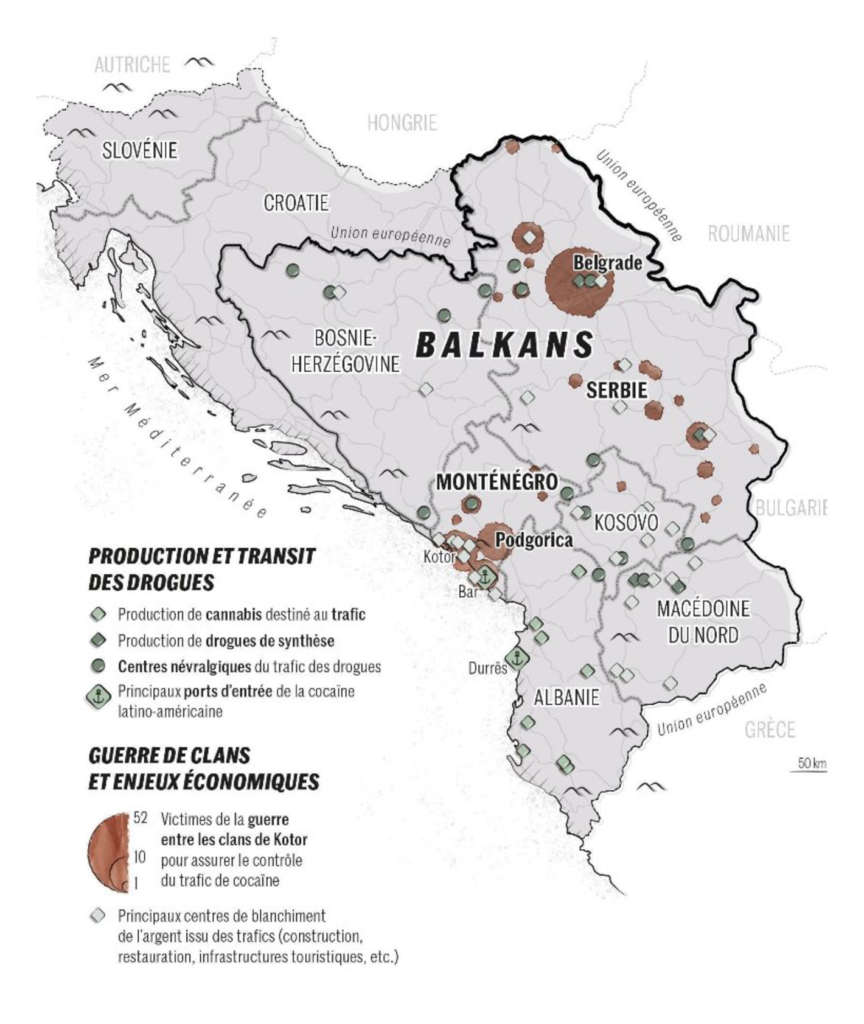
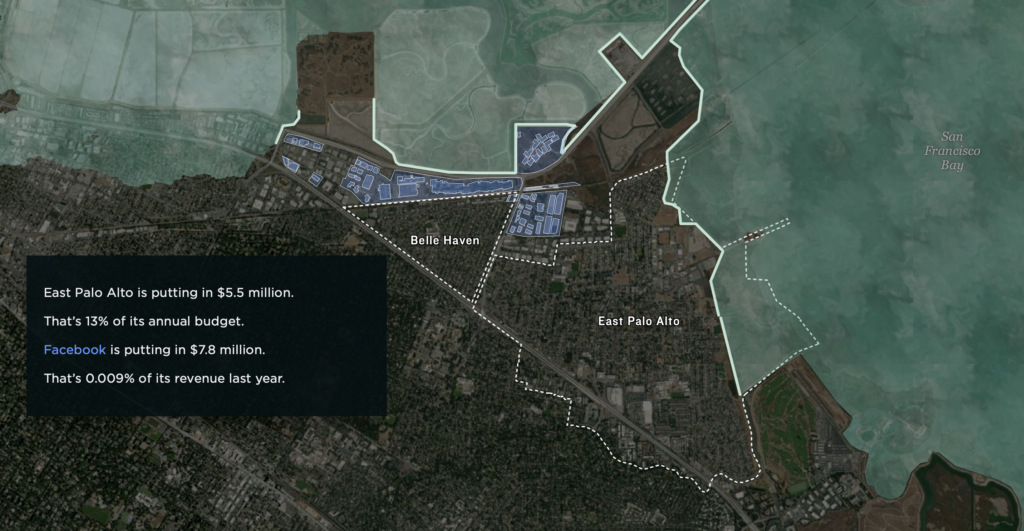
Maps this week focused on cities and infrastructure:
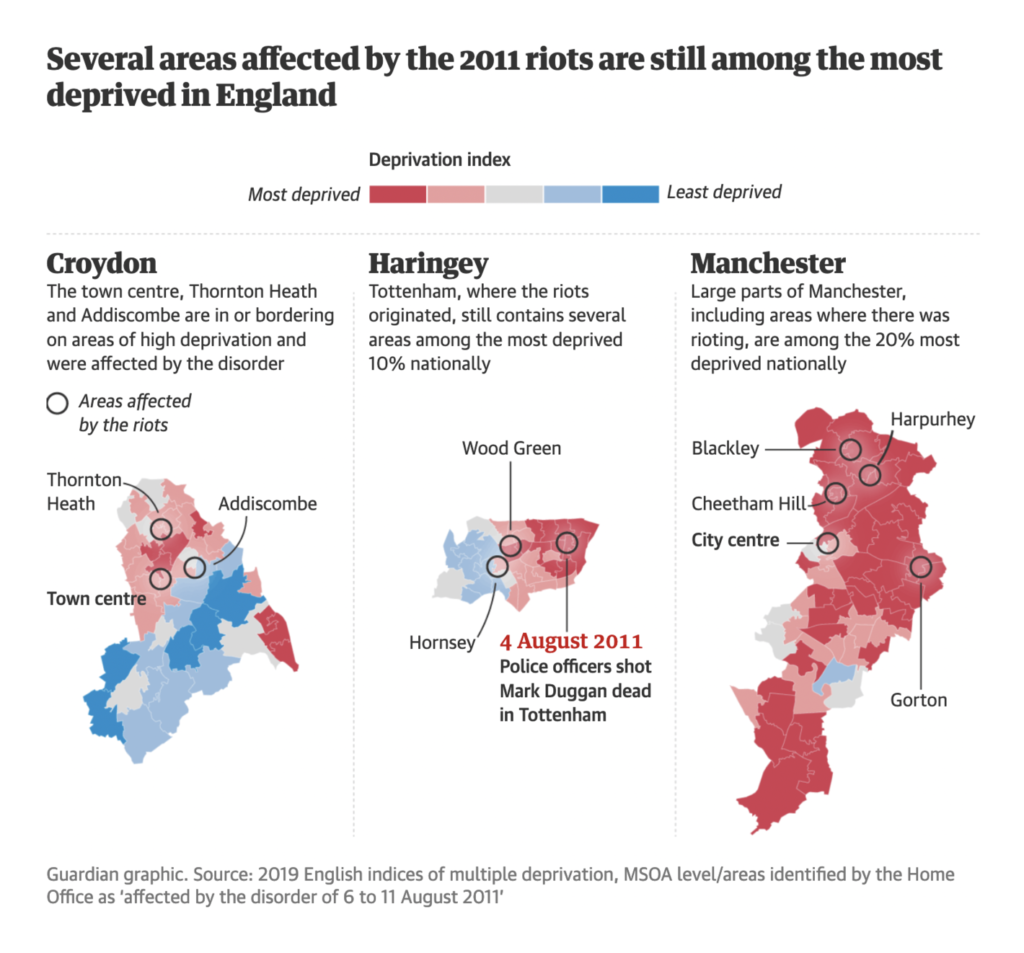
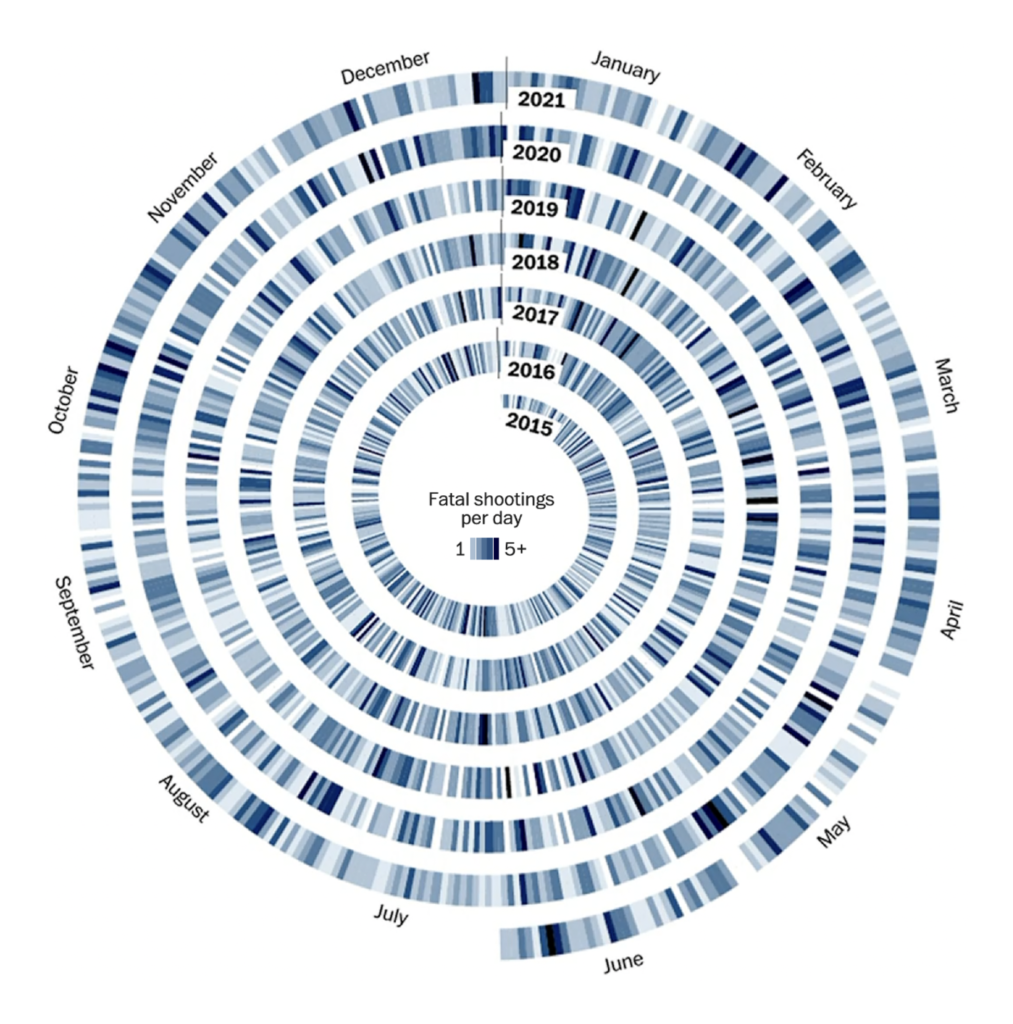
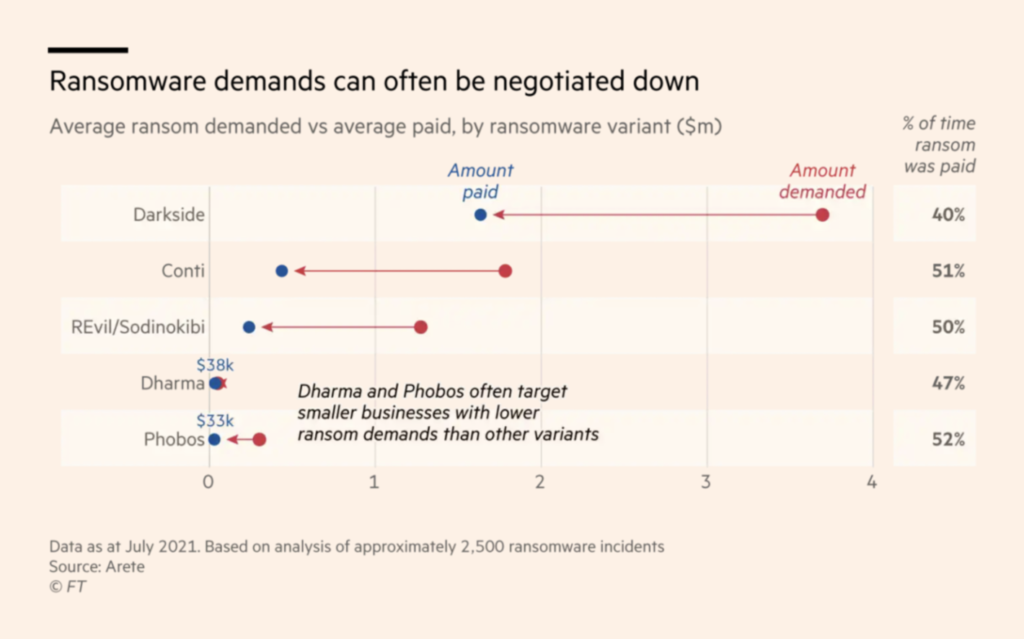
And charts explored crime, corruption, and transparency:
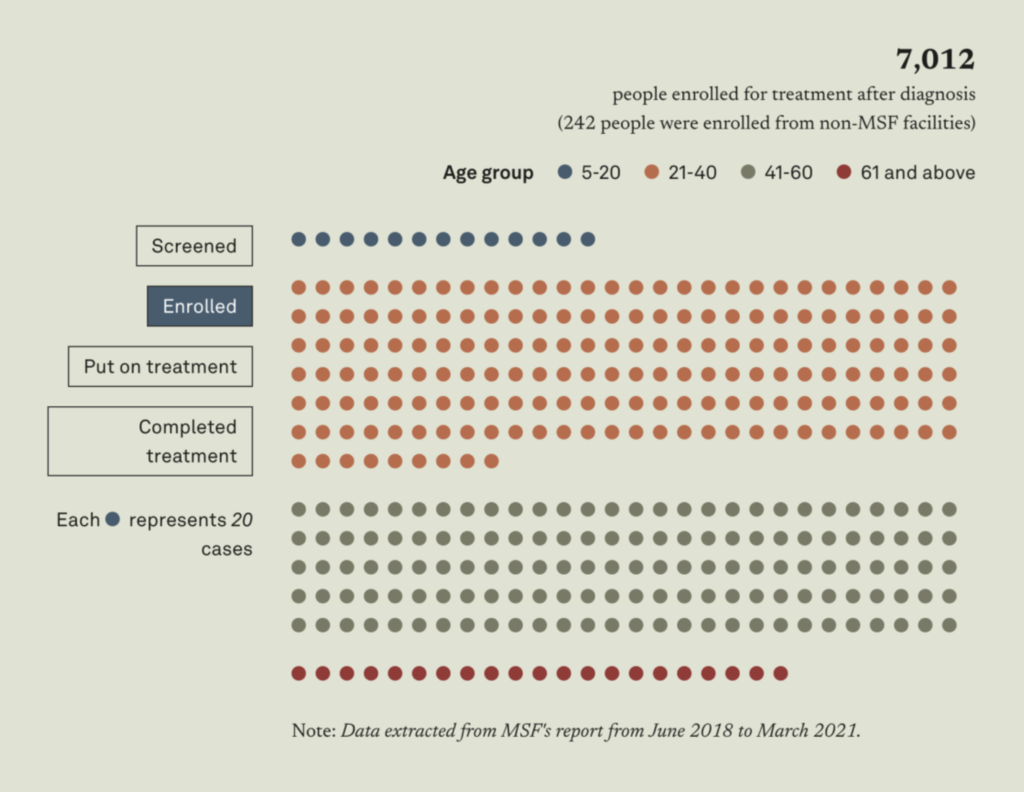
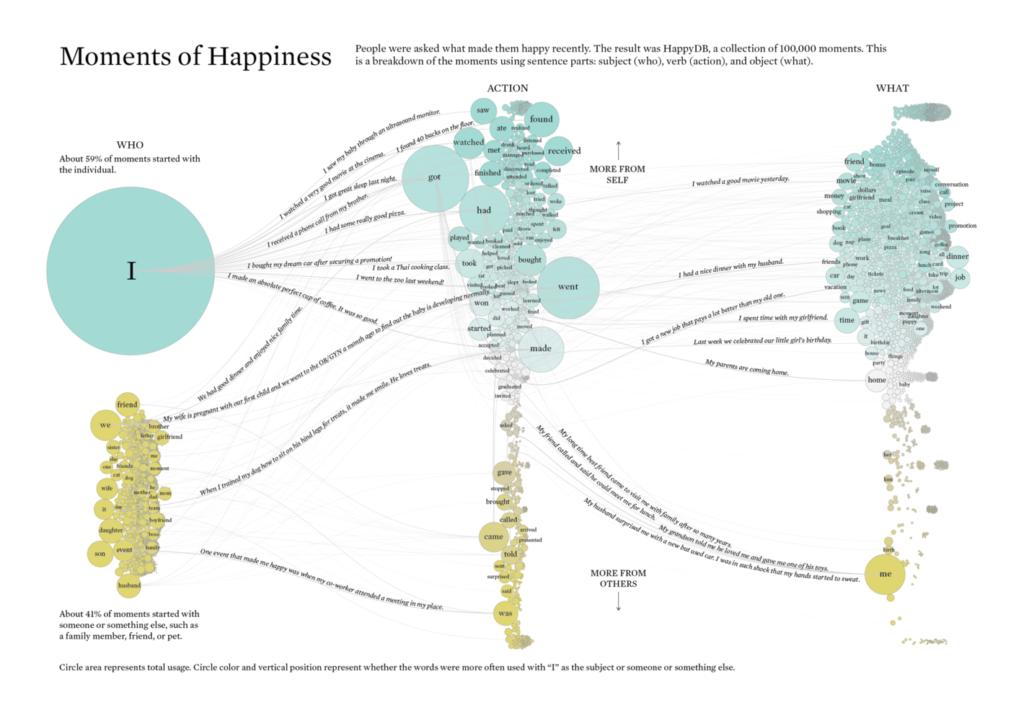
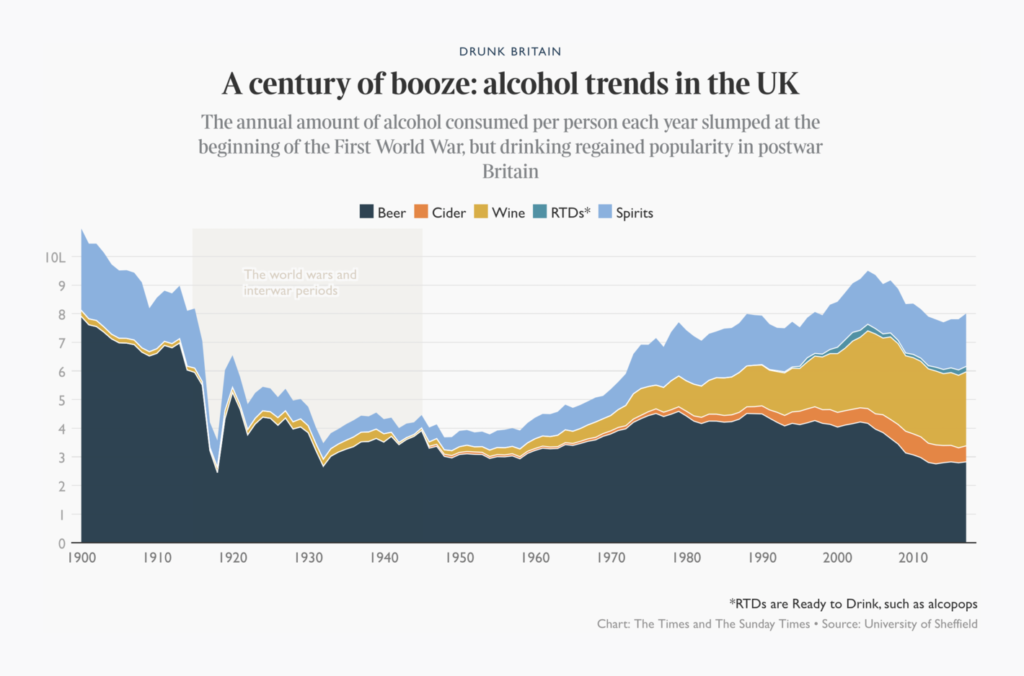
Finally, we saw health, happiness, and how the British are trying to get there:
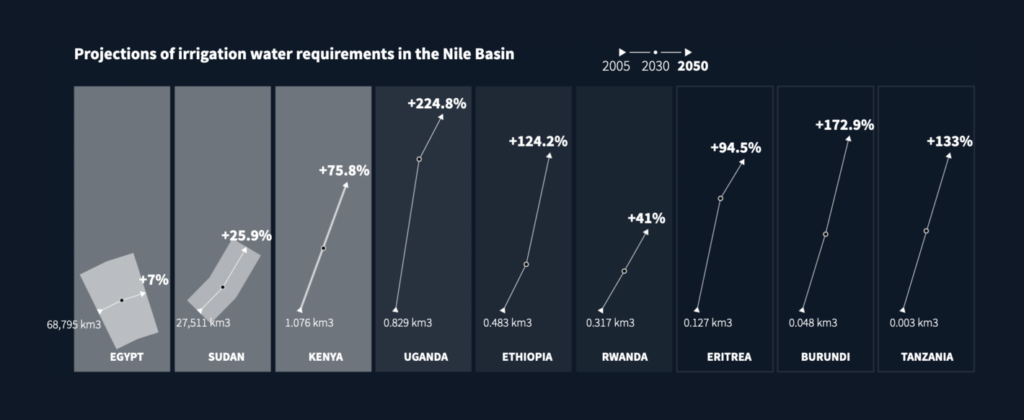
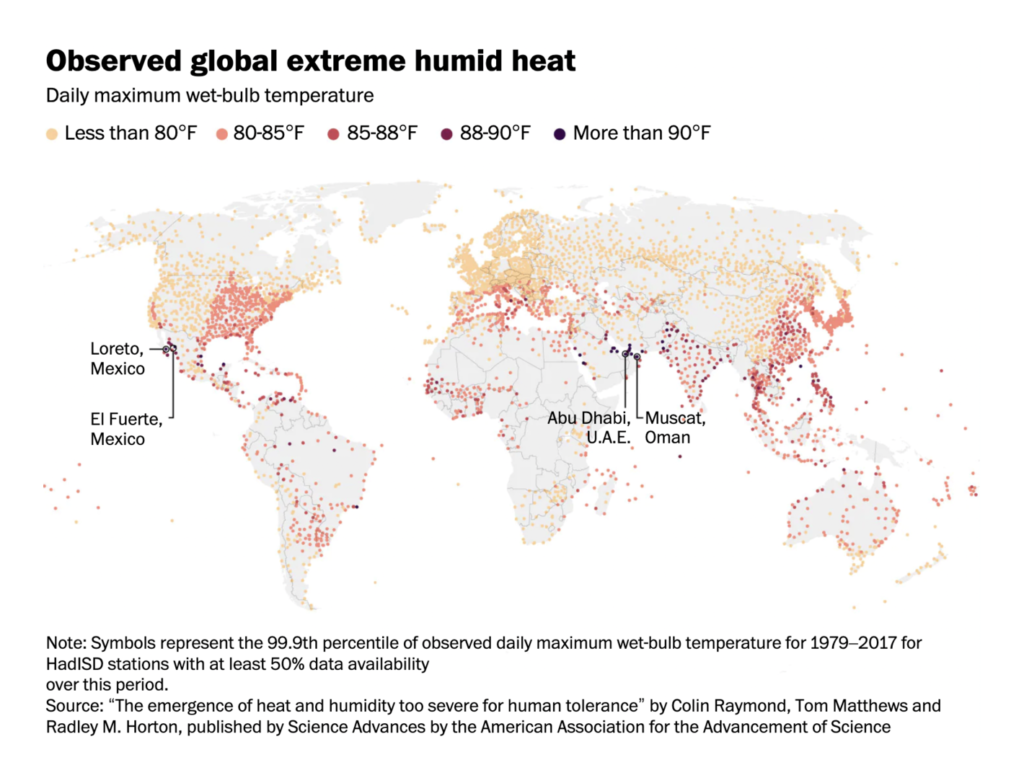
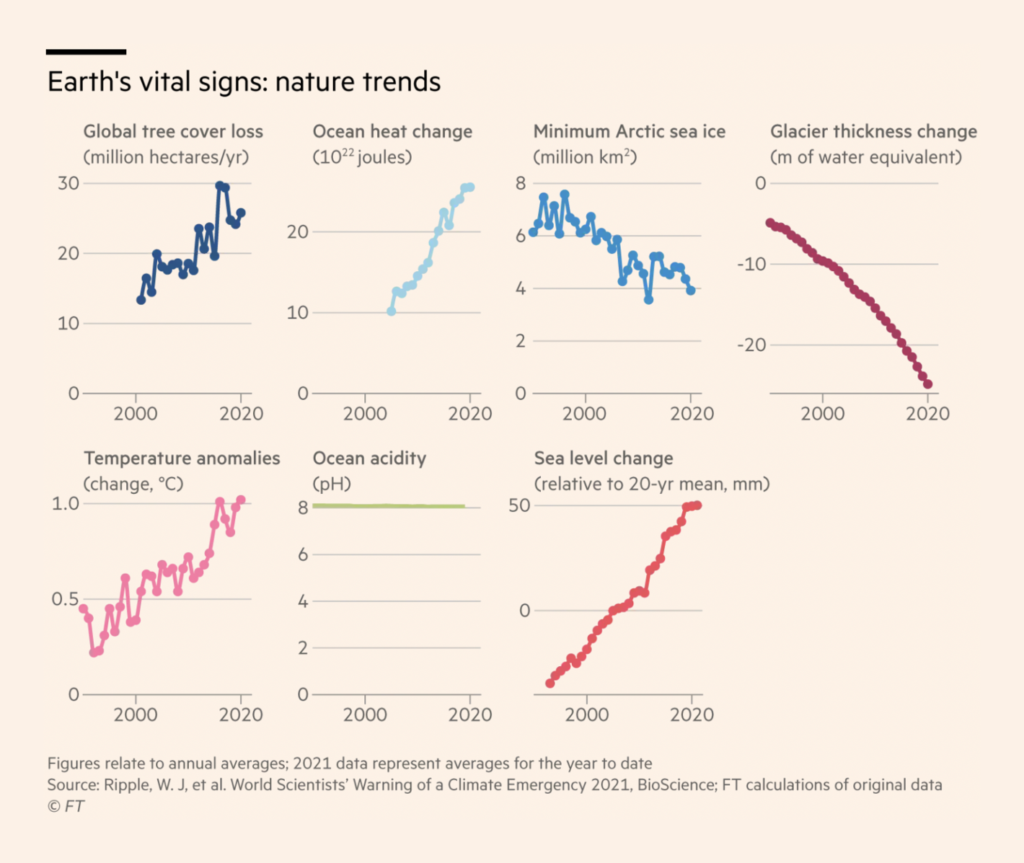
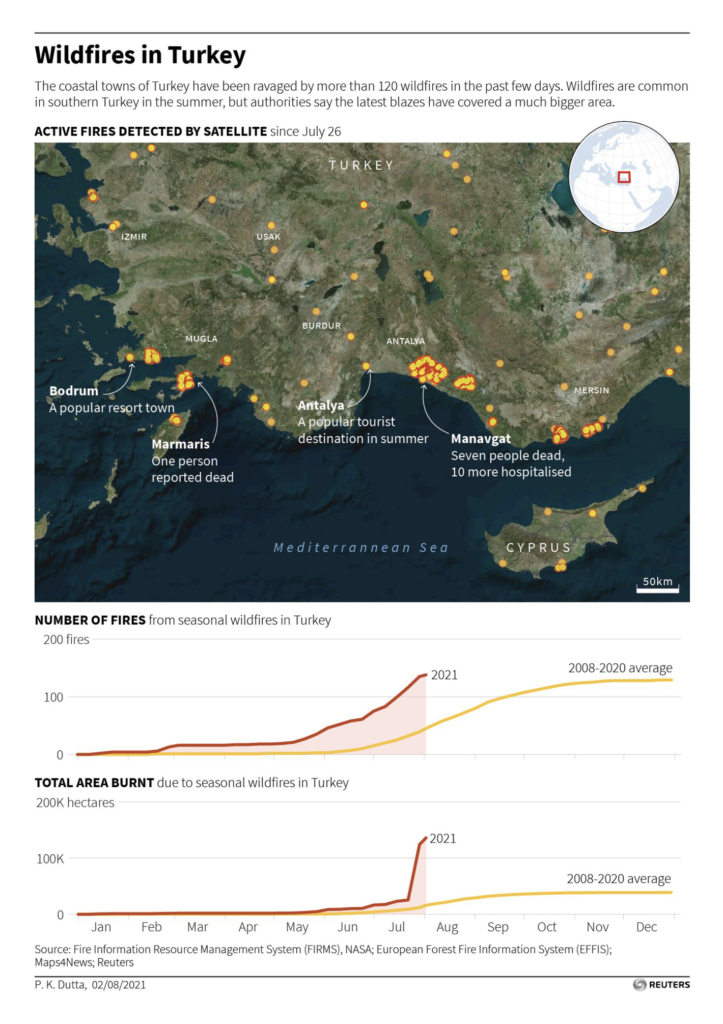
But no week goes by without charts on the climate crisis:
And the floods and fires that come with it:
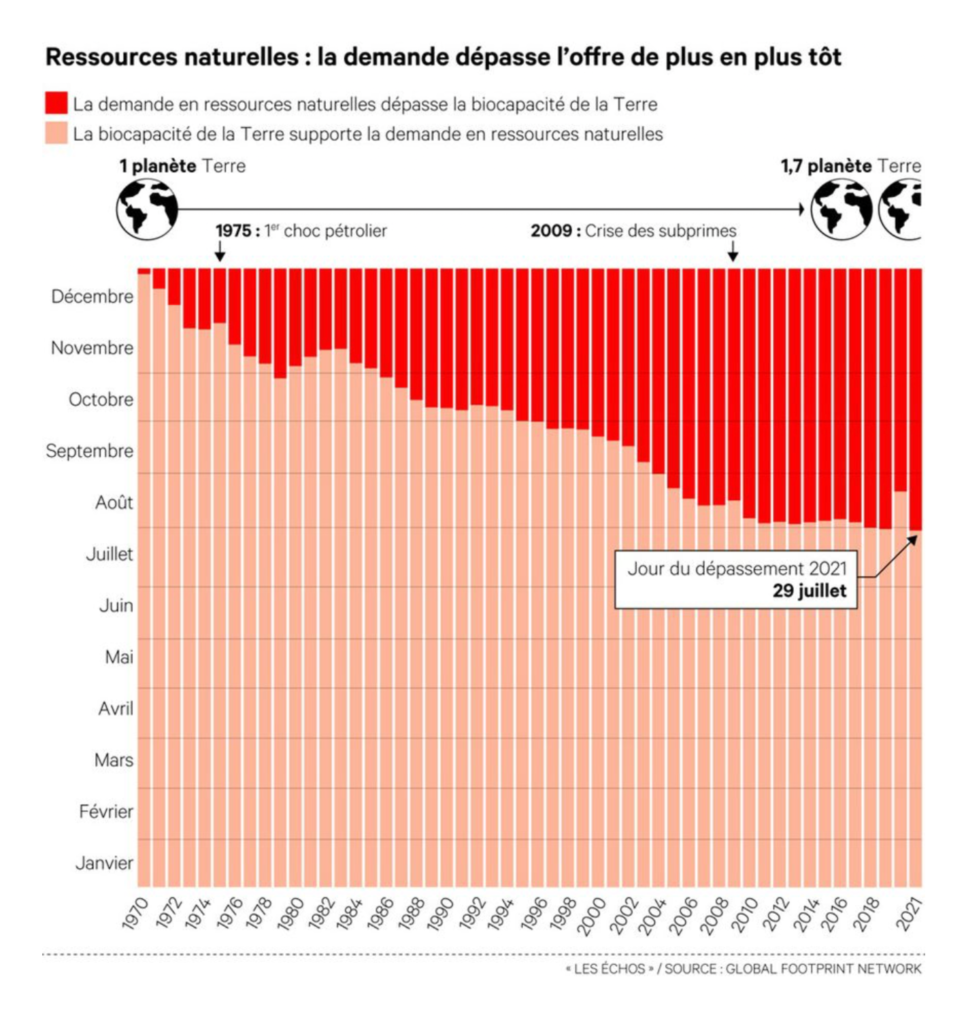
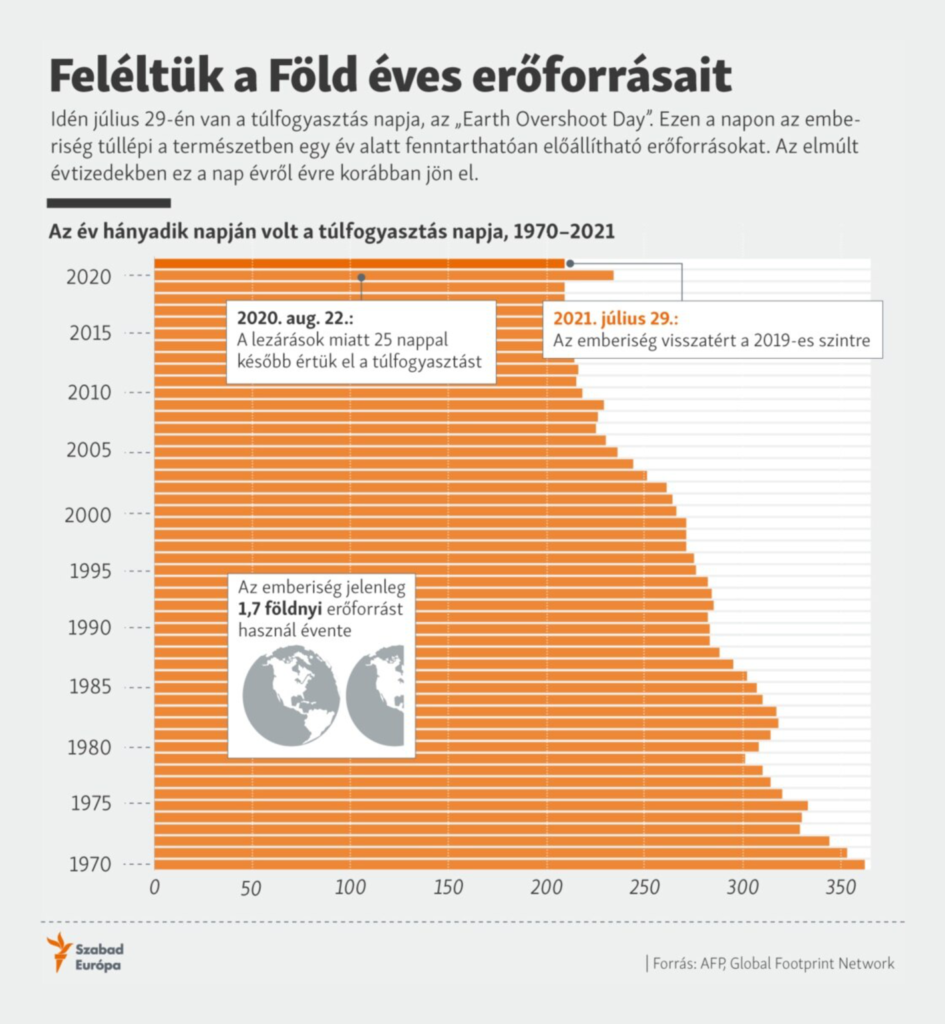
In particular, this week marked Earth Overshoot Day for 2021 — meaning that as of last Thursday, we’ve been living off resources borrowed from the future:
What else we found interesting


Help us make this dispatch better! We’d love to hear which newsletters, blogs, or social media accounts we need to follow to learn about interesting projects, especially from less-covered parts of the world (Asia, South America, Africa). Write us at hello@datawrapper.de or leave a comment below.


Comments