Data Vis Dispatch, August 31

The best of last week’s big and small data visualizations

Welcome back to the 11th edition of Data Vis Dispatch! Every week, we’ll be publishing a collection of the best small and large data visualizations we find, especially from news organizations — to celebrate data journalism, data visualization, simple charts, elaborate maps, and their creators.

Recurring topics this week include the last days of America’s war in Afghanistan, the arrival of Hurricane Ida at the coast of Louisiana, Mississippi, and Alabama in the U.S., and yes, yet again, the rise of COVID-19 cases.

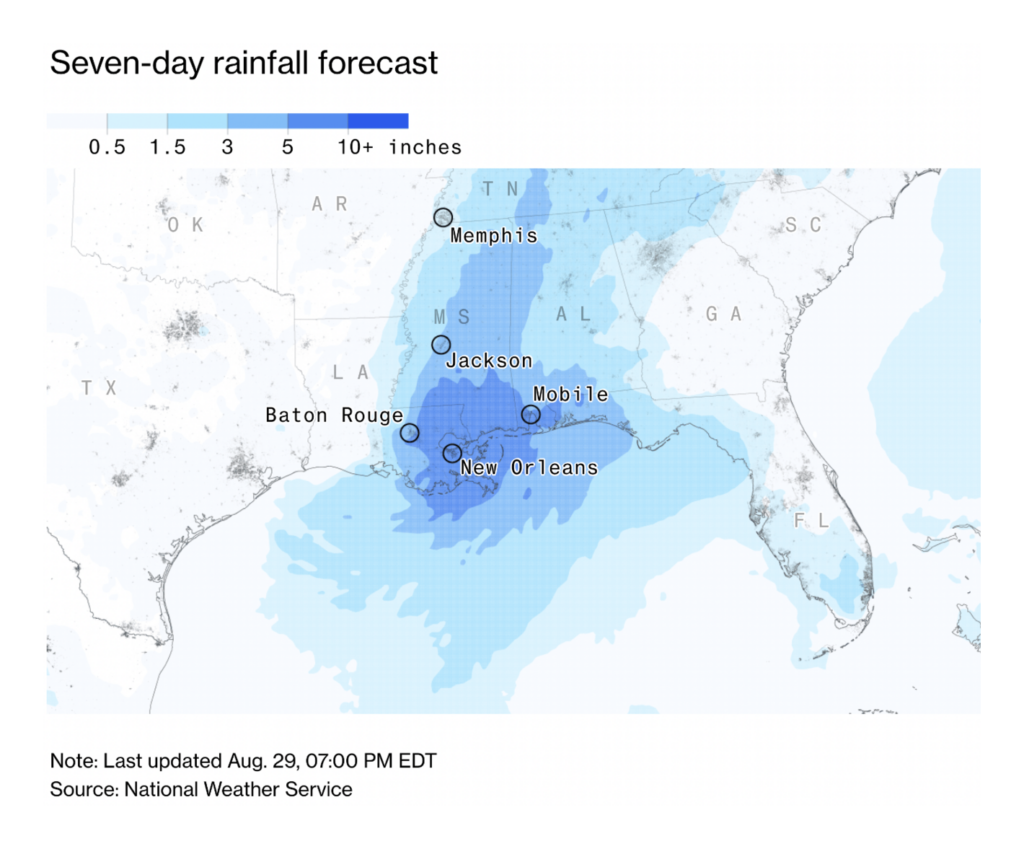
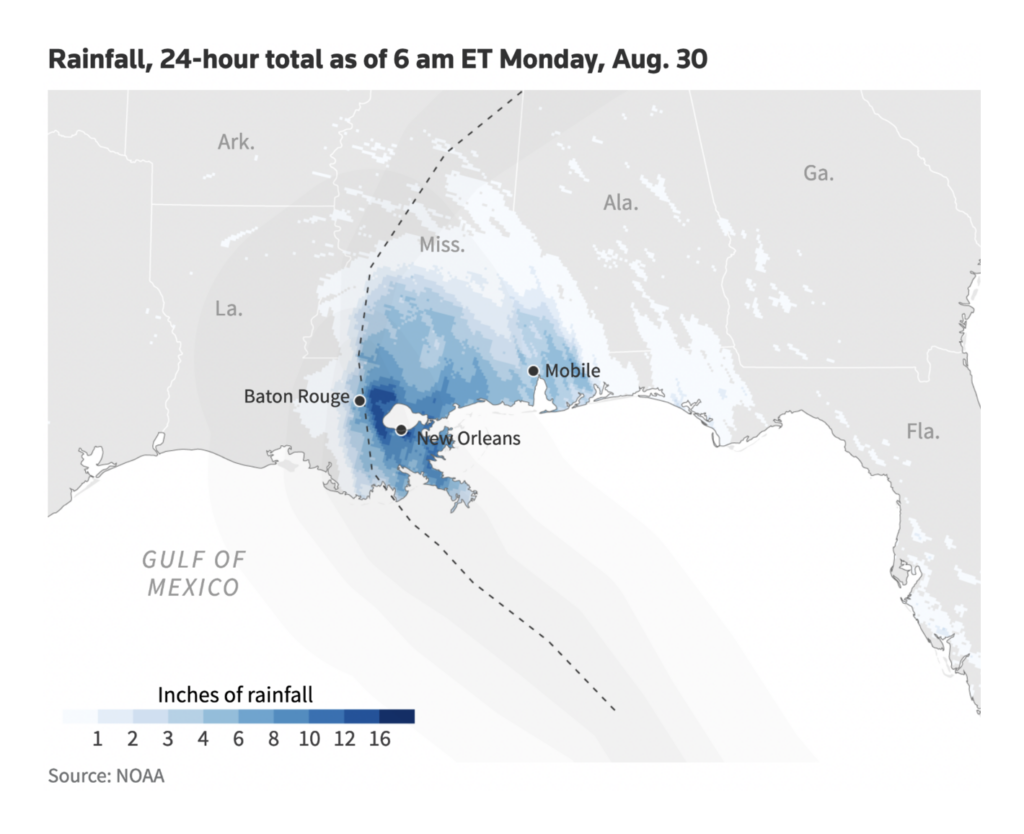
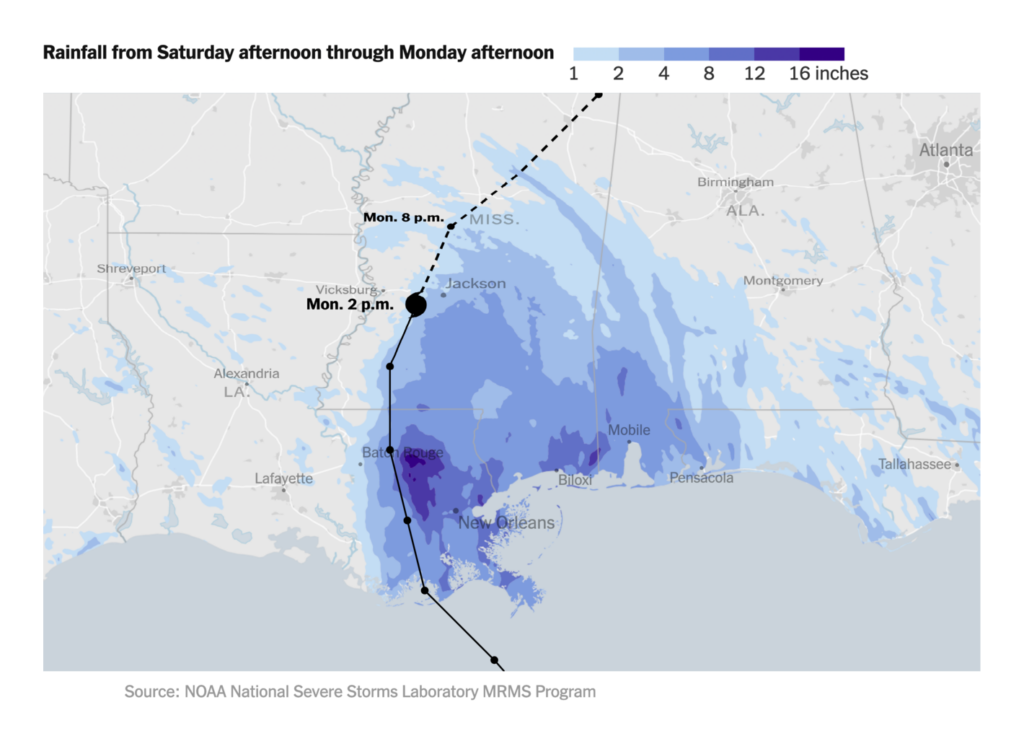
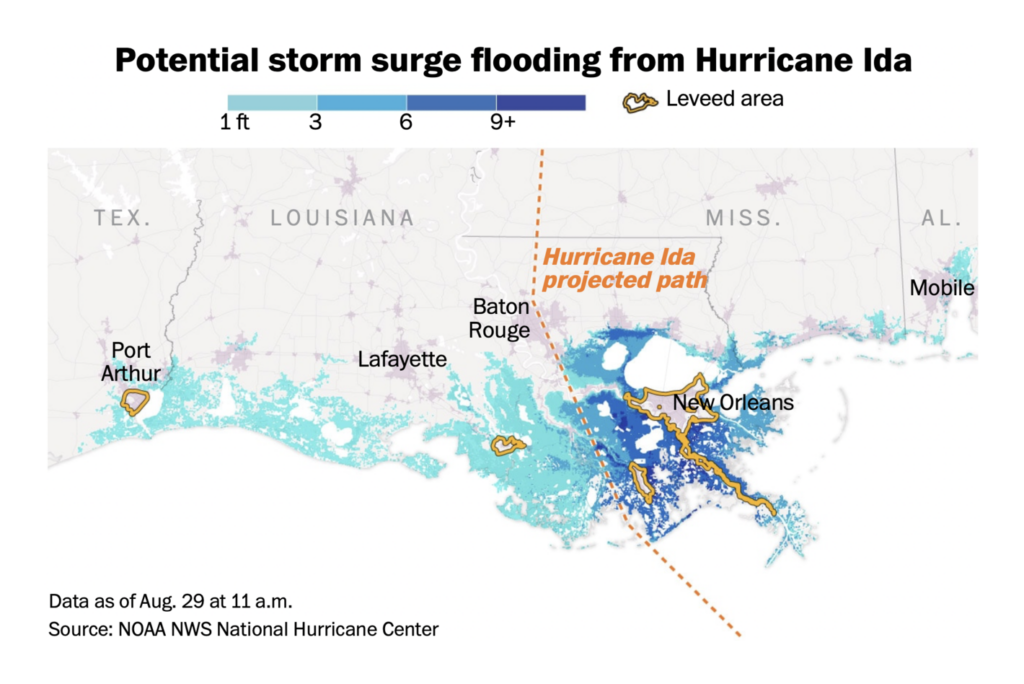
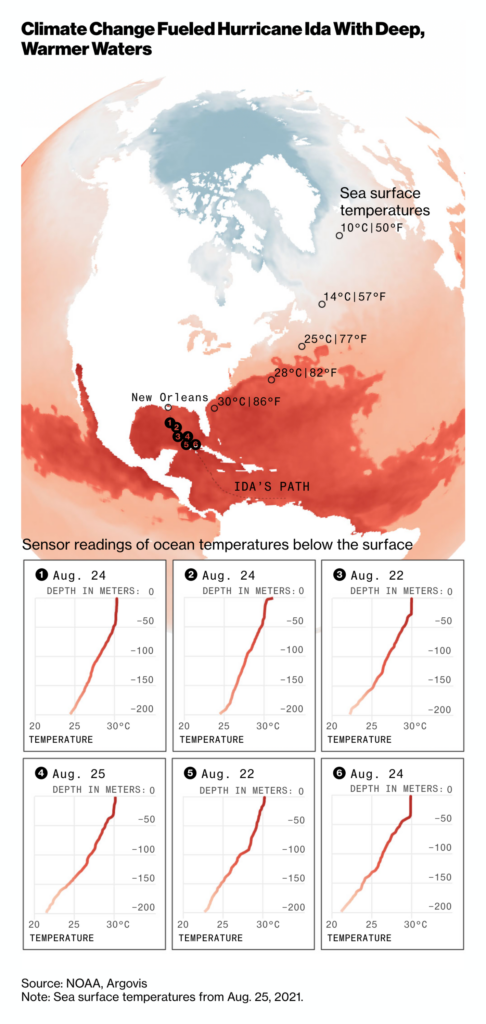
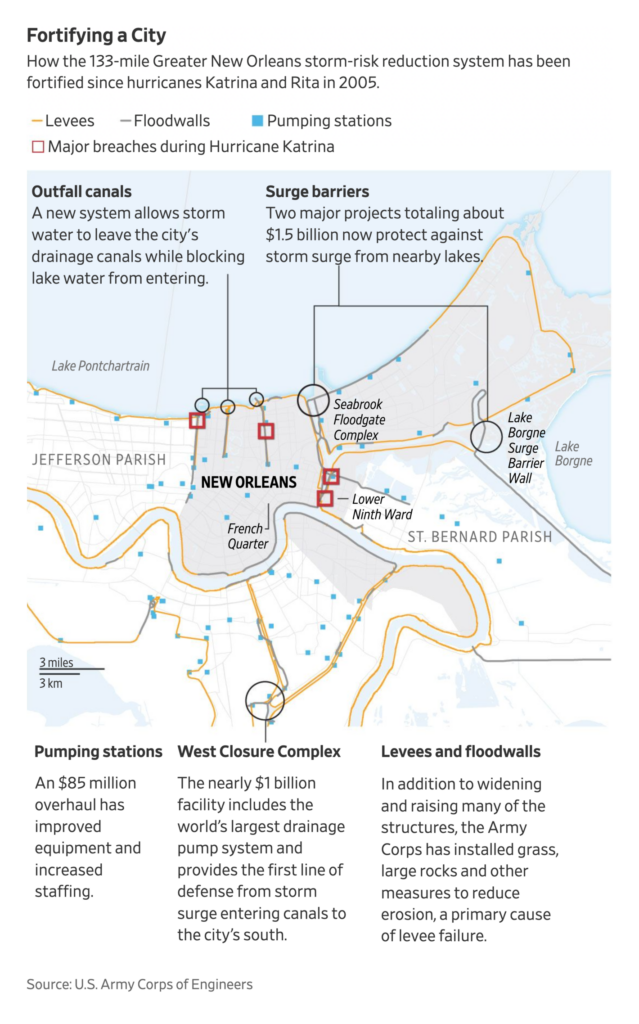
First, Hurricane Ida, which pummeled the Gulf Coast. Many newsrooms offered trackers:

NASA Earth: Hurricane Ida Batters Louisiana, August 30
Bloomberg: Tracking Hurricane Ida’s Projected Path, August 30
Reuters: Hurricane Ida hits Gulf Coast, August 30
The New York Times: Map: Tracking Tropical Storm Ida’s Path, August 26
The Washington Post: Hurricane Ida tracker: Map and projected path, August 29
Bloomberg: Climate Change Fueled Hurricane Ida With Warm, Deep Seawater, August 30
The Wall Street Journal: Hurricane Ida: Did New Orleans’s Storm System Work?, August 30

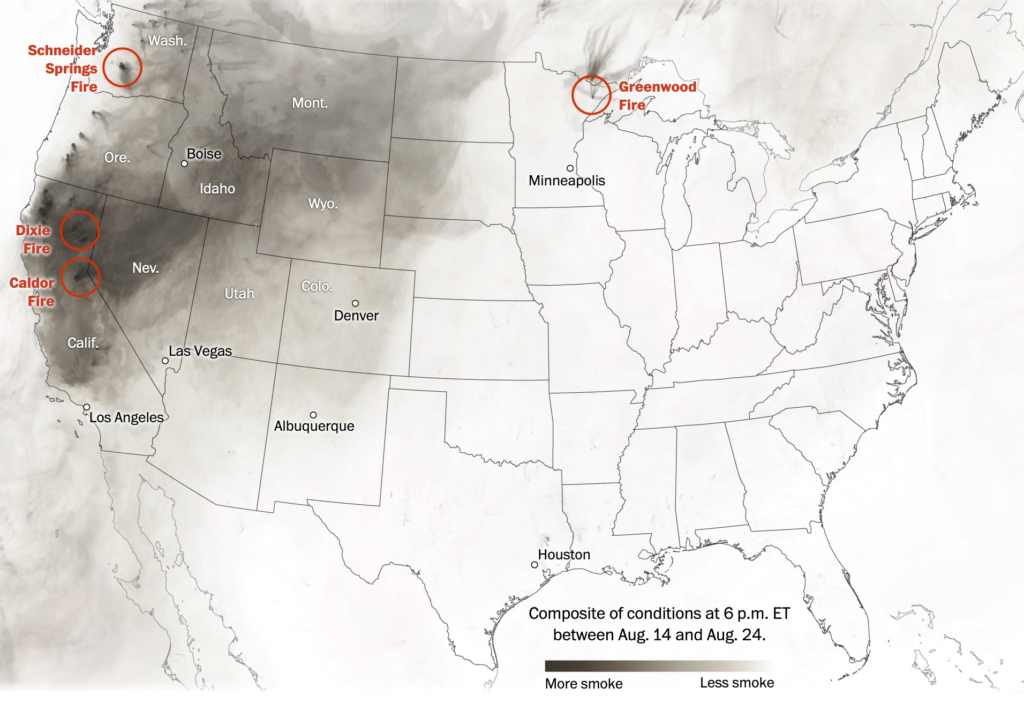
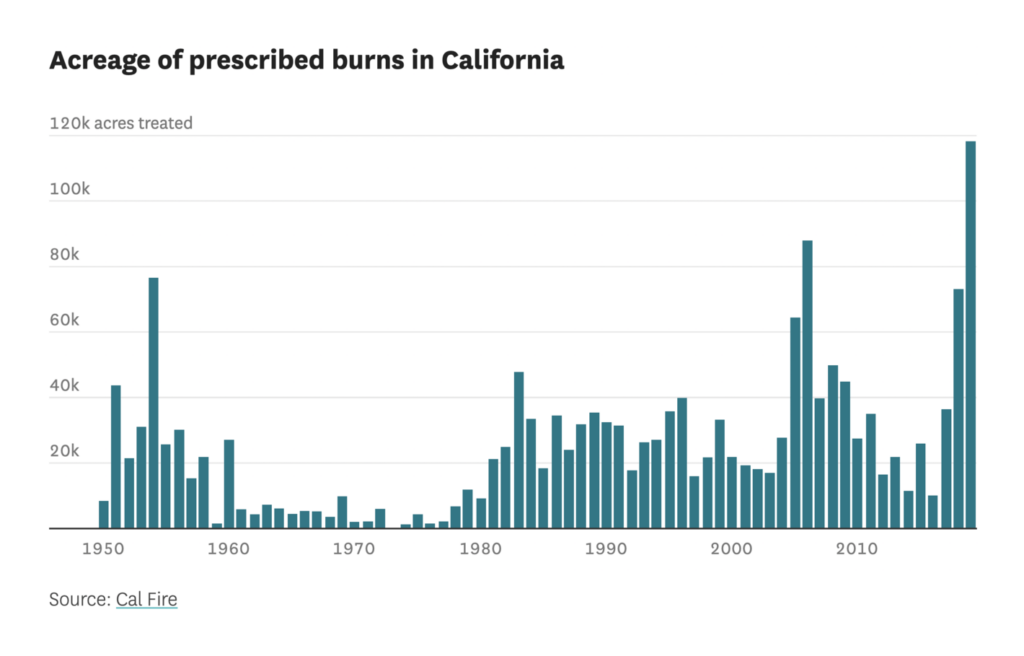
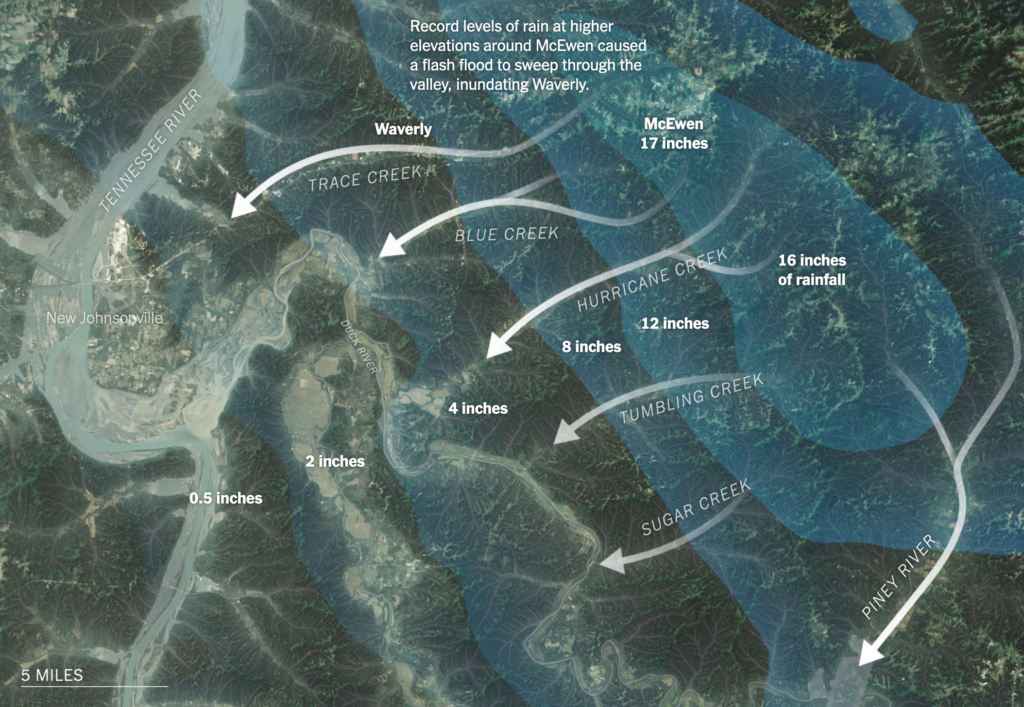
And while Ida made news, the fires and floods of the summer continued:

The Washington Post: Here’s what to know as a summer of wildfires prompts air-quality alerts across the West, August 26
The San Francisco Chronicle: These charts show how fires have changed California, August 25
The New York Times: How Record-Breaking Rainfall Flooded Middle Tennessee, August 25

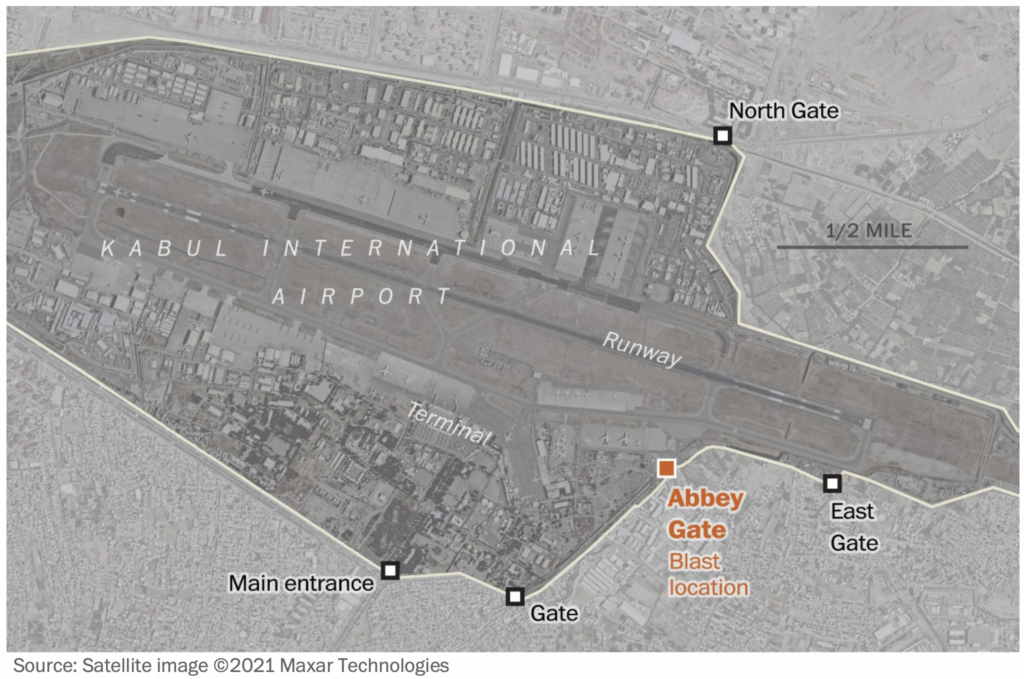
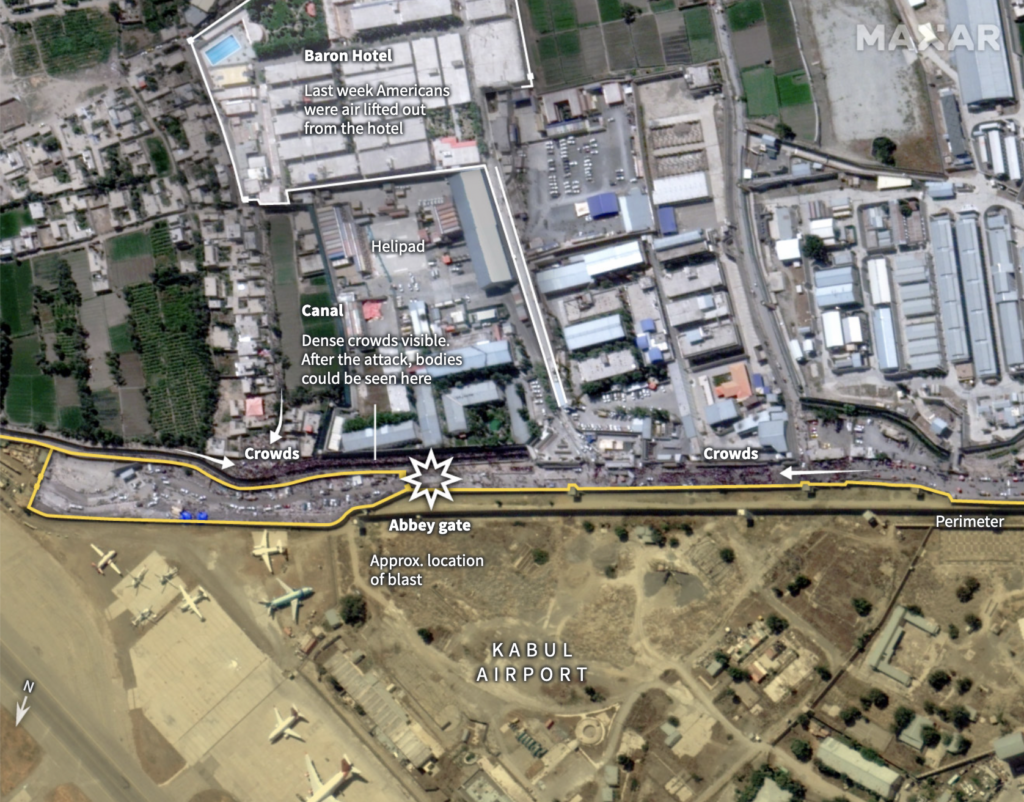
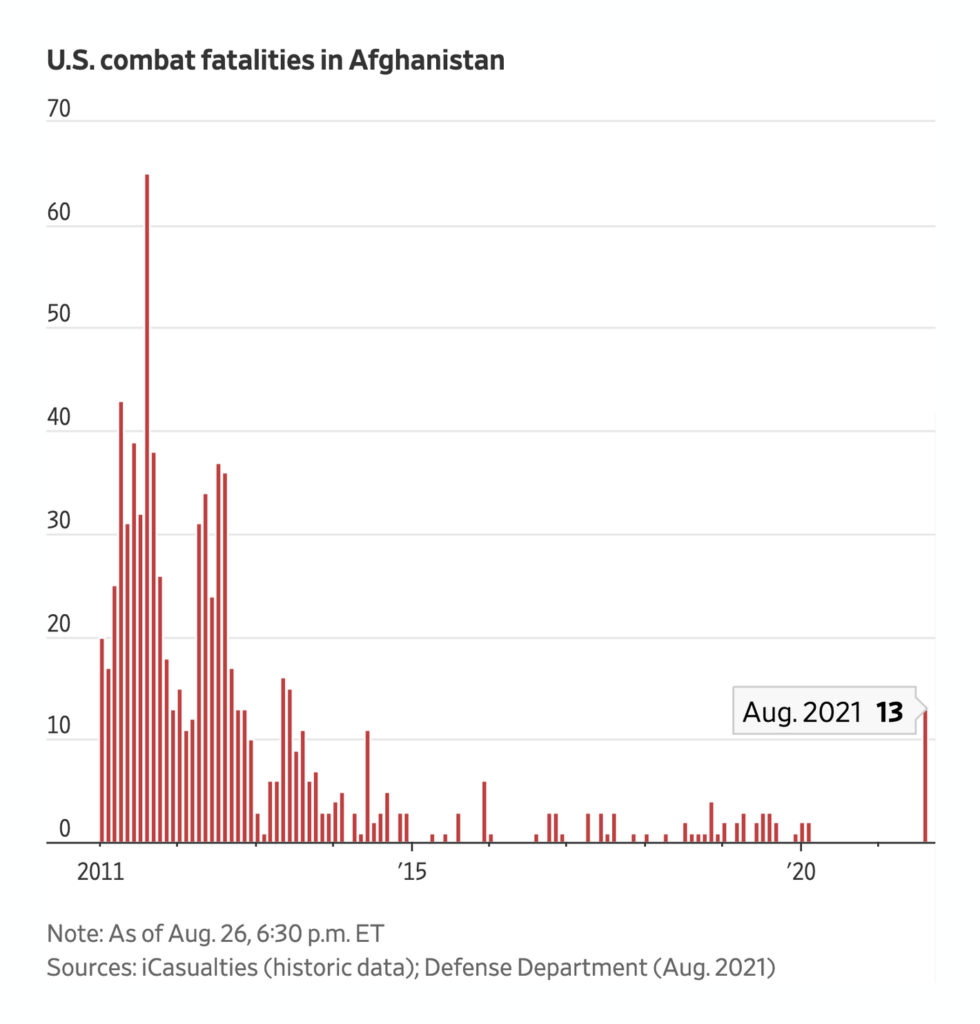
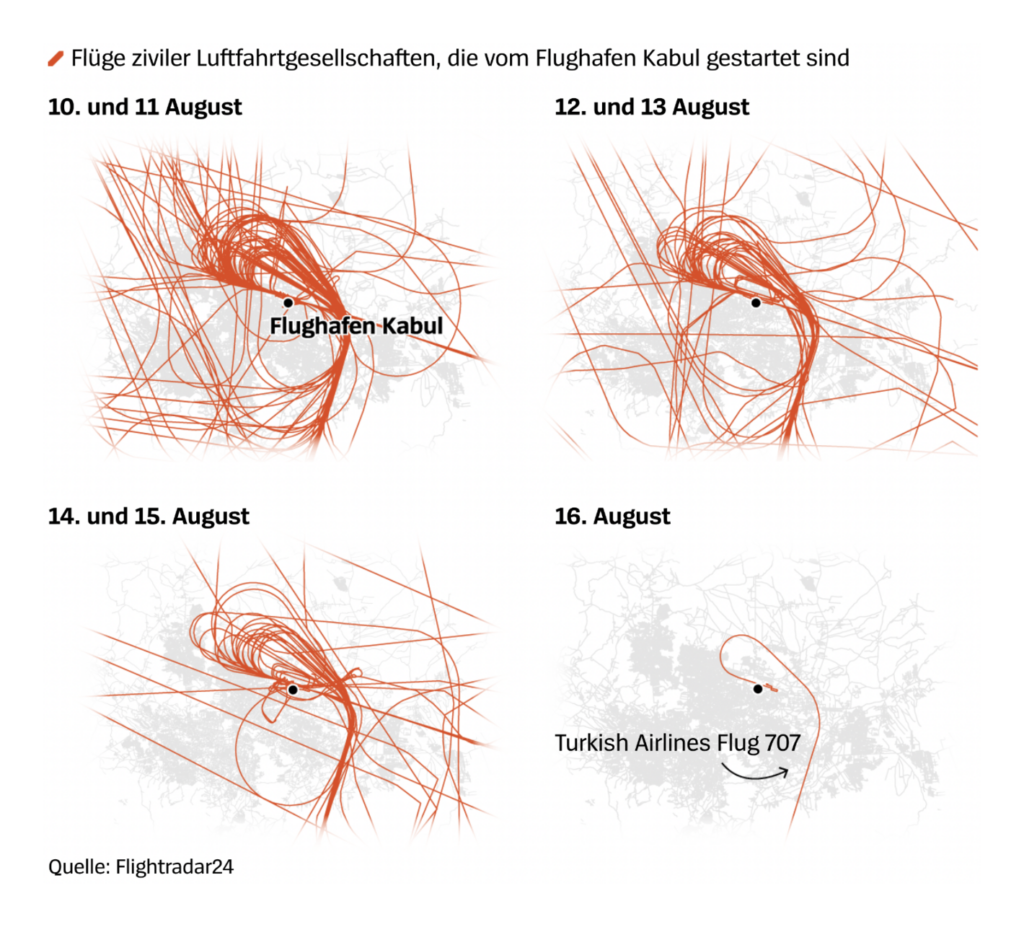
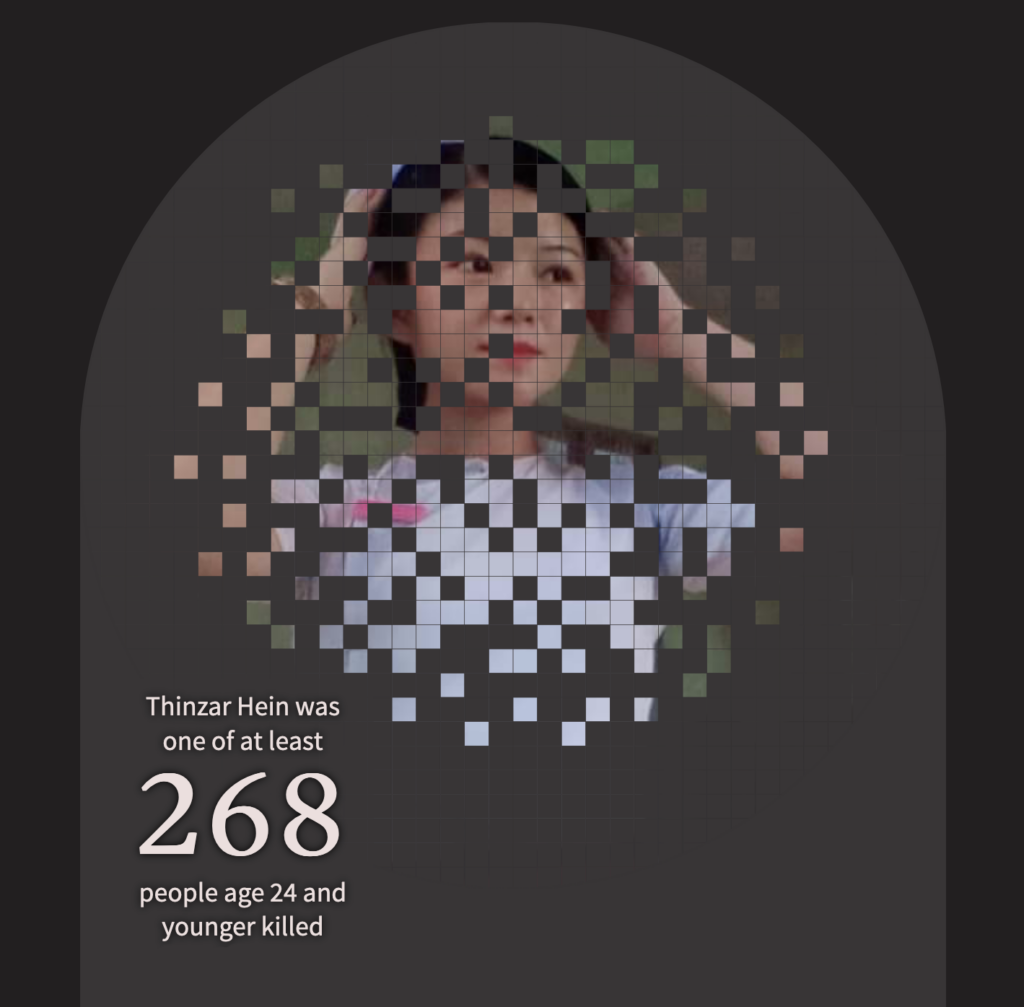
The situation in Afghanistan took another turn for the worse after a bombing at Kabul’s airport:

The Washington Post: Photos and videos reveal crowded checkpoints, chaos at Kabul airport on day of the attack, August 28
Reuters: Blast in Kabul, August 27
The Wall Street Journal: Kabul Airport Attack Roils Afghanistan Evacuation Efforts, August 26
Der Spiegel: Die Rettungsflüge am Himmel über Kabul, August 27

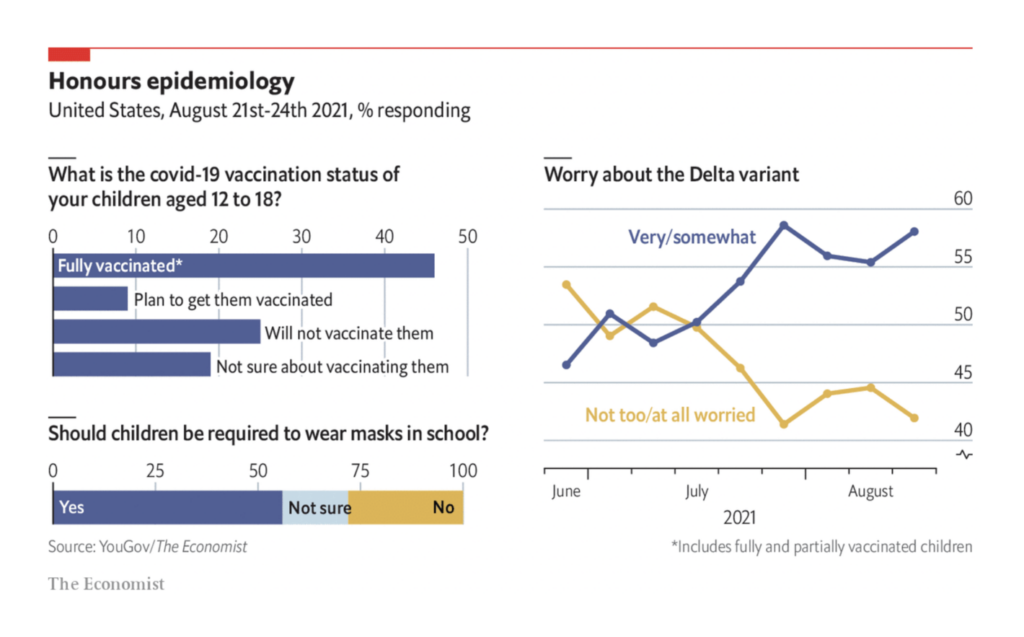
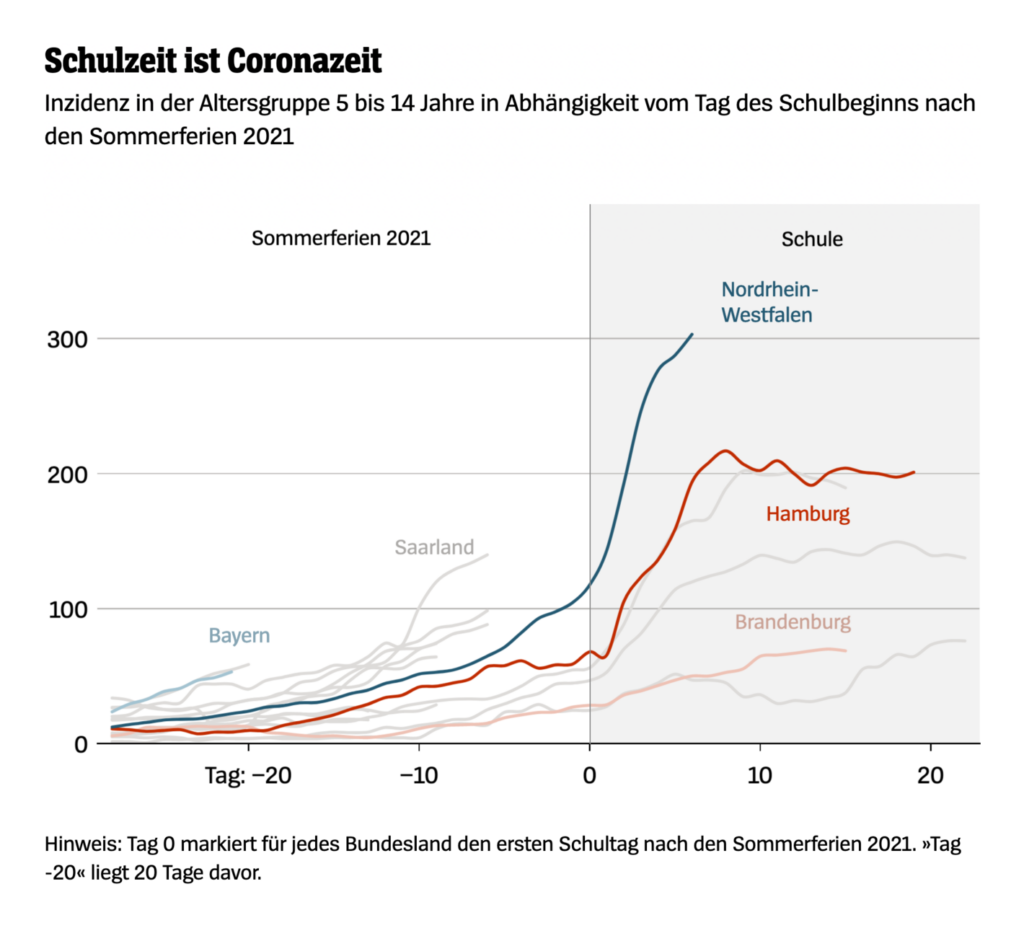
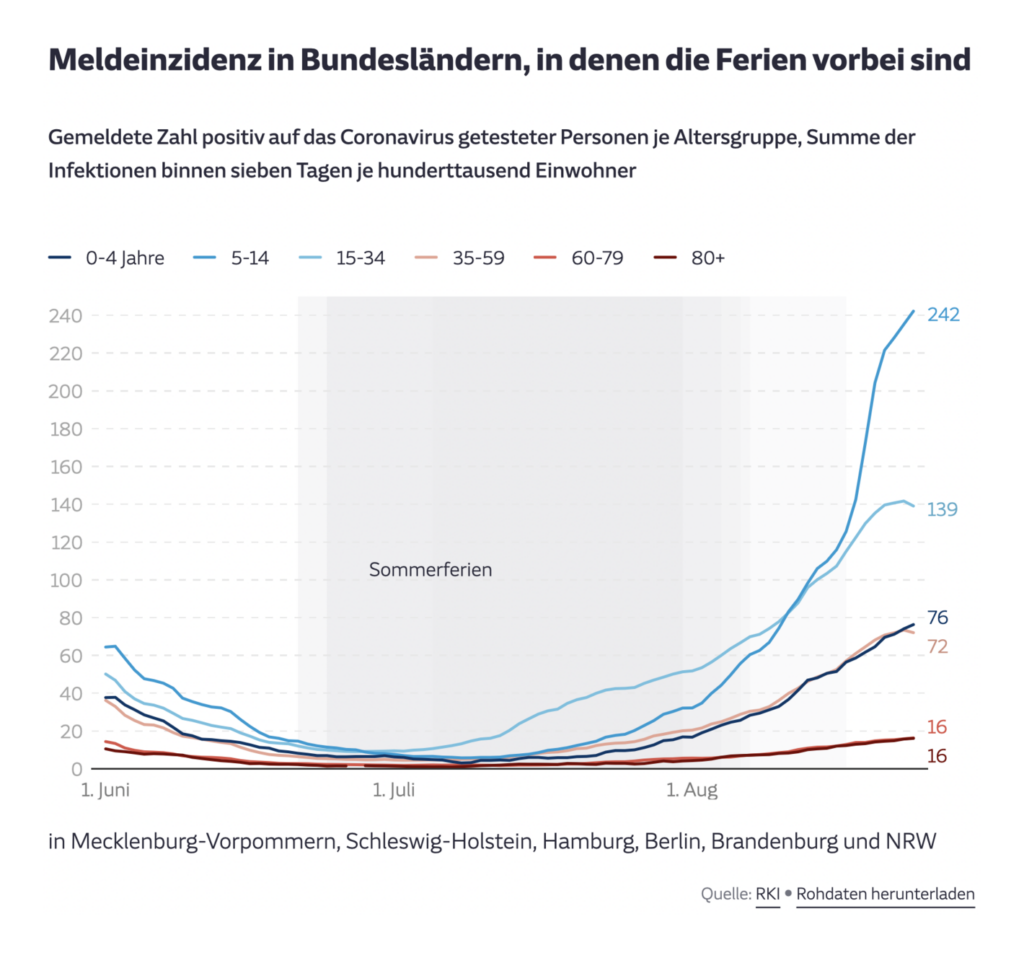
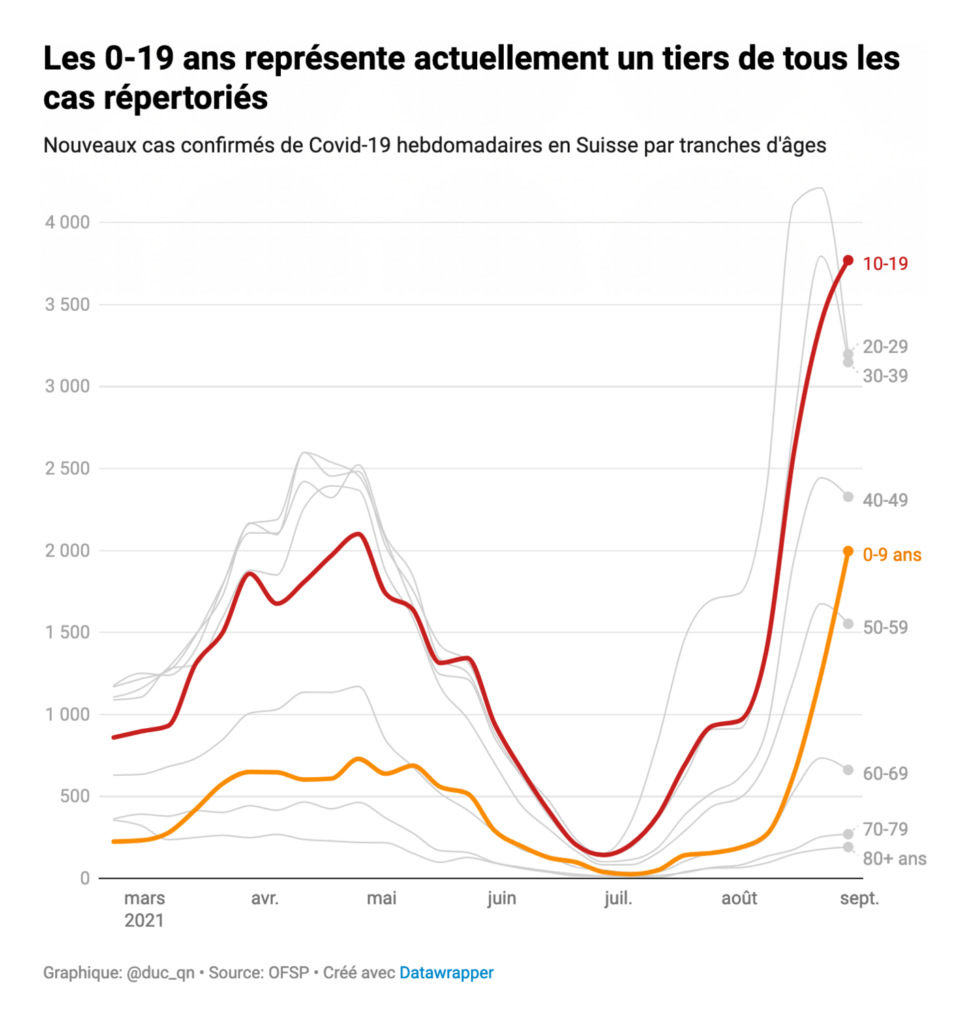
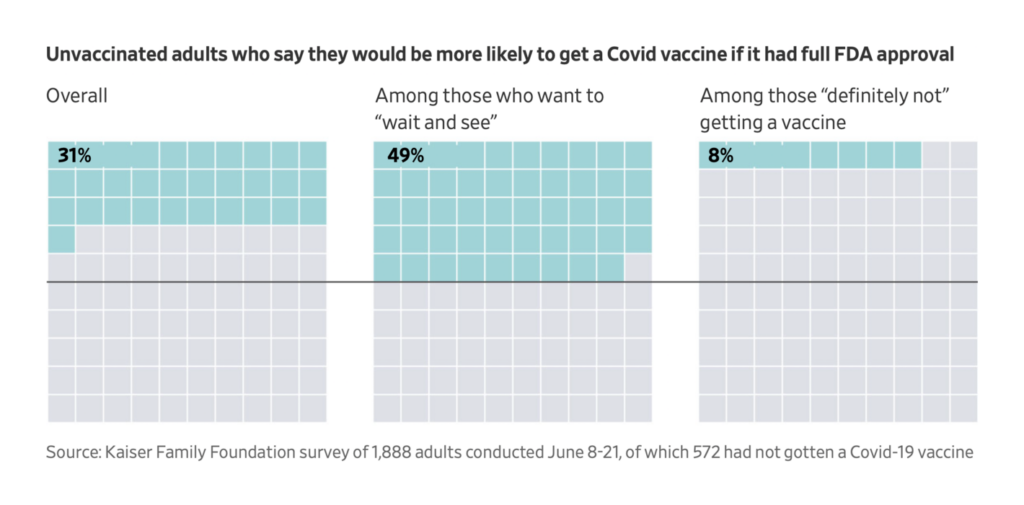
And there’s no denying it: COVID is back in many countries, and with it, lots of new charts. With many children still completely unvaccinated, the new school year is beginning in a state of anxiety:

The Economist: As American schools restart, worry about the Delta variant rises, August 26
Der Spiegel: Wo die hohen Inzidenzen zum Schulstart herkommen, August 28 (Tweet)
Süddeutsche Zeitung: Aus dem Urlaub in die vierte Welle, August 26
Le Temps: Variant Delta à l’école: quels risques pour les enfants?, August 30
The Washington Post: A Calif. elementary school teacher took off her mask for a read-aloud. Within days, half her class was positive for delta., August 28

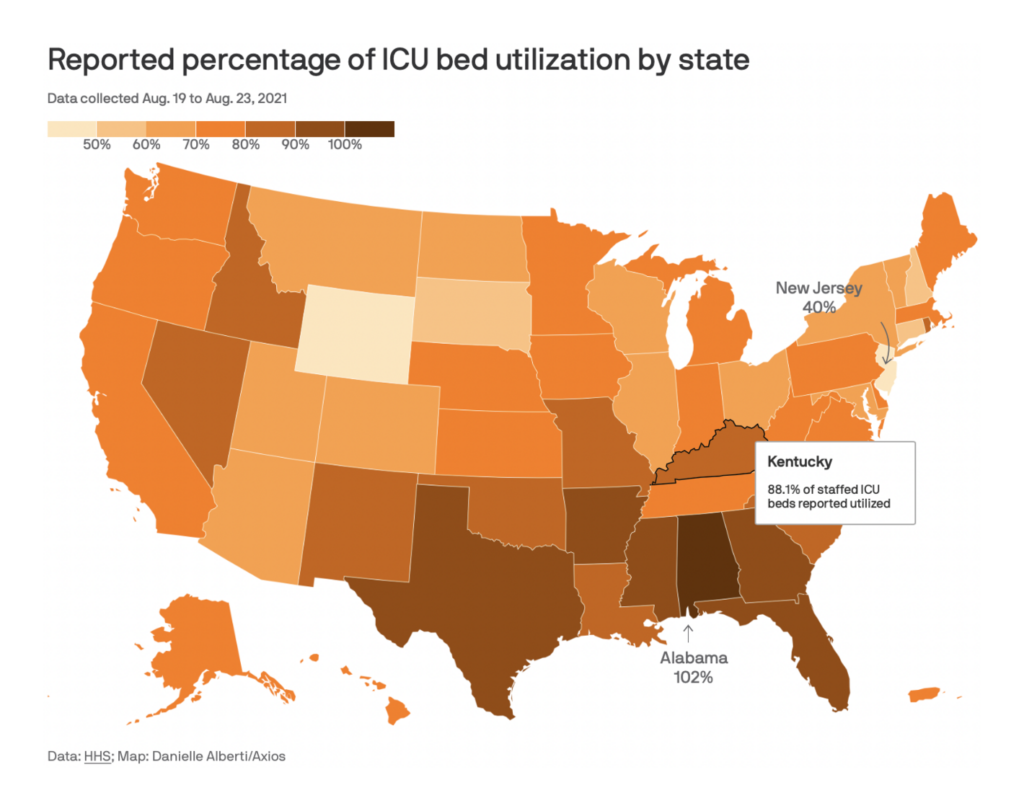
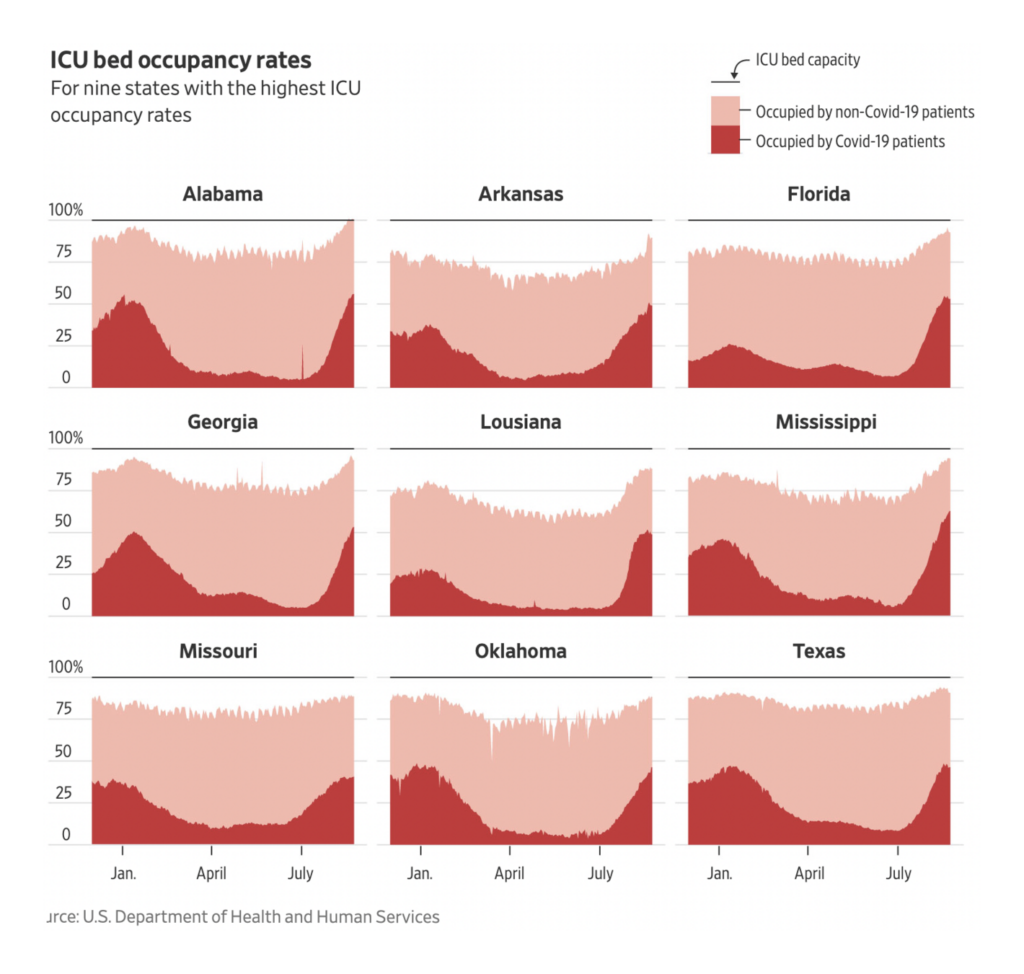
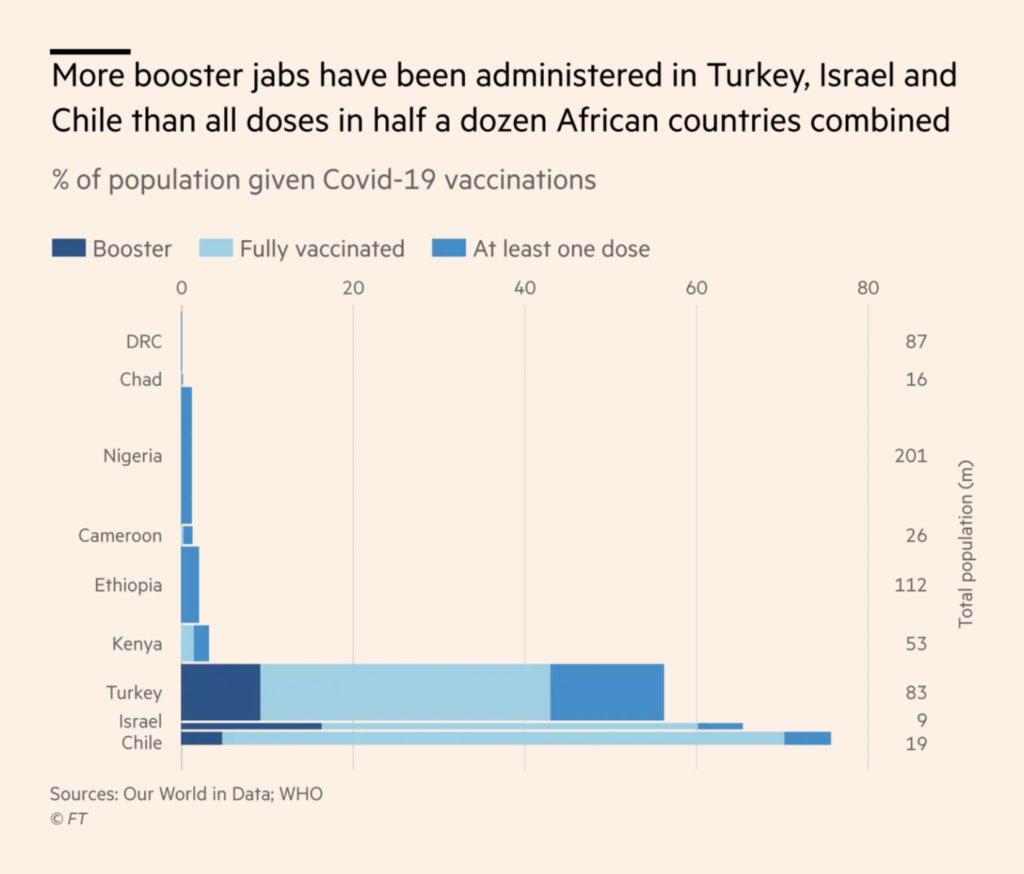
ICUs are filling up again, while most of the world waits for vaccines:

Axios: ICU beds are running out again, August 25
The Wall Street Journal: U.S. Covid-19 Hospitalizations Approach a Peak as Delta Variant Spreads, August 28
The New York Times: Where the Delta Wave Has Driven Up Covid-19 Vaccinations, August 26
The Wall Street Journal: Covid-19 Vaccinations Rise as Delta Variant Spreads, Pfizer Receives Full FDA Approval, August 25
Financial Times: Western states finalise Covid booster plans as developing world left behind, August 27

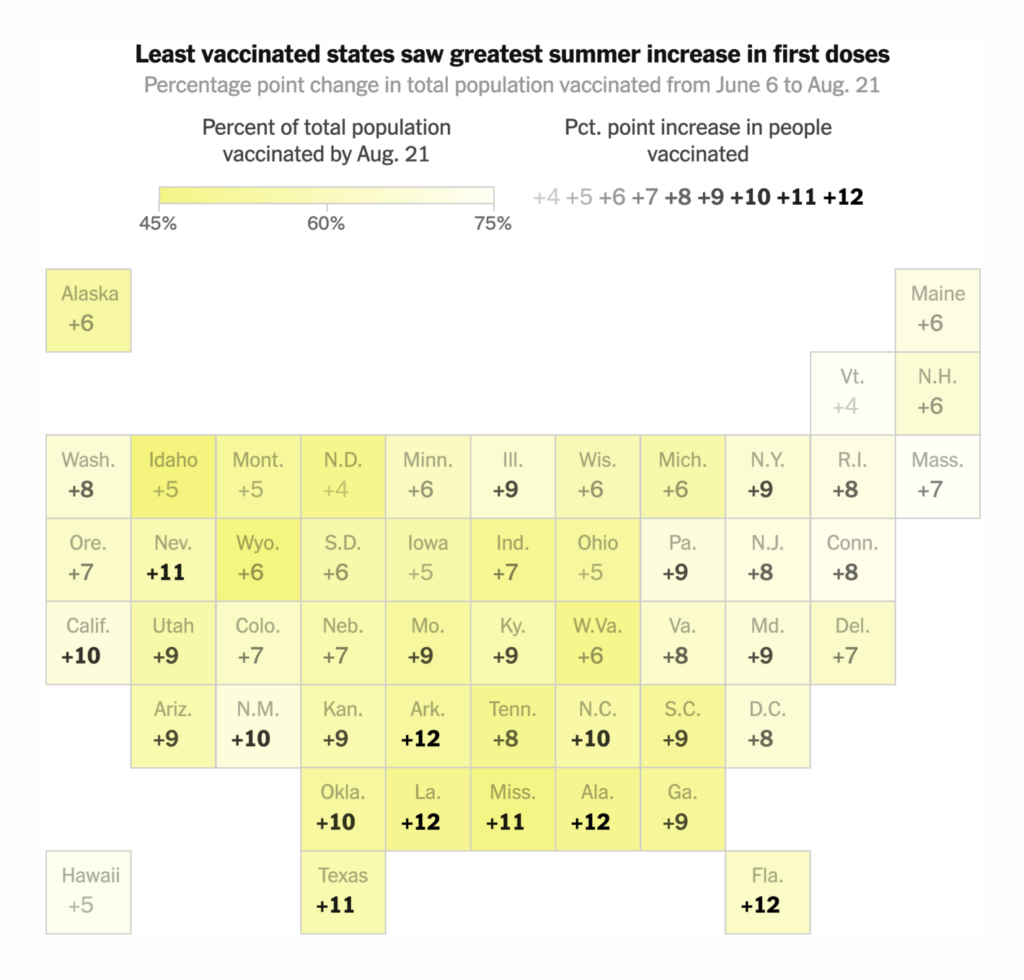
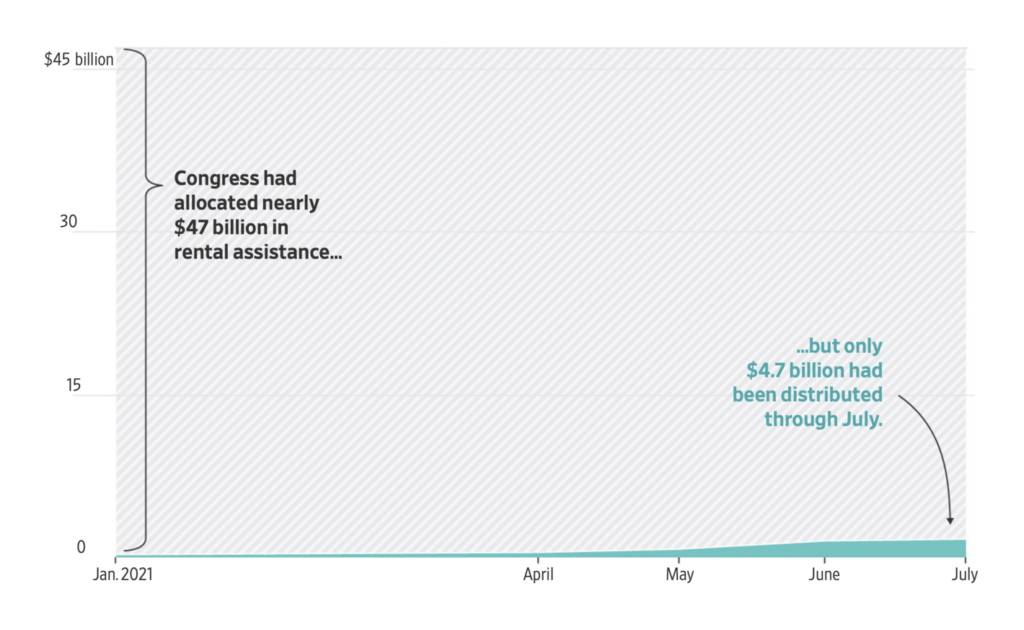
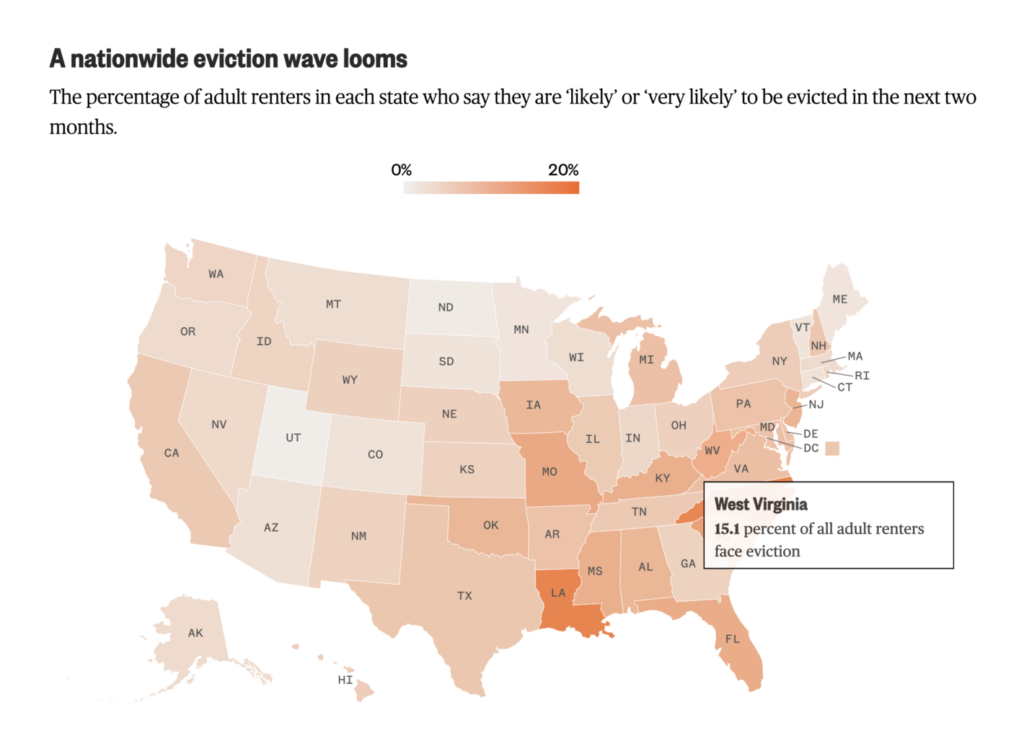
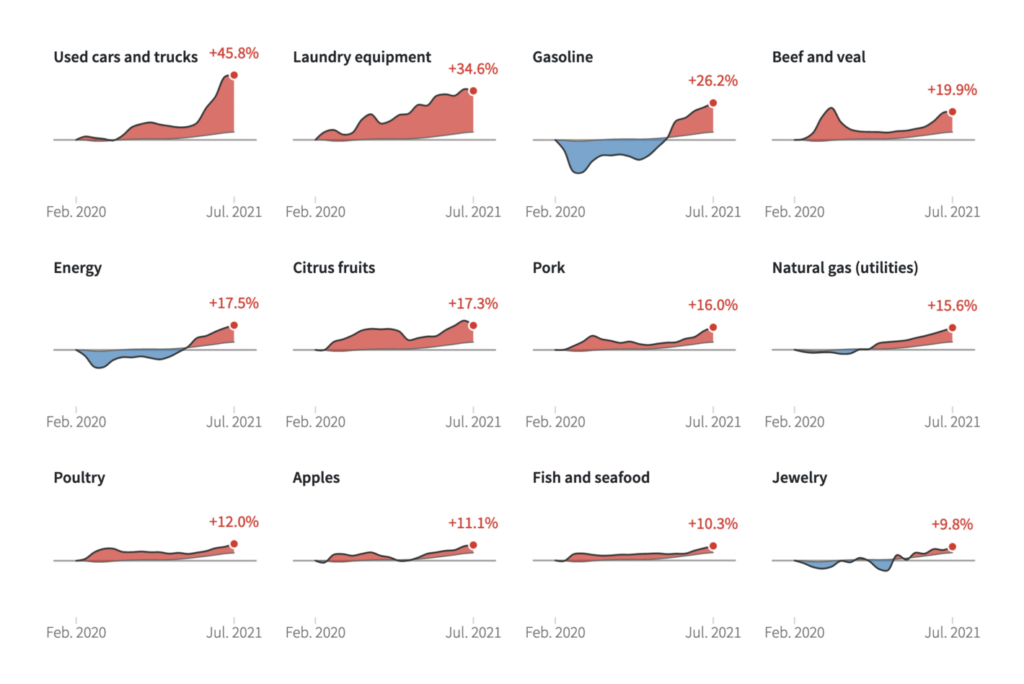
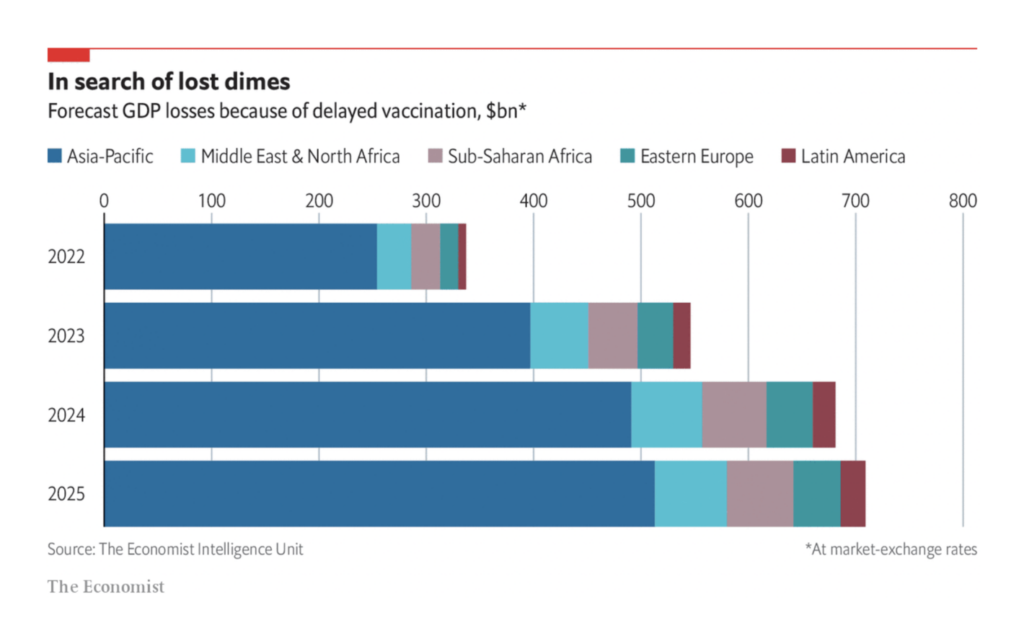
The social and economic disruptions of the pandemic promise to last long into the future:

The Wall Street Journal: A Fraction of Rental Assistance Has Reached the States With Eviction Moratorium Blocked, August 27
NBC: Here’s how many people could face evictions across the U.S., August 27
Bloomberg: London House Prices Surge in Places Where More People Go Hungry, August 27
Reuters: Prices are rising, but is it inflation?, August 26
The Wall Street Journal: How the Biggest Companies Have Fared During the Covid-19 Pandemic, August 29
The Economist: Vaccine inequality will cost money as well as lives, August 30

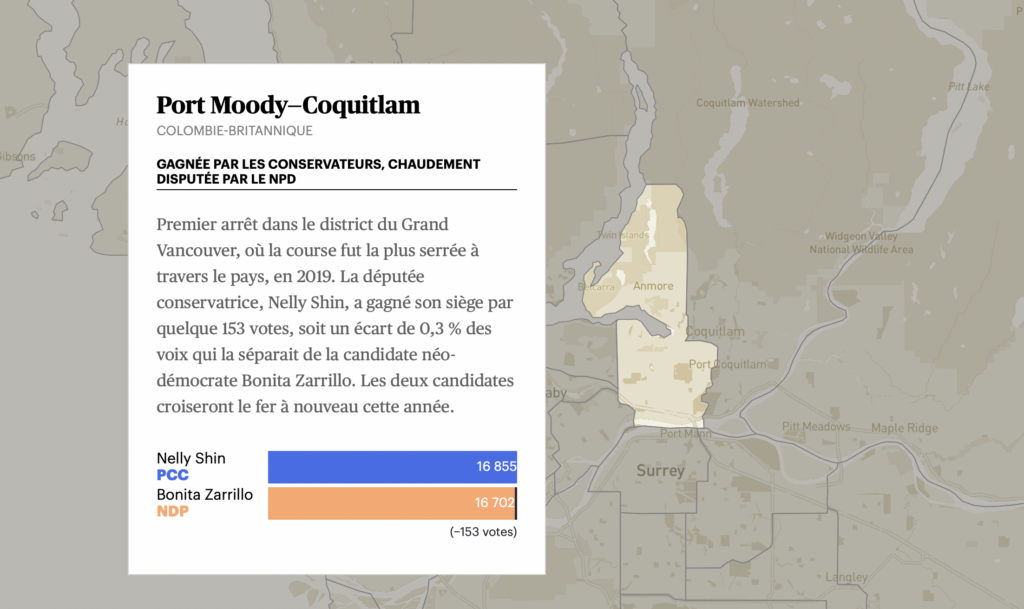
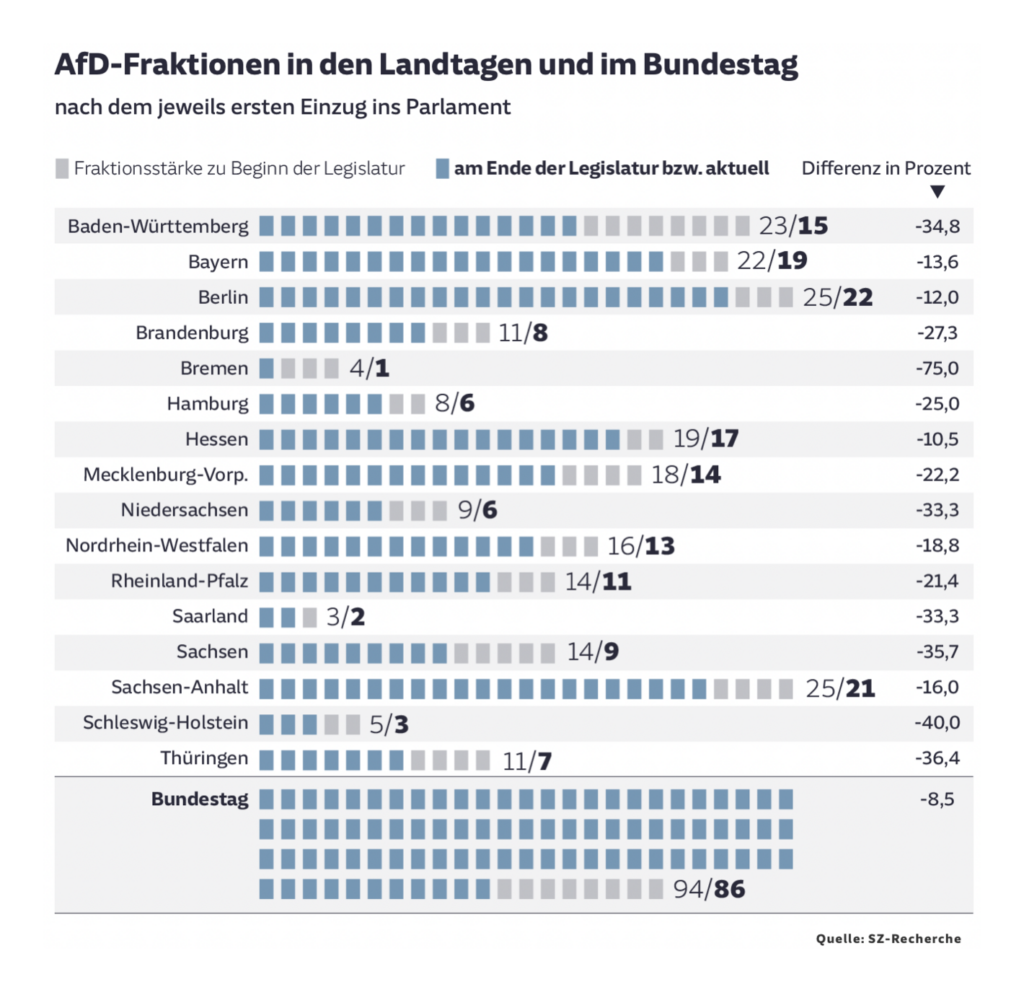
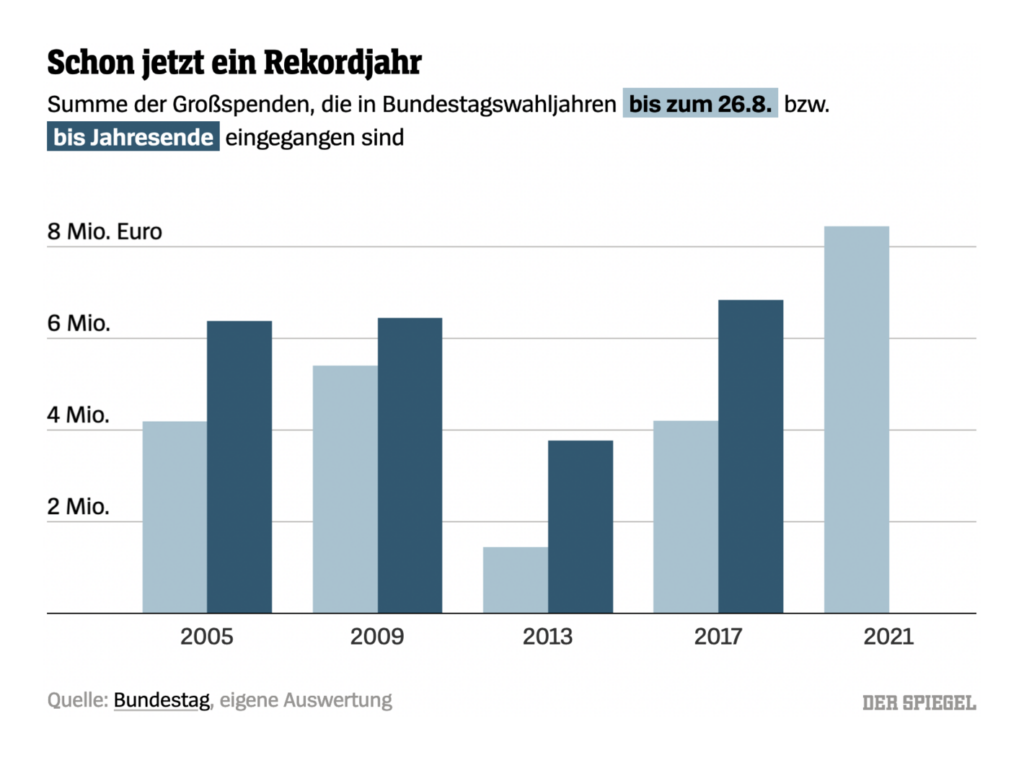
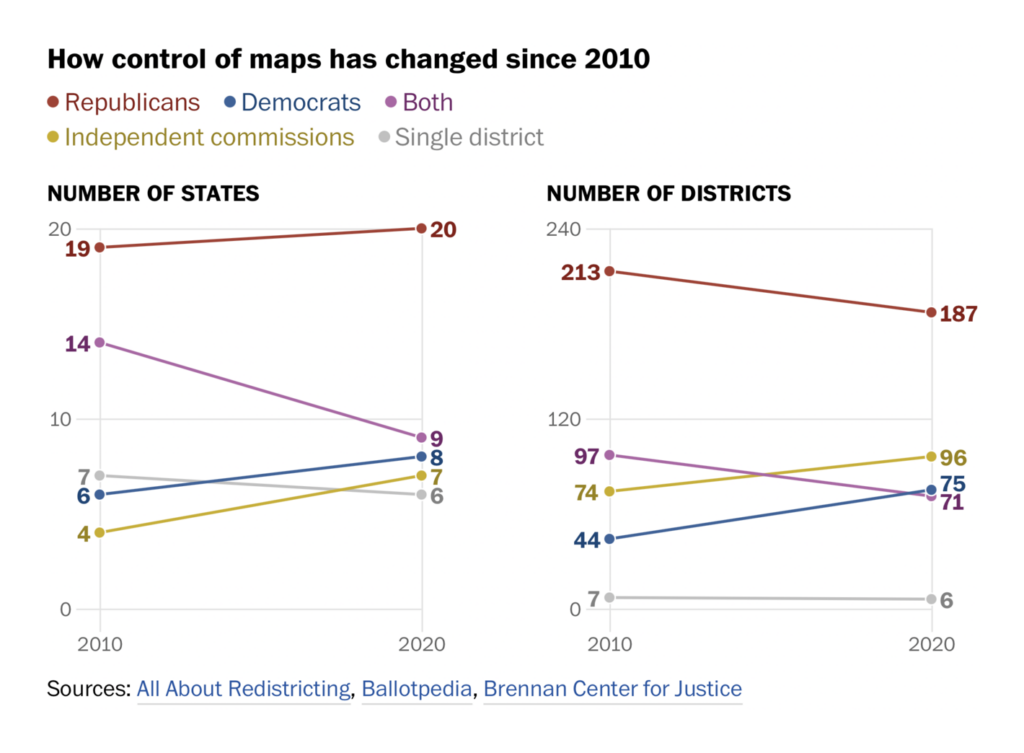
In elections news, Canada and Germany prepare for national votes while the U.S. begins its decennial redistricting:

Le Devoir: Où se joueront les élections fédérales ?, August 26
Süddeutsche Zeitung: Partei der vielen Brüche, August 27
Der Spiegel: Parteien verzeichnen Großspendenrekord, August 27
The Washington Post: How congressional redistricting works in your state, August 25

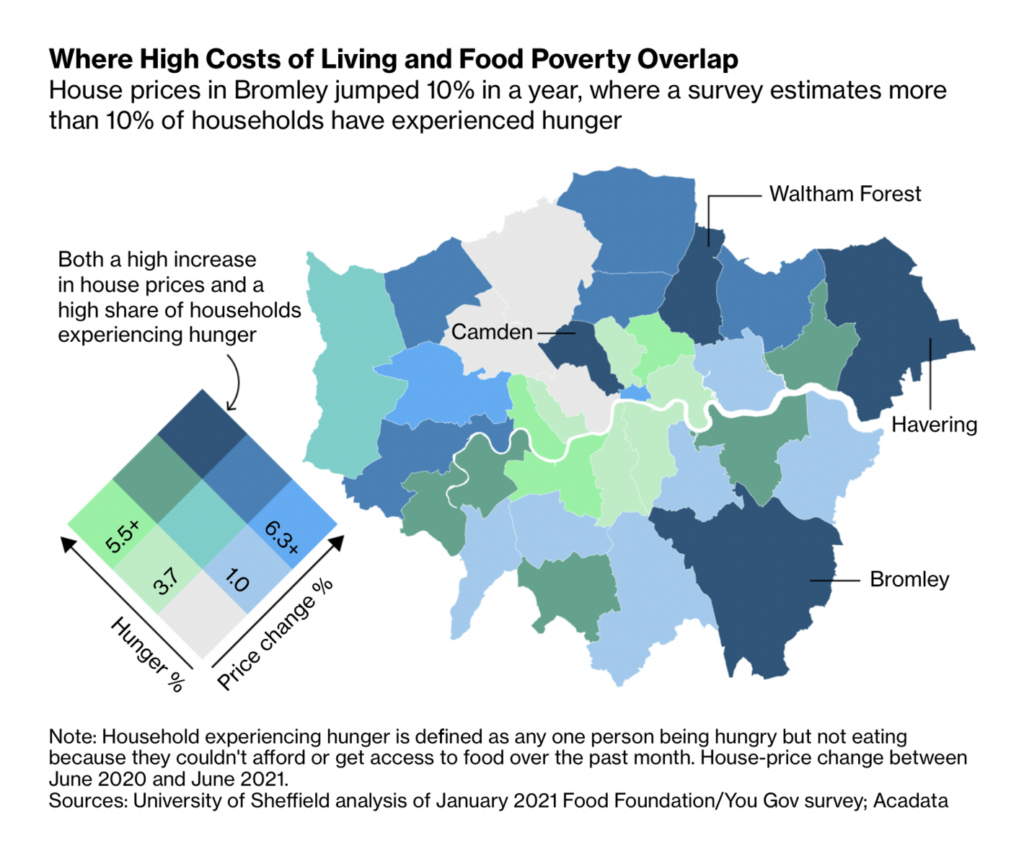
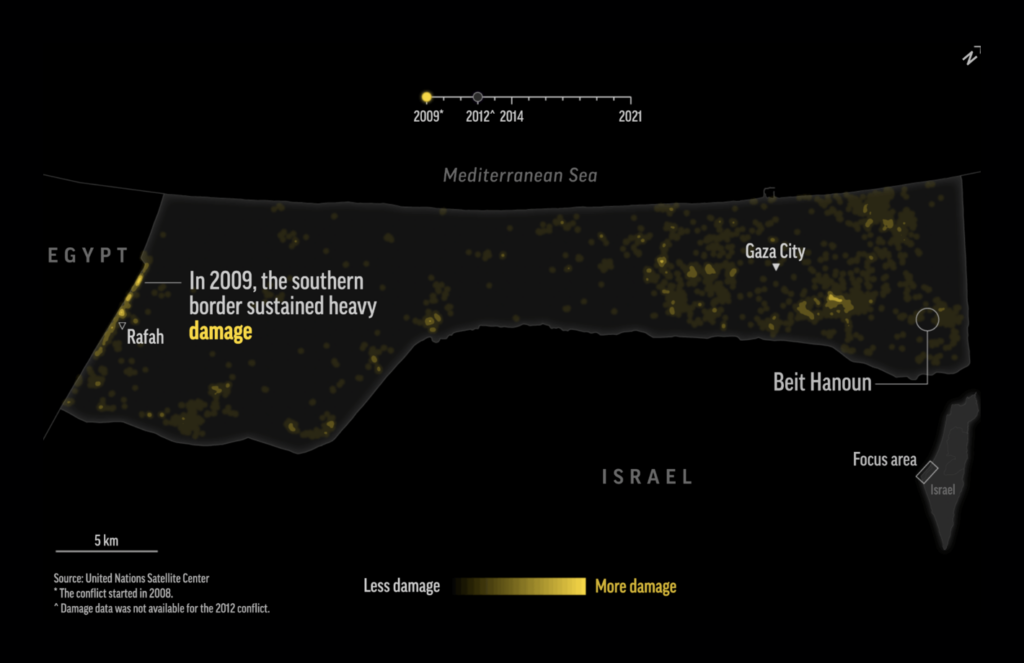
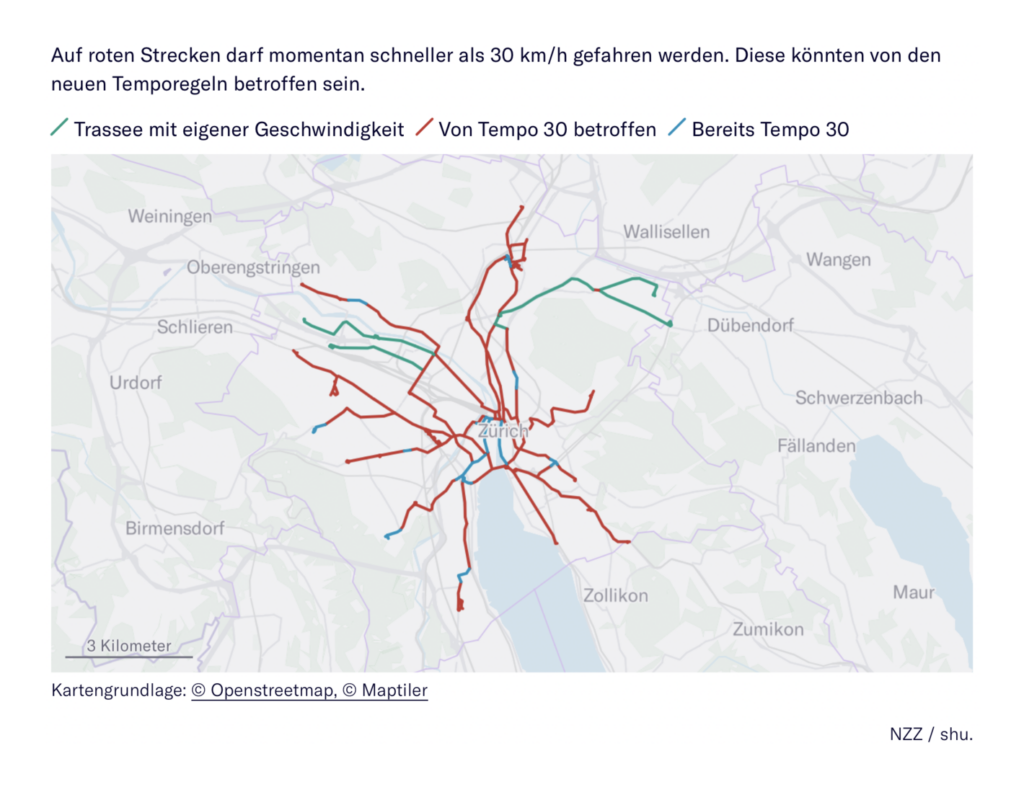
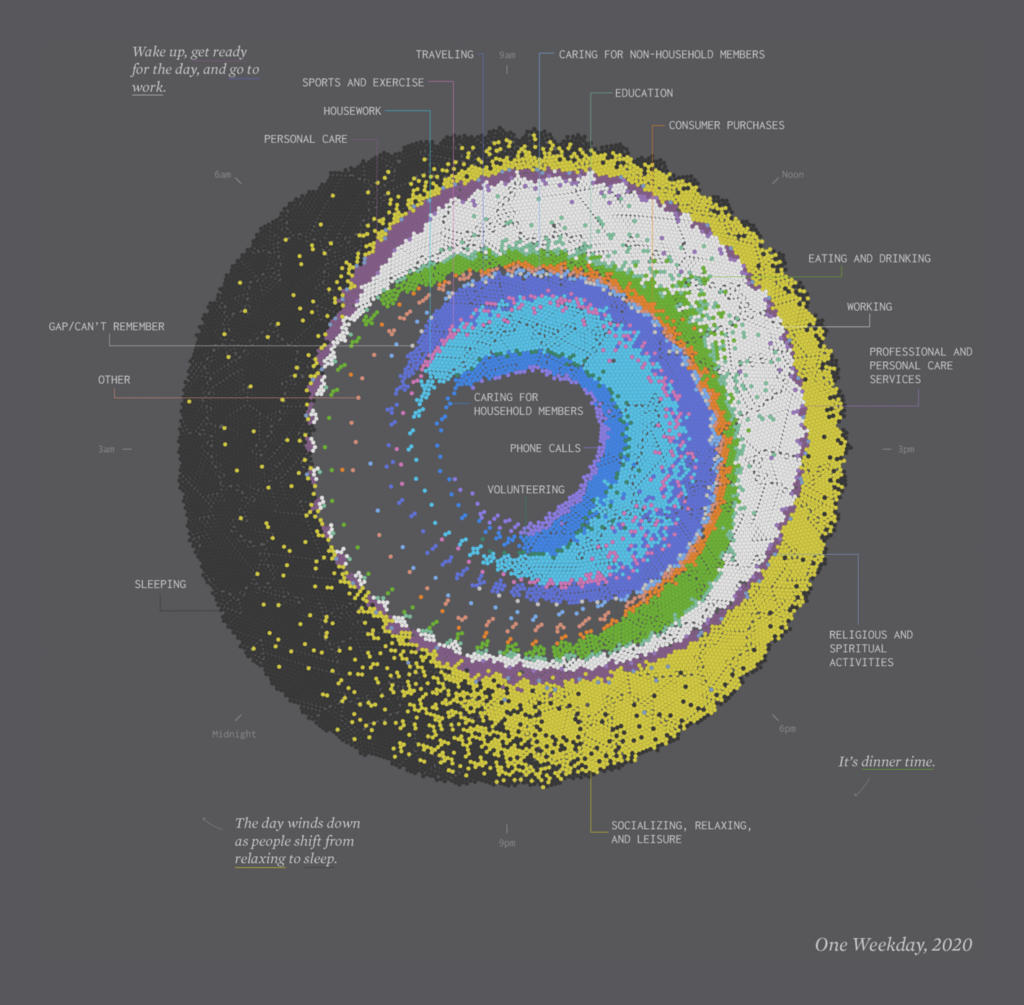
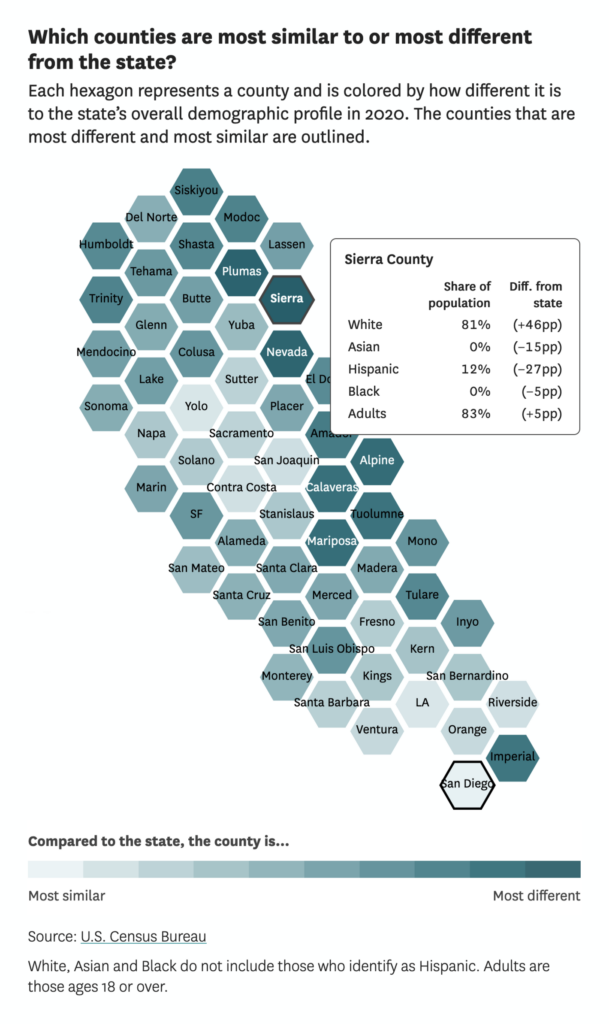
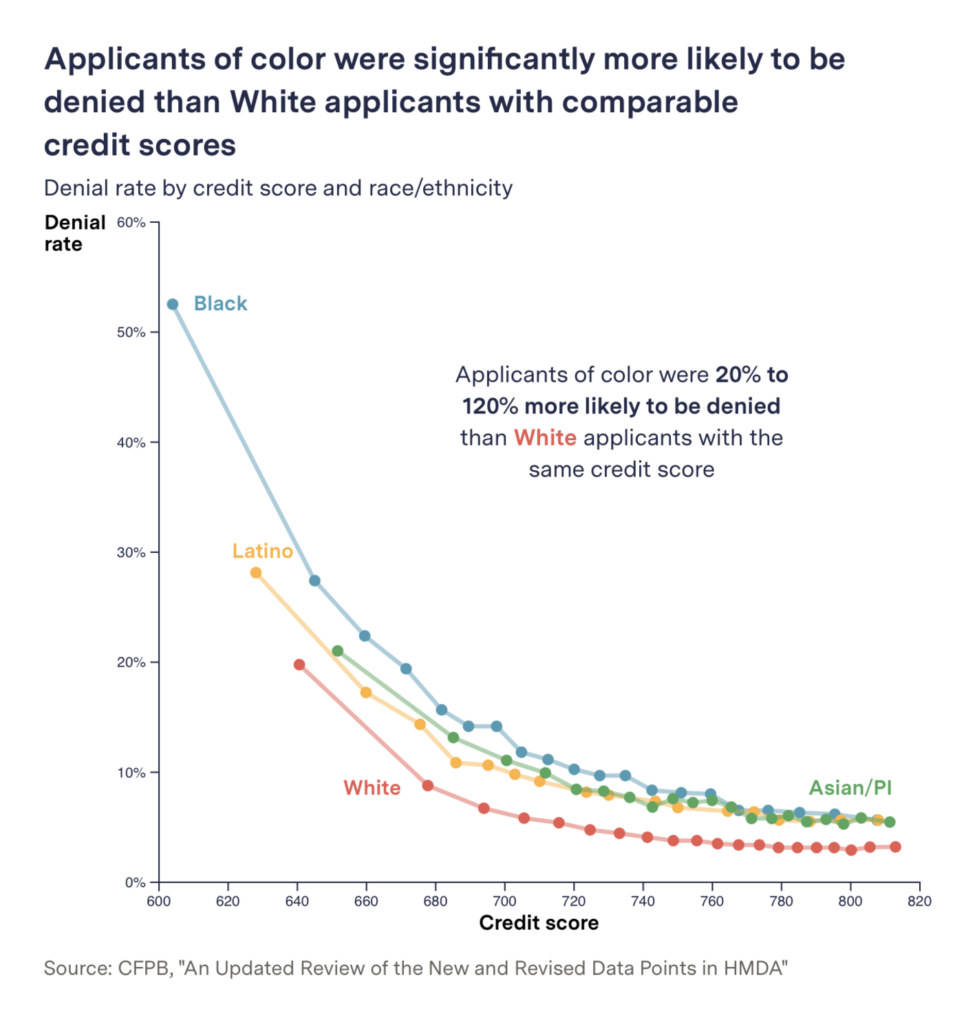
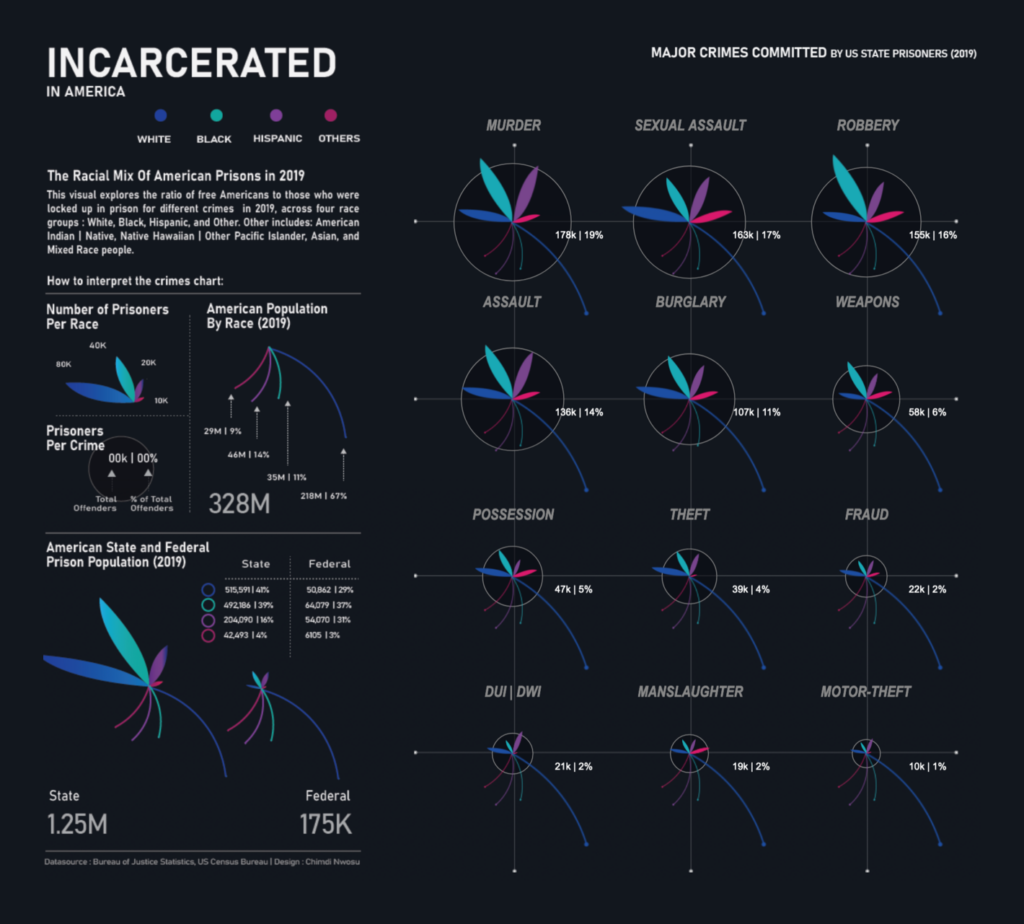
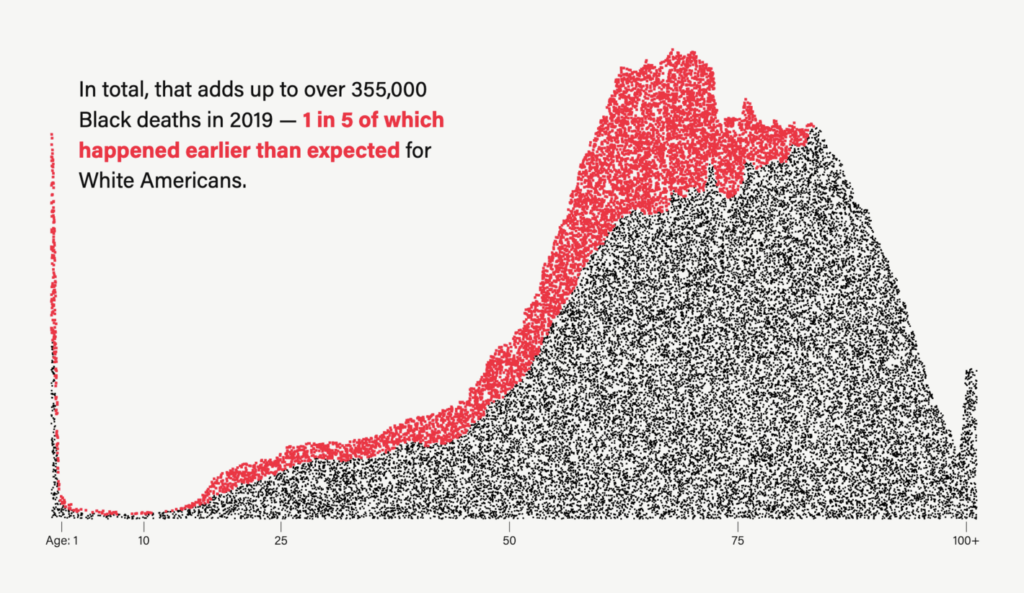
Maps this week covered damaged infrastructure in Gaza and transit in Zürich. Charts looked at racial disparities in the U.S. and how we’re spending our time each day:

The Associated Press: Gaza’s Toll, August 25
Neue Zürcher Zeitung: Ein Zeitverlust von 89 Sekunden kostet die Zürcher Steuerzahler 880 000 Franken – die Animation zeigt, wie sich Tempo 30 auf den öffentlichen Verkehr auswirkt, August 29
Nathan Yau: Cycle of Many, a 24-hour snapshot for a day in the life of Americans, August 25
San Francisco Chronicle: What’s the most California county in California?, August 29
The Markup: The Secret Bias Hidden in Mortgage-Approval Algorithms, August 25
Chimdi Nwosu: Incarcerated in America: The Racial Mix of Prisons in 2019, August 30 (Tweet)
The Marshall Project: The Black Mortality Gap, and a Century-Old Document, August 30

What else we found interesting

Reuters: Protest drove a generation to Myanmar’s streets. Military crackdowns sent hundreds to their deaths, August 27
Neue Zürcher Zeitung: Ihr Kleid war kurz. Sie fragte sich, ob es zu einladend gewirkt hatte, August 24
The Pudding: How You Play Spades is How You Play Life, August 30

Help us make this dispatch better! We’d love to hear which newsletters, blogs, or social media accounts we need to follow to learn about interesting projects, especially from less-covered parts of the world (Asia, South America, Africa). Write us at hello@datawrapper.de or leave a comment below.

Comments