We want to enable everyone to create beautiful charts, maps, and tables. New to data visualization? Or do you have specific questions about us? You'll find all the answers here.
The best of last week’s big and small data visualizations
Vivien Serve
Welcome back to the 172nd edition of the Data Vis Dispatch! Every week, we publish a collection of the best small and large data visualizations we find, especially from news organizations — to celebrate data journalism, data visualization, simple charts, elaborate maps, and their creators.
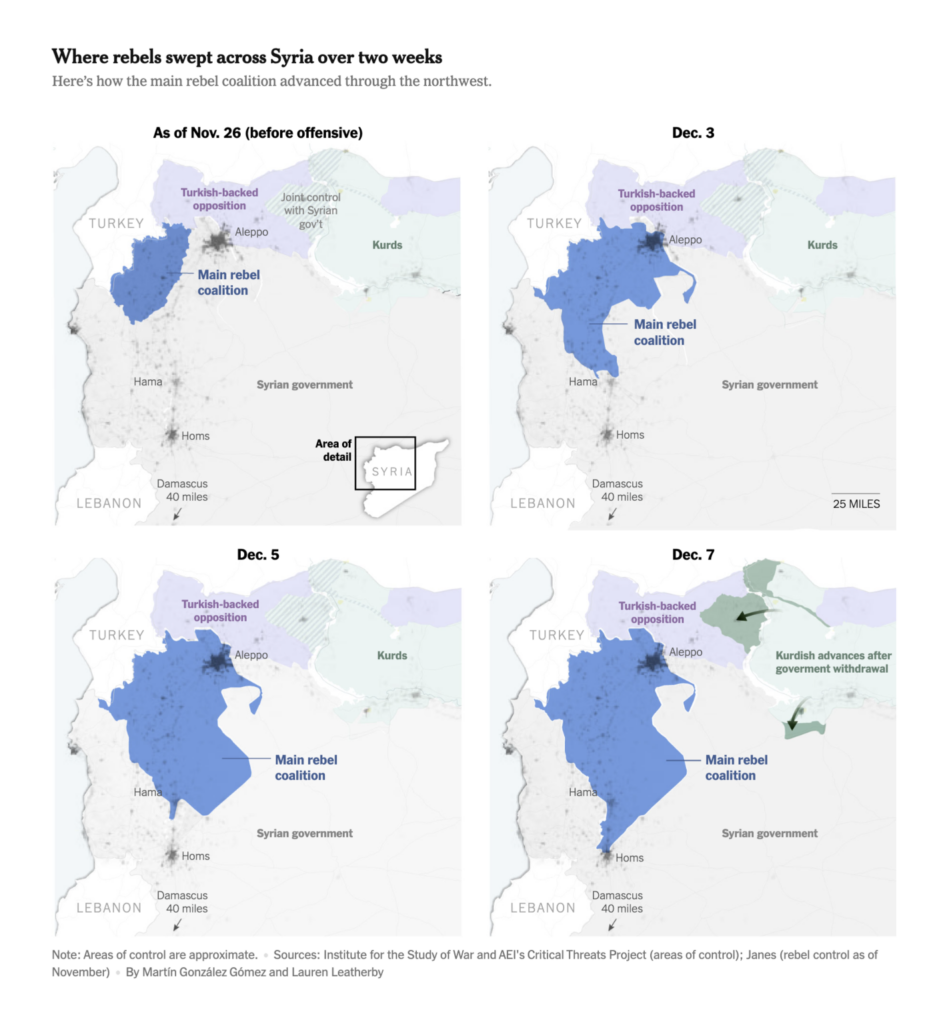
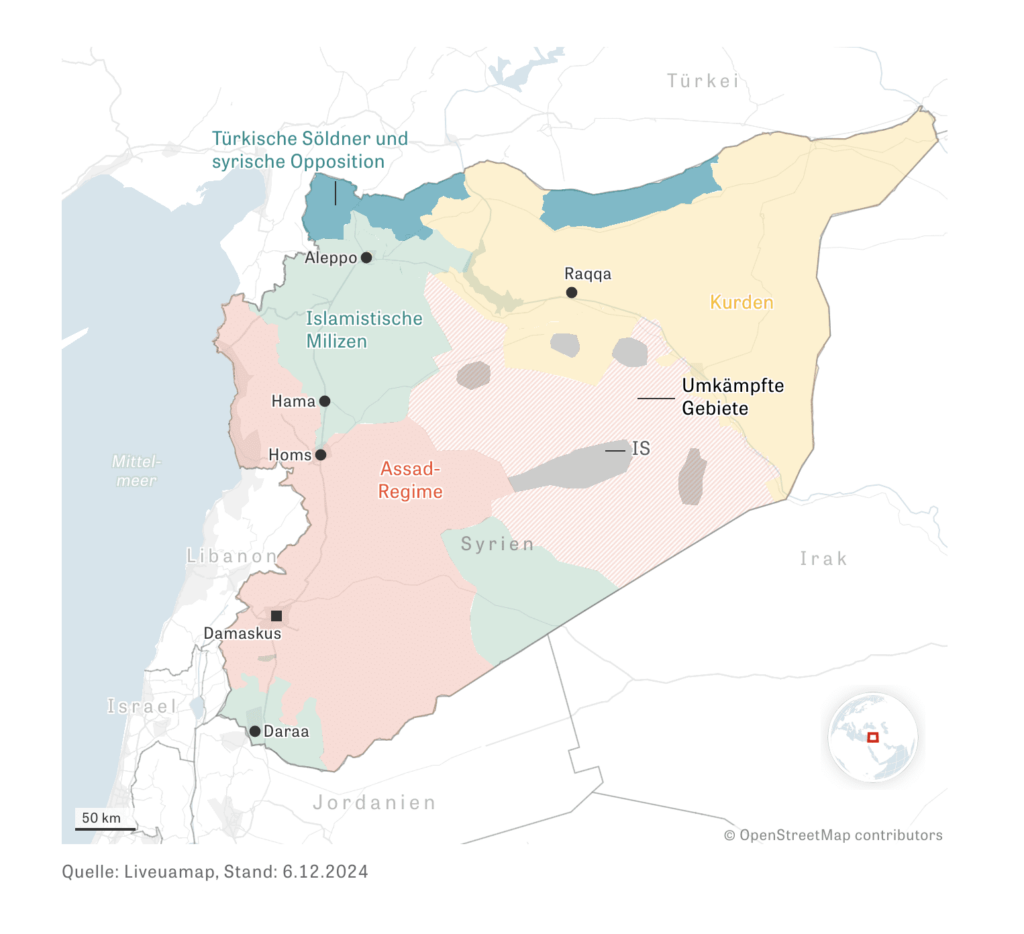
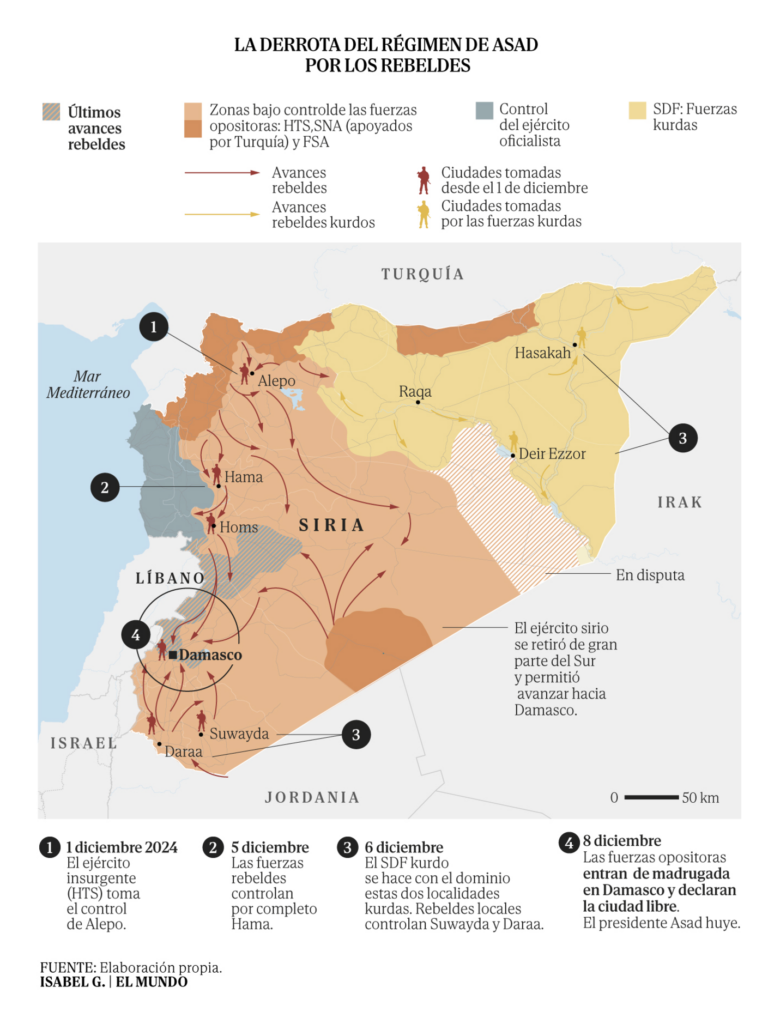
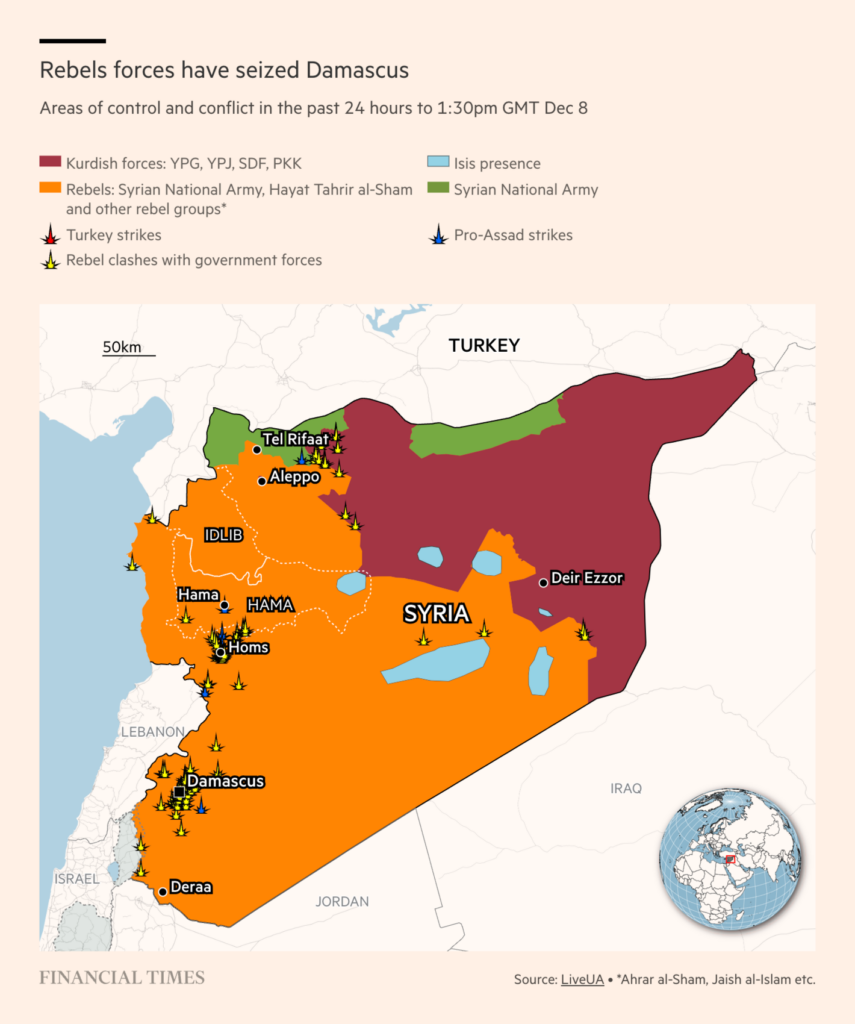
Recurring topics this week include the reconstruction of Notre Dame, fall of the Assad regime in Syria, and sports all over the world.
After a massive fire in 2019 and an intensive five-year rebuilding effort, the cathedral of Notre-Dame de Paris reopened to the public last week:
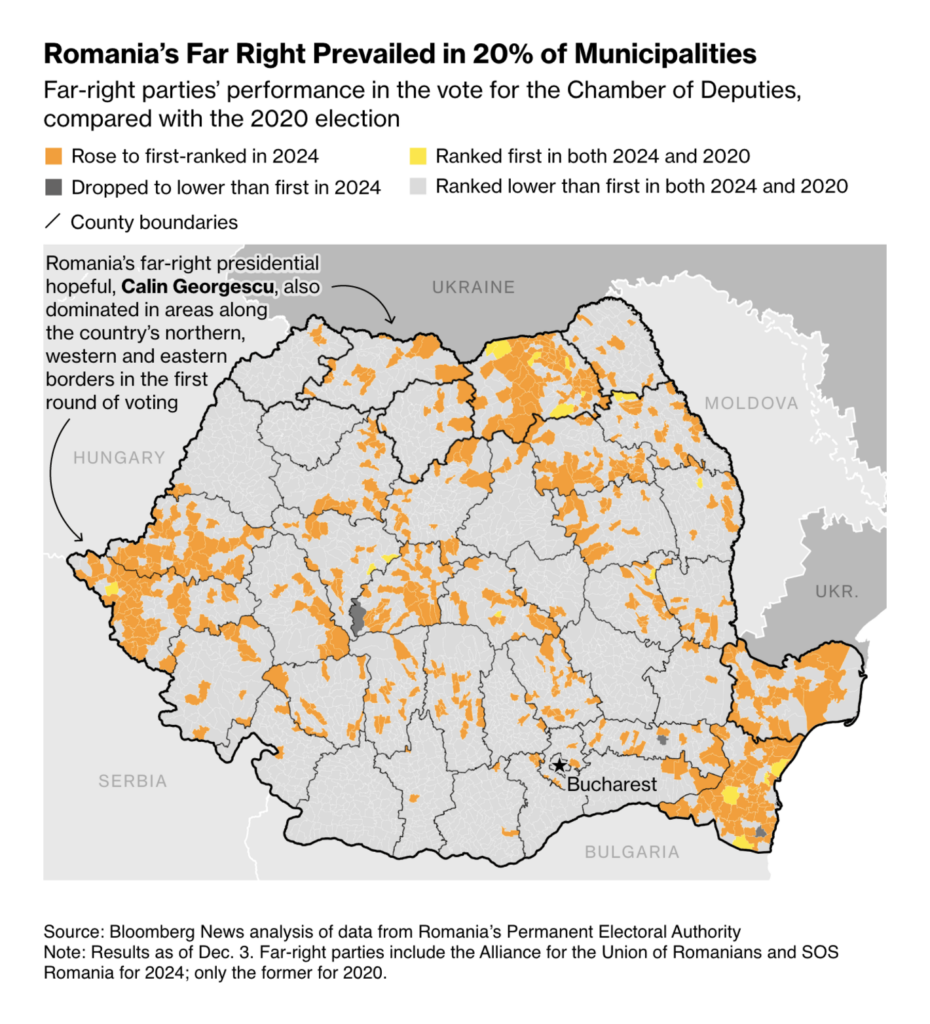
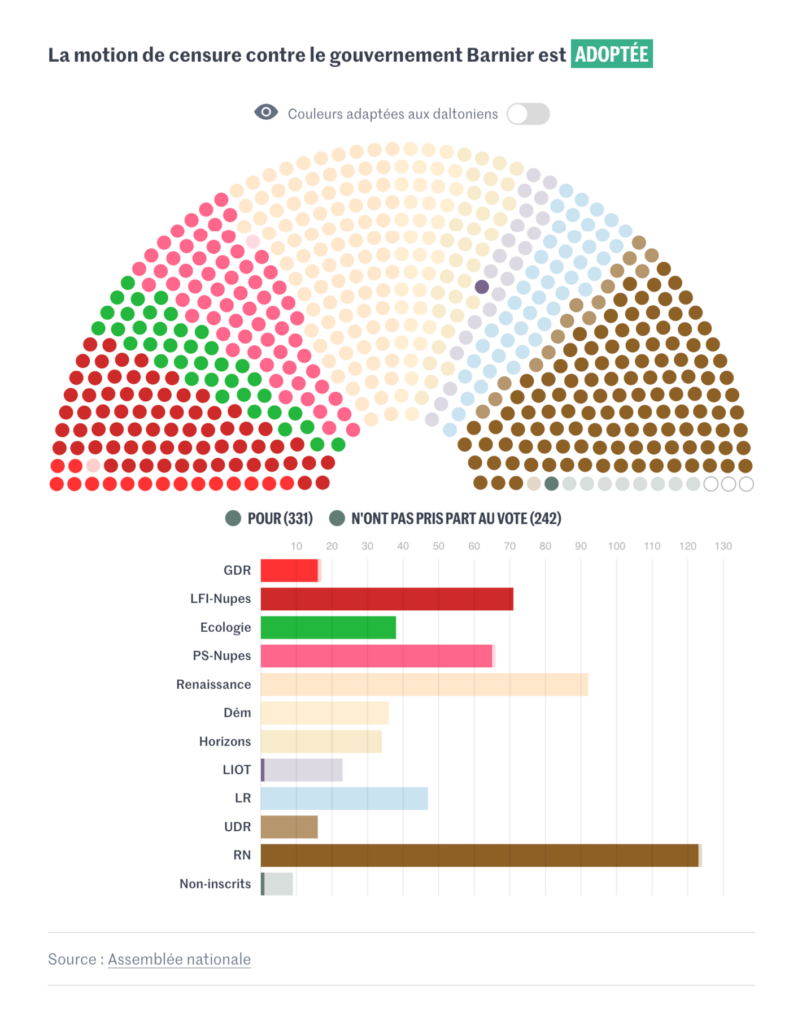
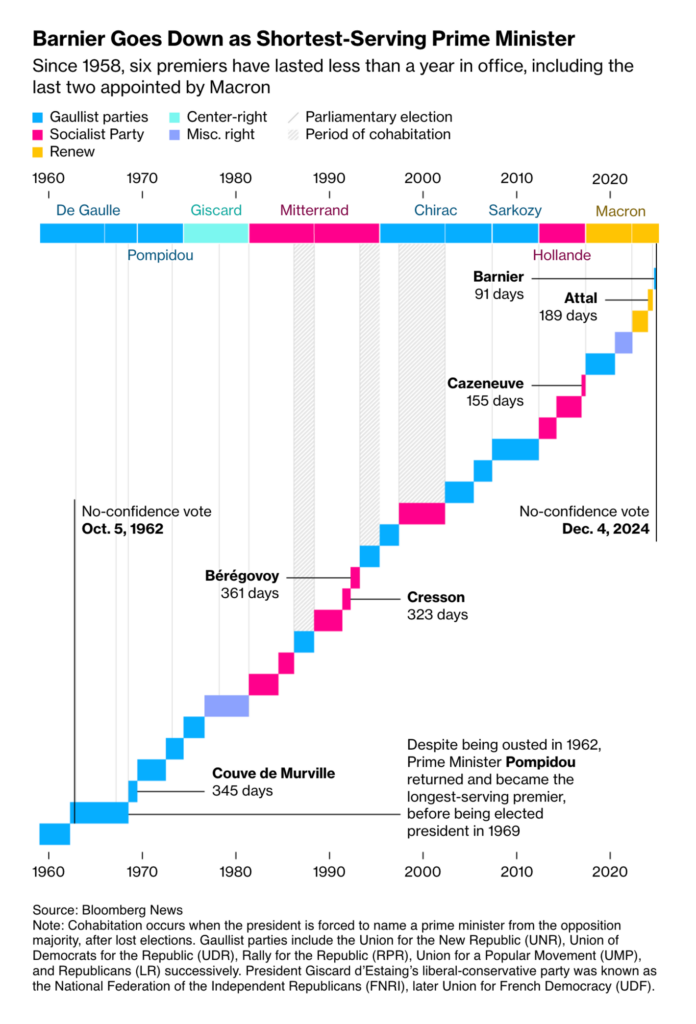
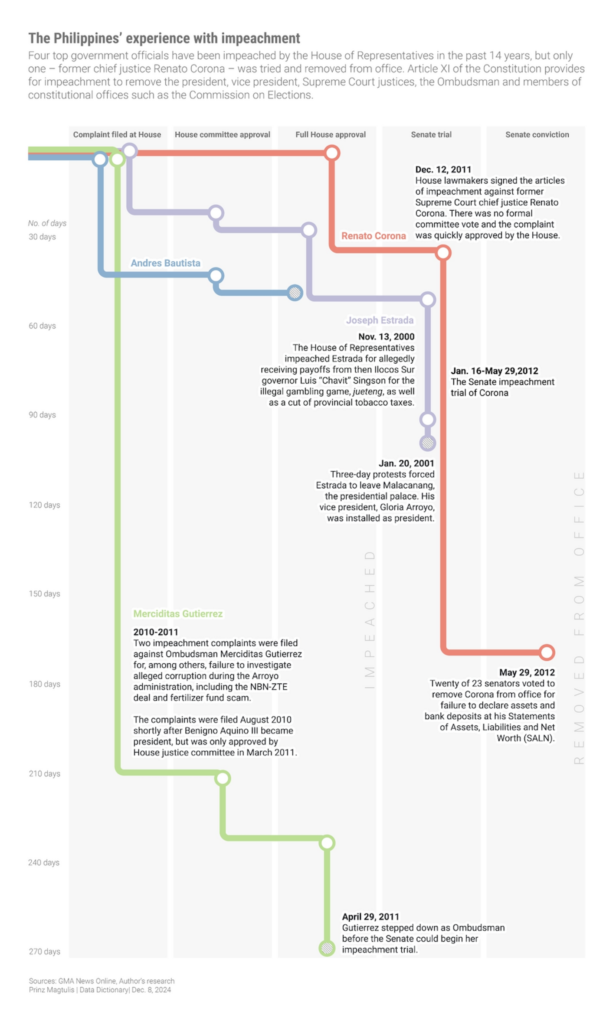
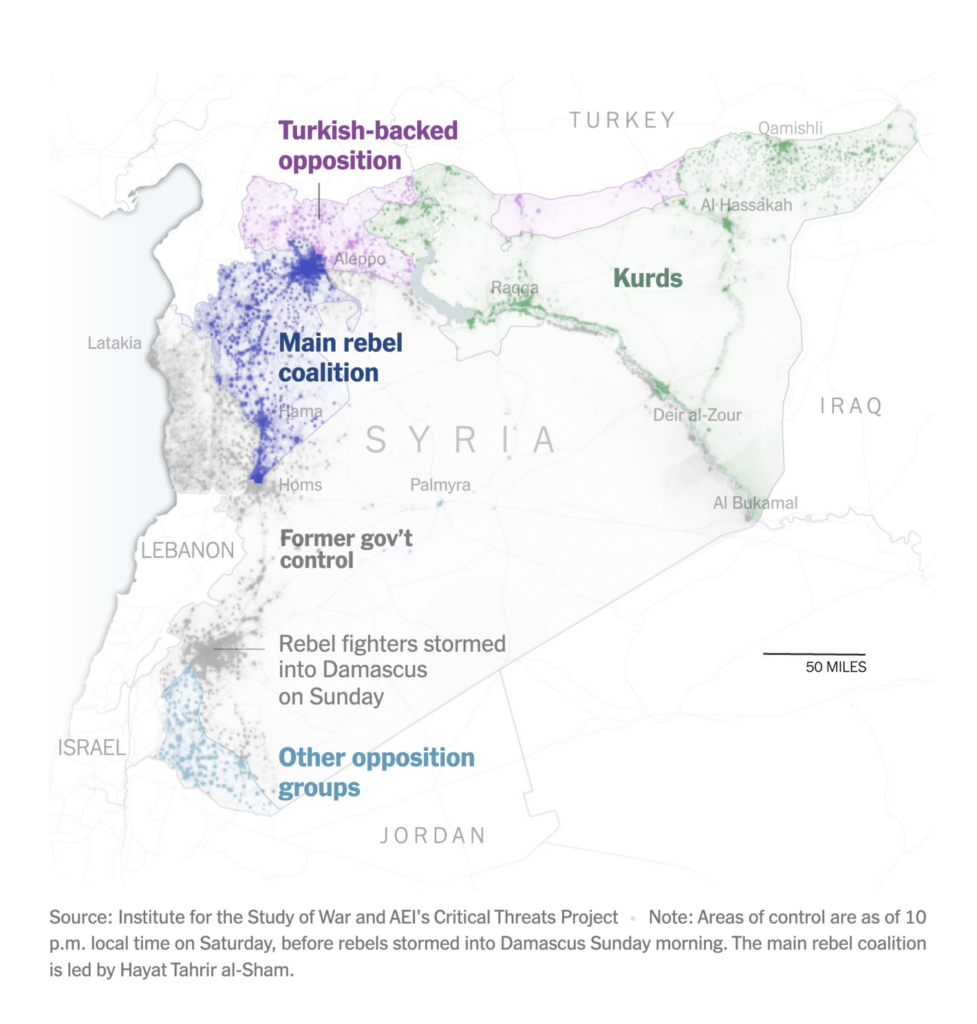
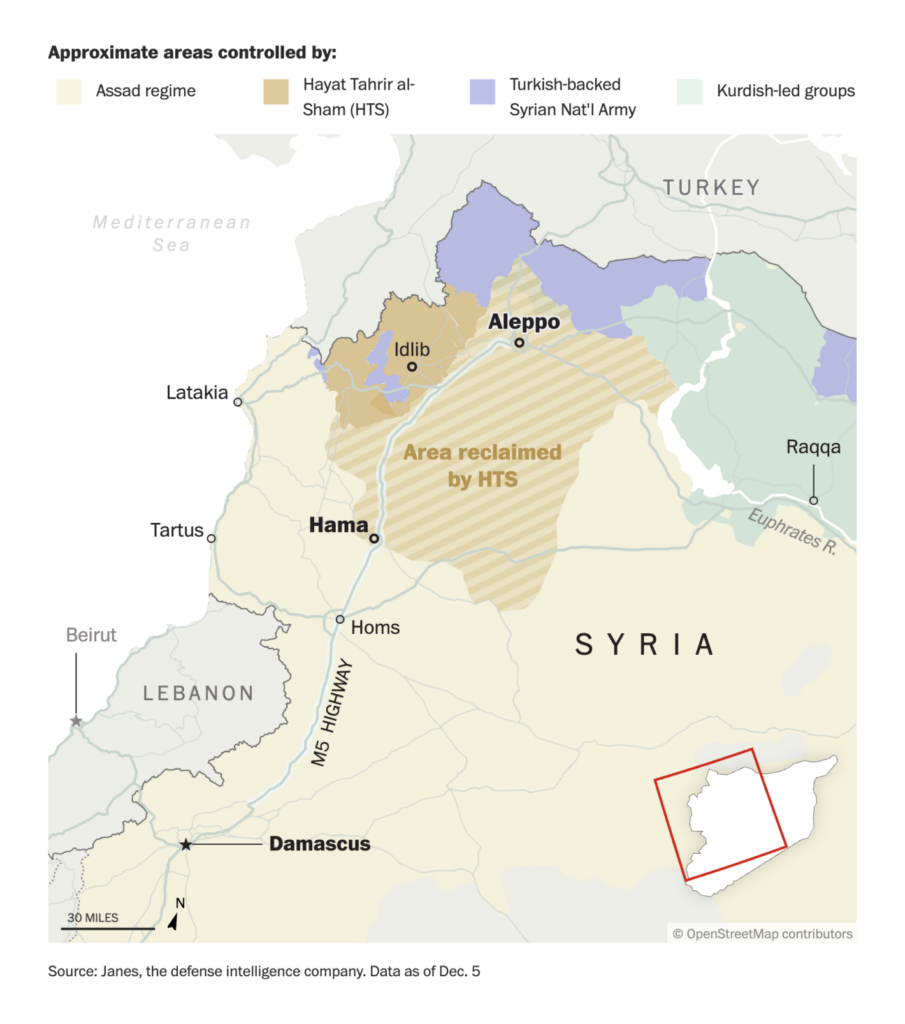
We could call the next set of political visualizations “failed governments” — from France, where the Bernier government fell to a no-confidence vote; to South Korea, where President Yoon faces suspension; to the Philippines, where impeachment proceedings target Vice President Sara Duterte:
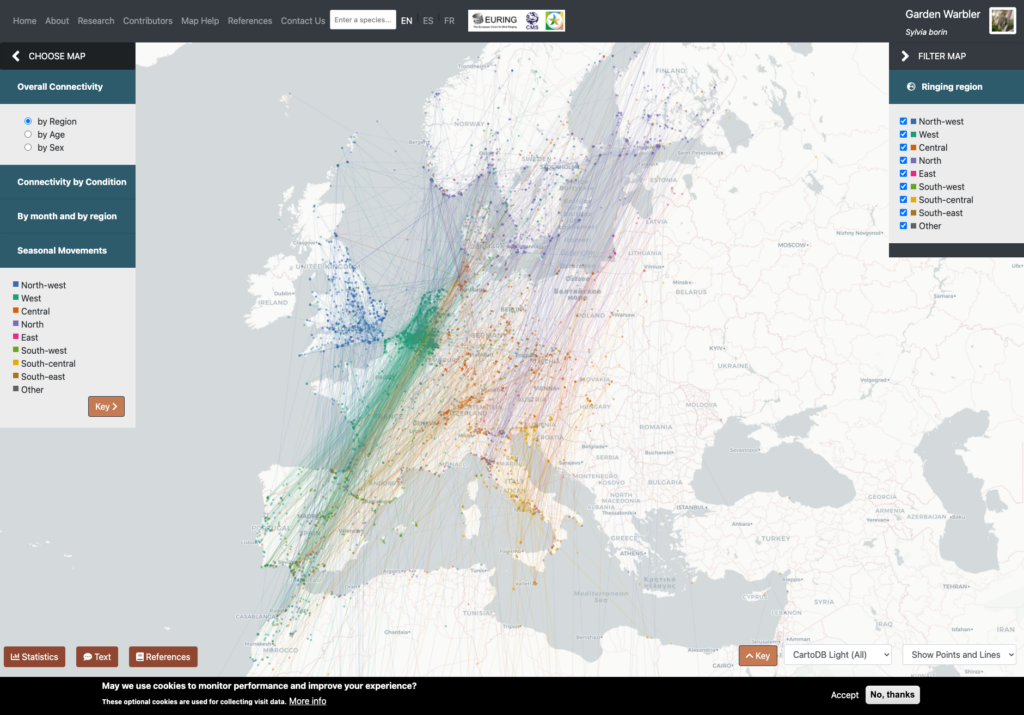
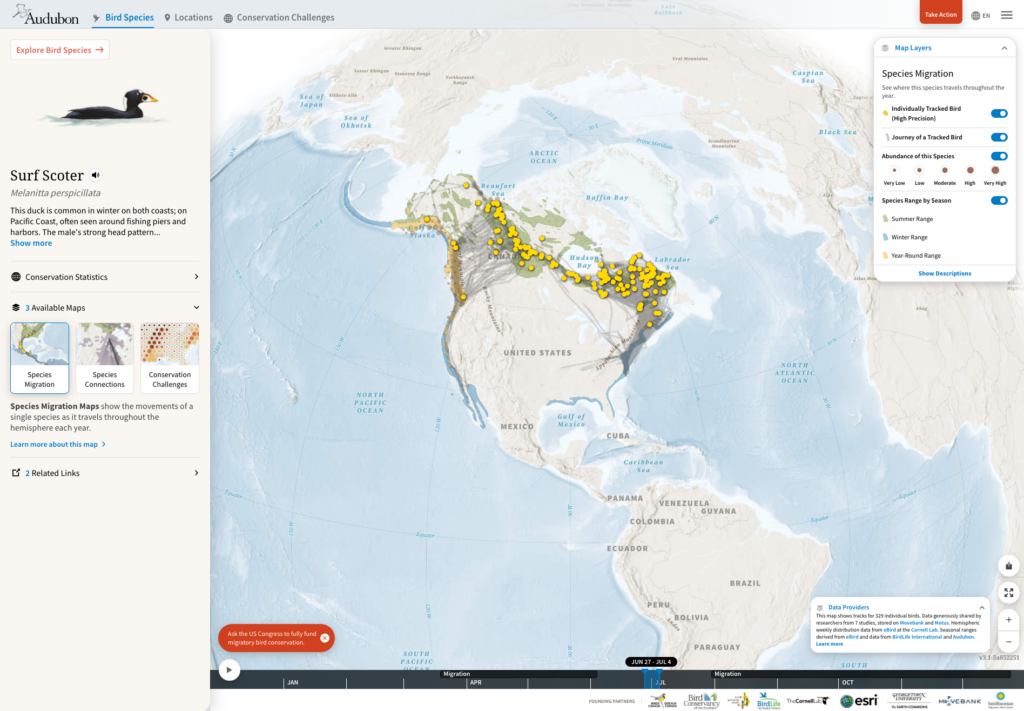
This week we found two dashboards that focus specifically on bird migrations:
Maps Mania: “The European Turtle Dove embarks on an incredible 5,000 km migration every year! Explore this and the journeys of 300+ bird species with the Bird Migration Atlas,” December 4 (Tweet, Bird Migration Atlas)Maps Mania: The Bird Migration Atlas, December 4 (Article, Bird Migration Explorer)
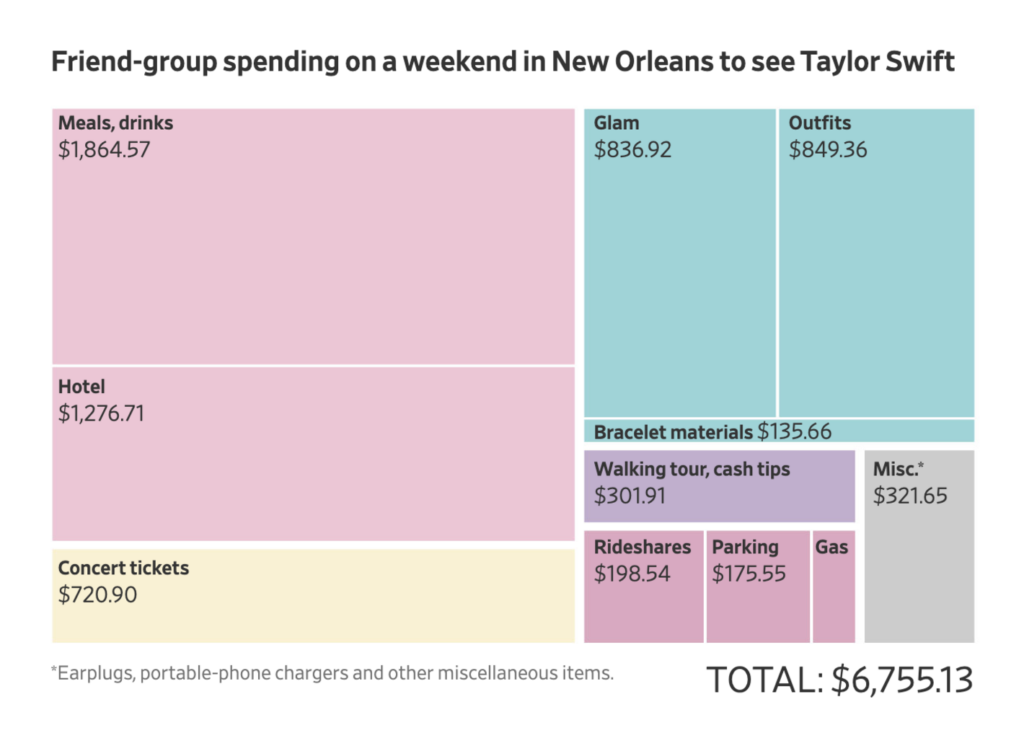
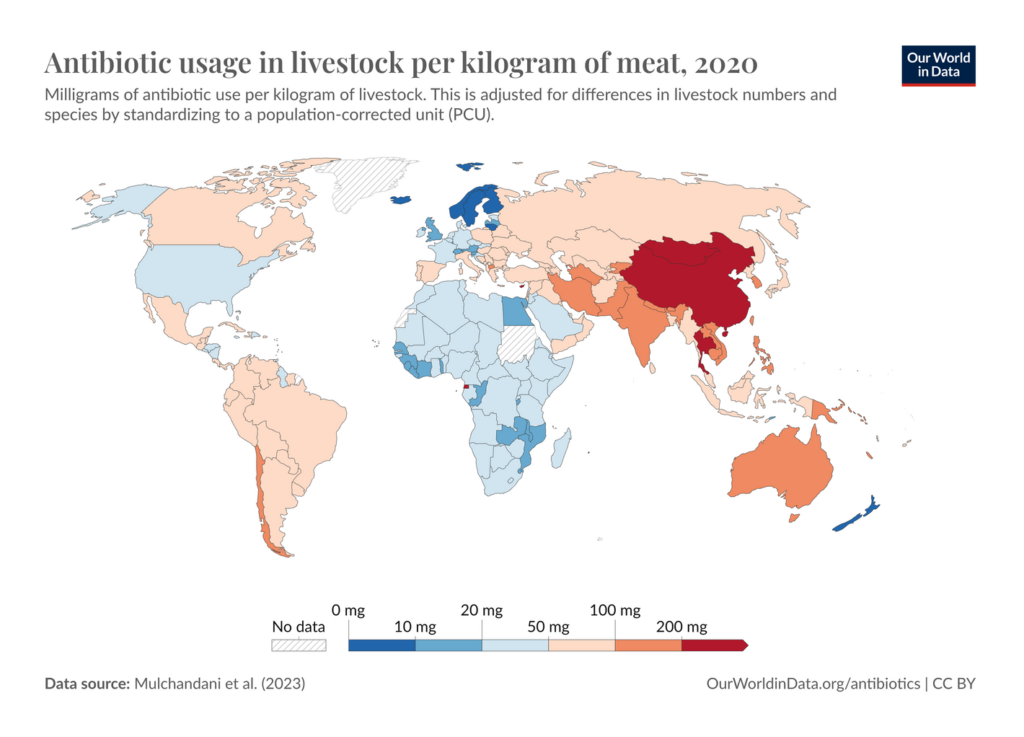
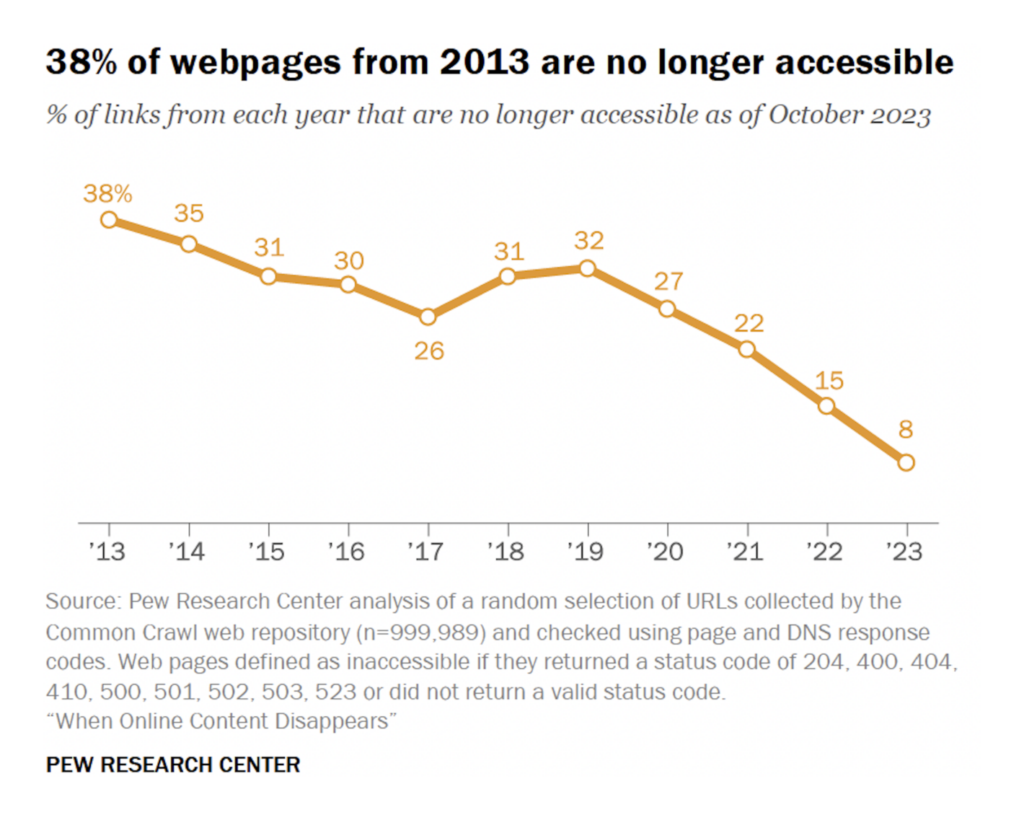
Health and food, or what we (don’t) take in, are closely linked:
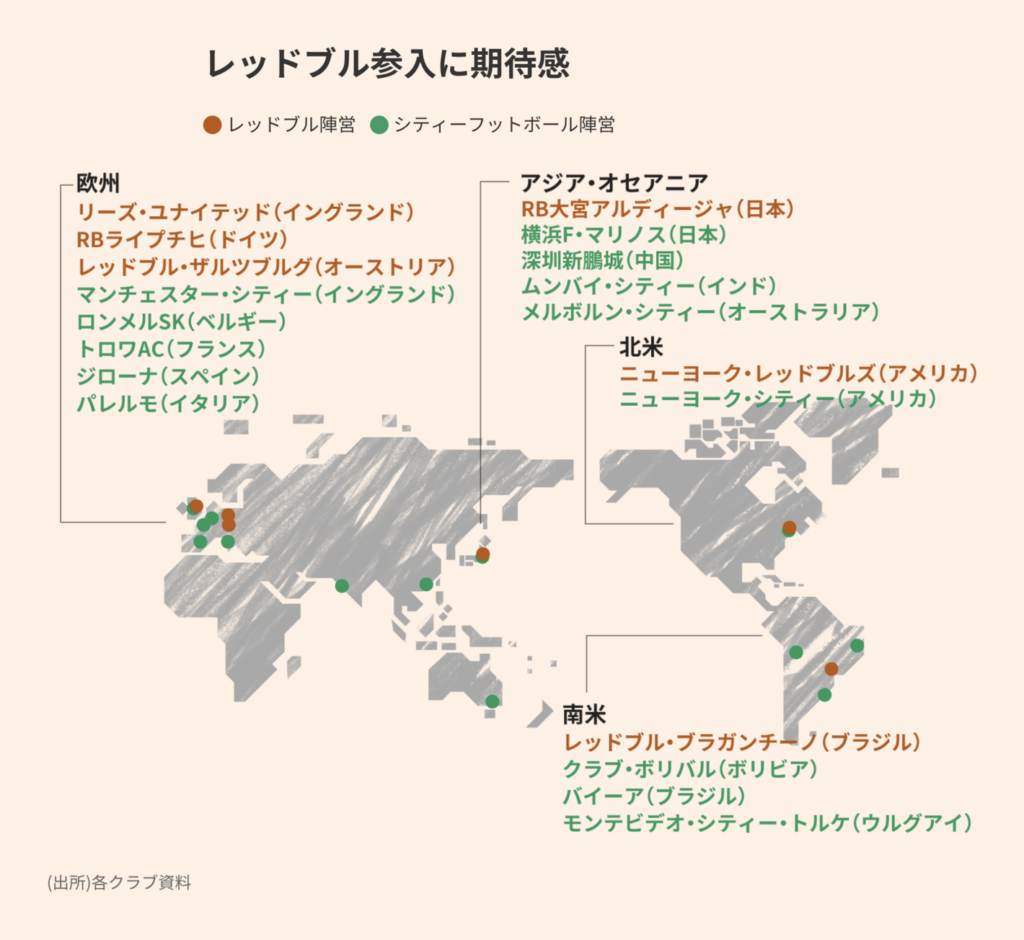
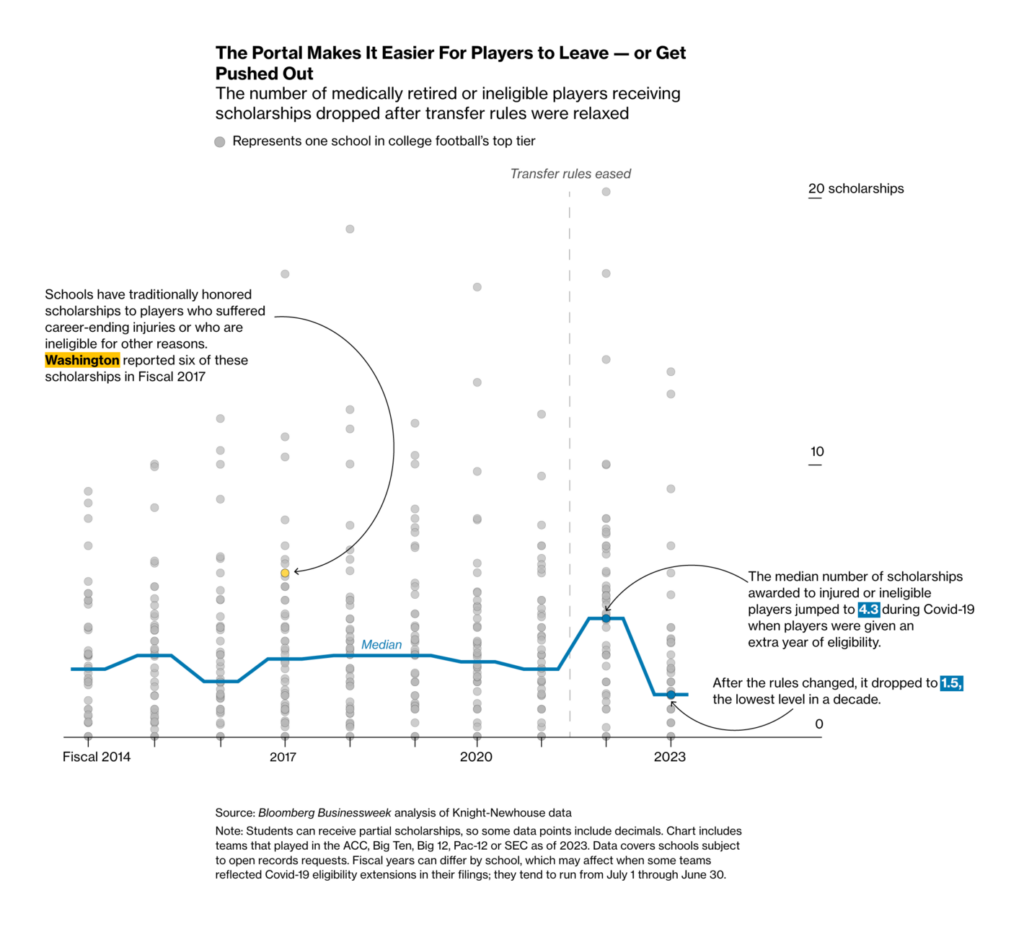
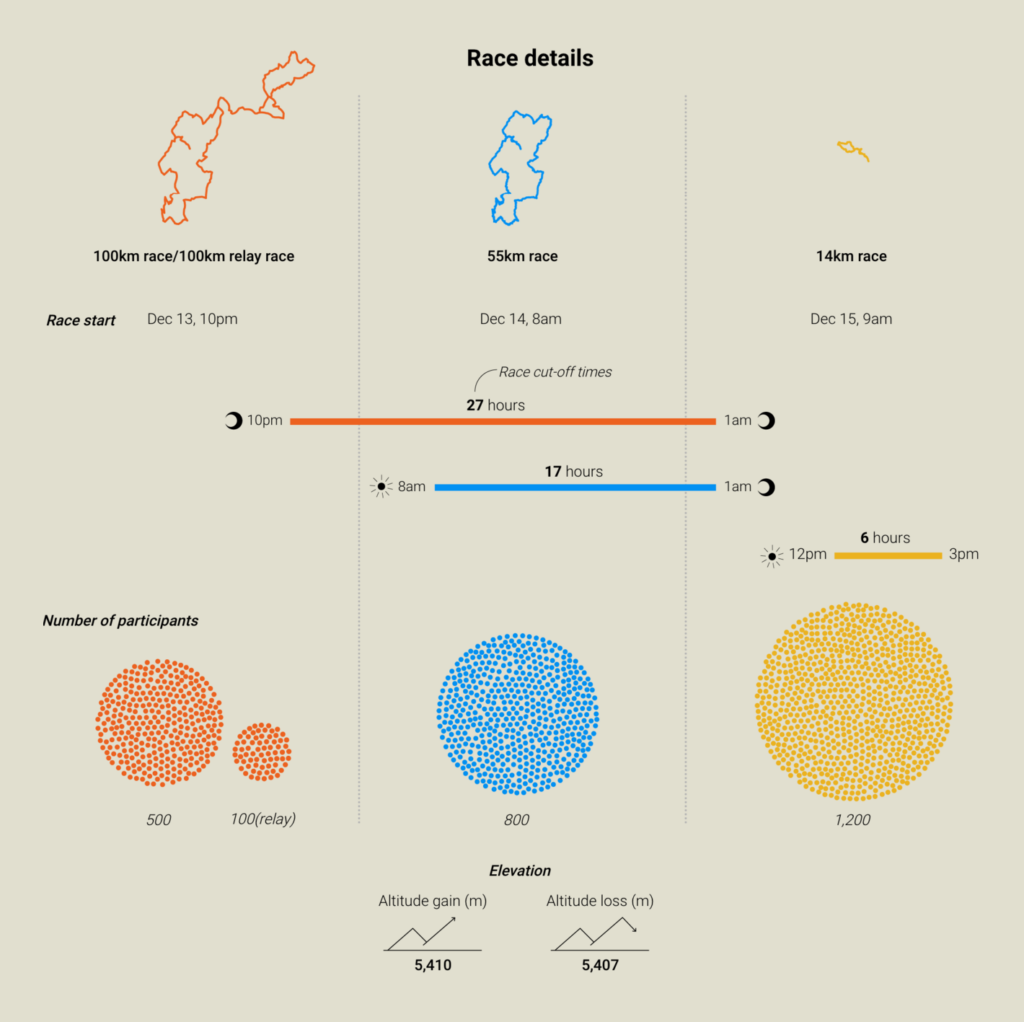
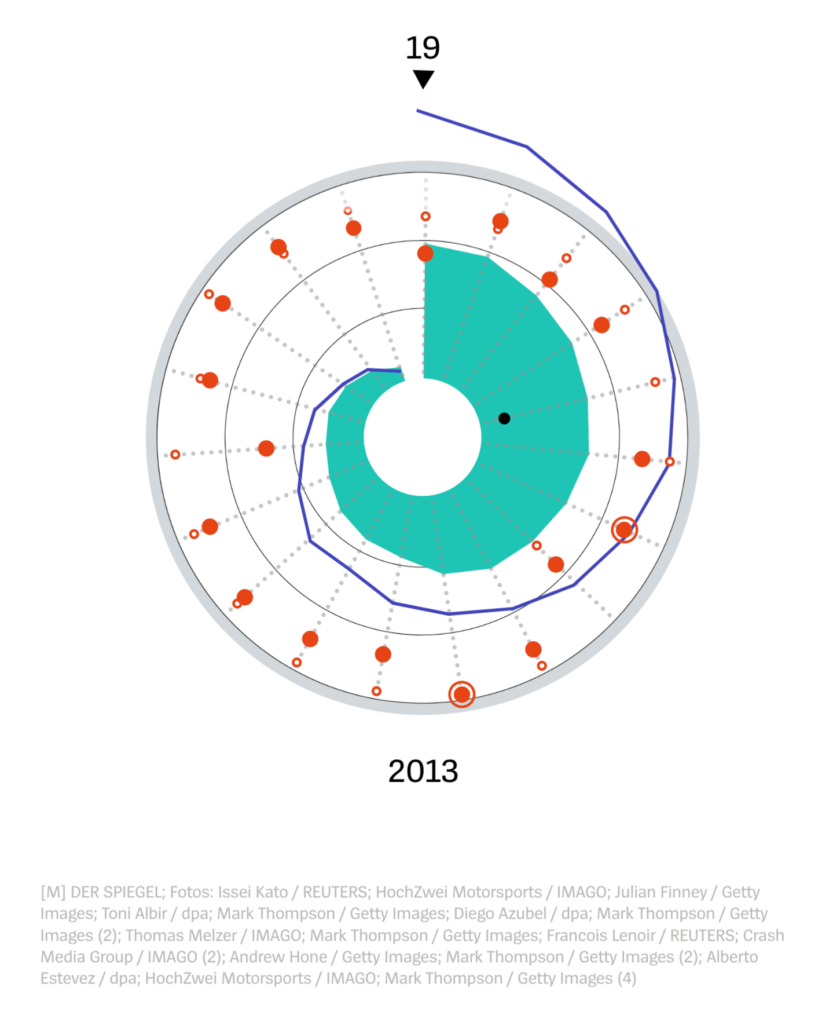
We end this Dispatch with a fun topic for fans — not always for players, as the data shows. Sports! Join us on a journey from Japanese to American football, from trail running in Hong Kong to a British Formula 1 driver:
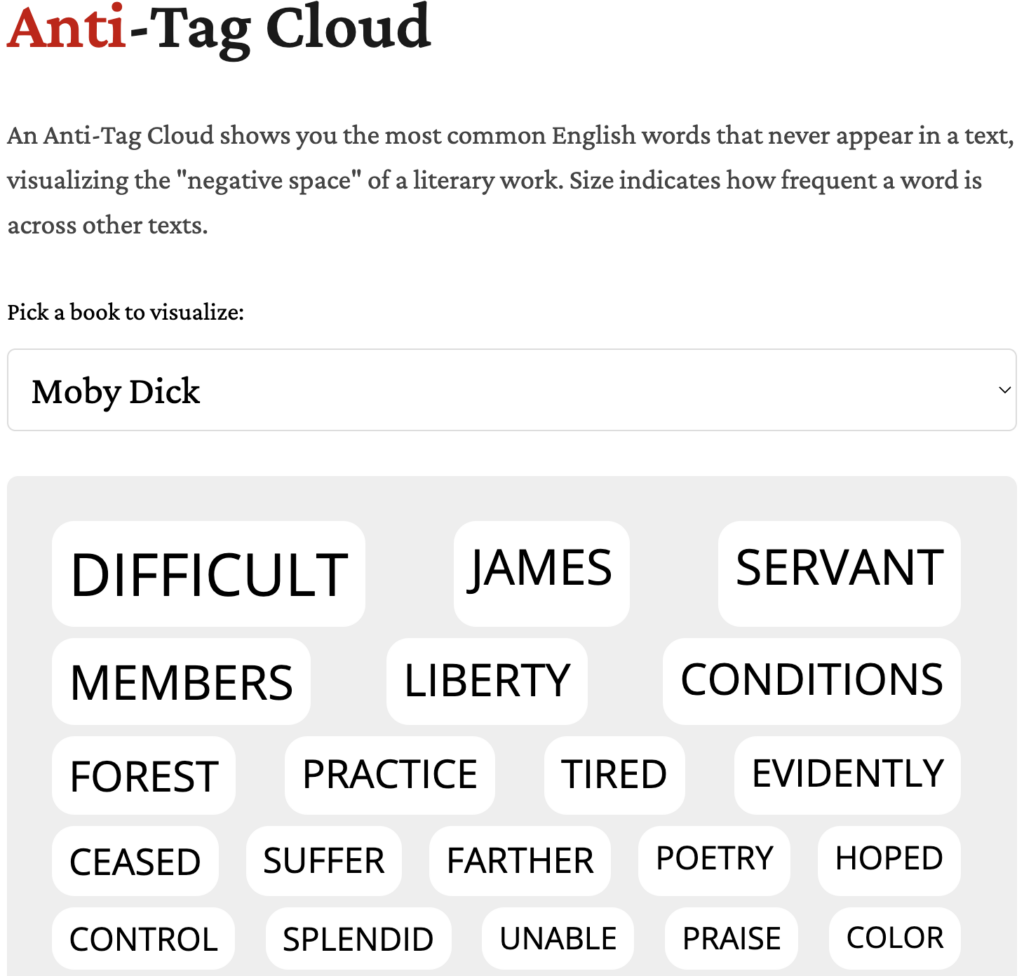
Martin Wattenberg: “How can we visualize what a book ISN’T talking about? With an anti-tag cloud! See the most common English words that are never mentioned in a text,” December 8 (Bluesky, Anti-Tag Cloud) Amelia Wattenberger: Fish Eyes, December 3
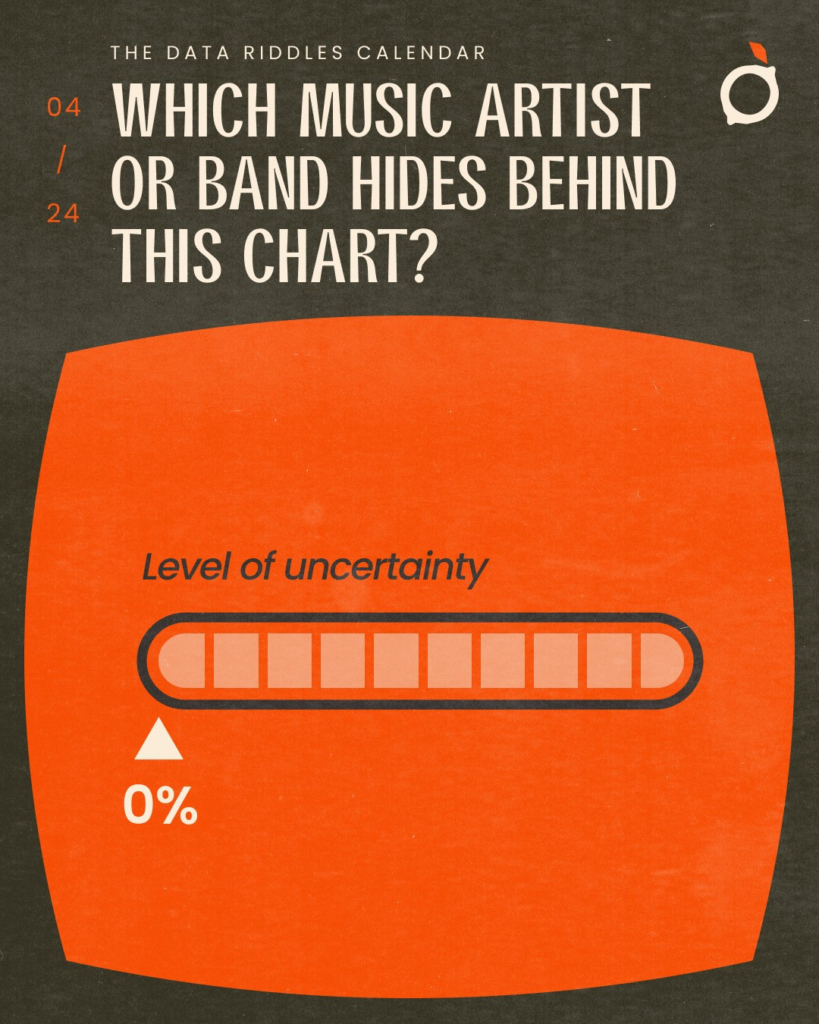
Datacitron: “[04/24] What’s your level of certainty about the answer to this one? […]” December 1 (Bluesky)
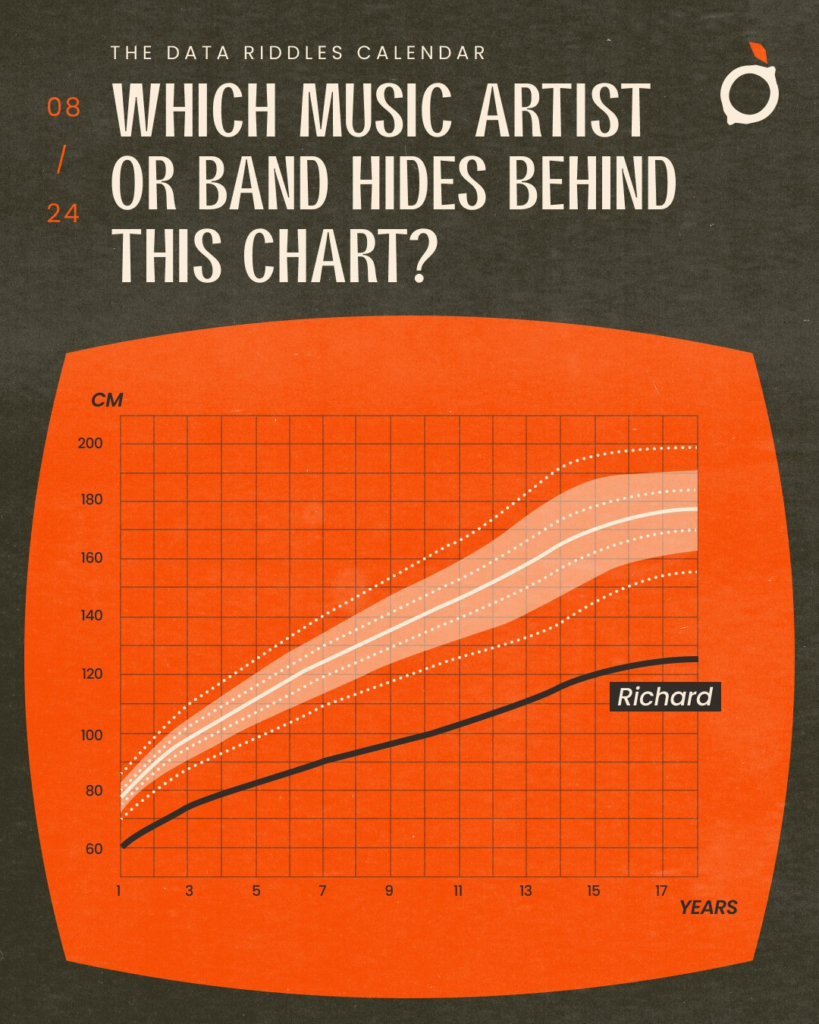
Datacitron: “[08/24] If you found yesterday riddle too difficult, this one should be a nice walk in the countryside. Can you believe we’ve already been doing this for a week?” December 8 (Bluesky)
Help us make this dispatch better! We’d love to hear which newsletters, blogs, or social media accounts we need to follow to learn about interesting projects, especially from less-covered parts of the world (Asia, South America, Africa). Write us at hello@datawrapper.de or leave a comment below.
(she/her) is a working student on Datawrapper’s Communications team. She creates the Data Vis Dispatch to keep data visualization enthusiasts up to date on exciting new projects. When she’s not working, she studies interface design, and when she’s not studying, she’s planning a festival stage or soldering light installations. Vivien lives in Potsdam.


Comments