Data Vis Dispatch, December 5

The best of last week’s big and small data visualizations

Welcome back to the 121st edition of Data Vis Dispatch! Every week, we’ll be publishing a collection of the best small and large data visualizations we find, especially from news organizations — to celebrate data journalism, data visualization, simple charts, elaborate maps, and their creators.

Recurring topics this week include the 28th U.N. Climate Change Conference, pop culture memories, and the teeny-tiny parts in our tech gadgets.

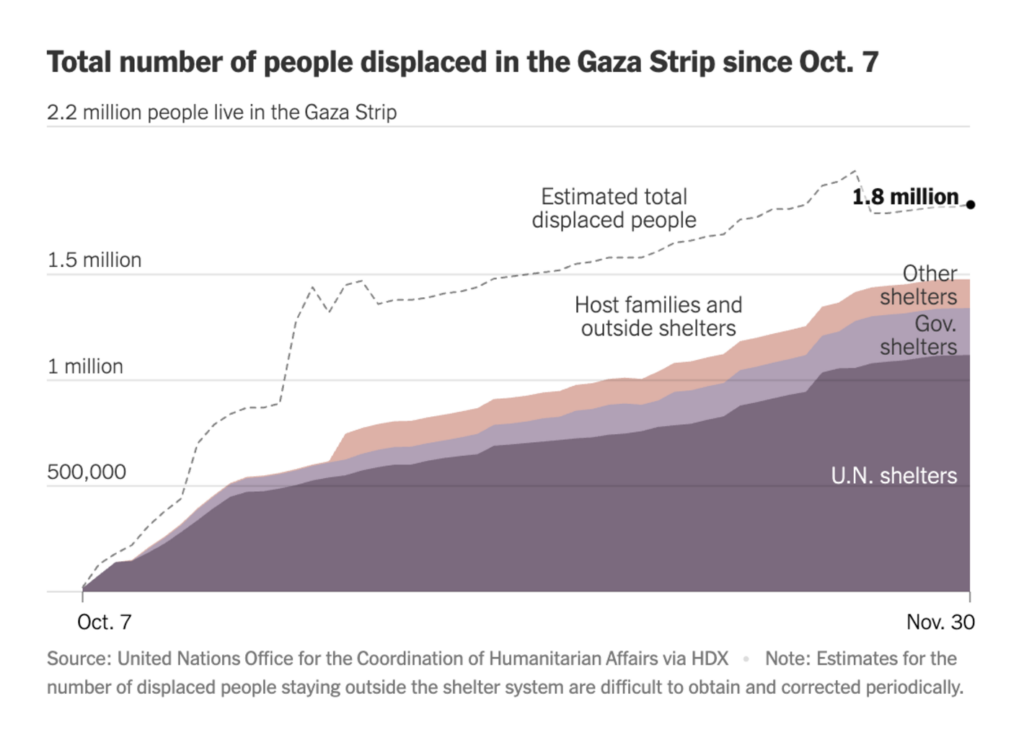
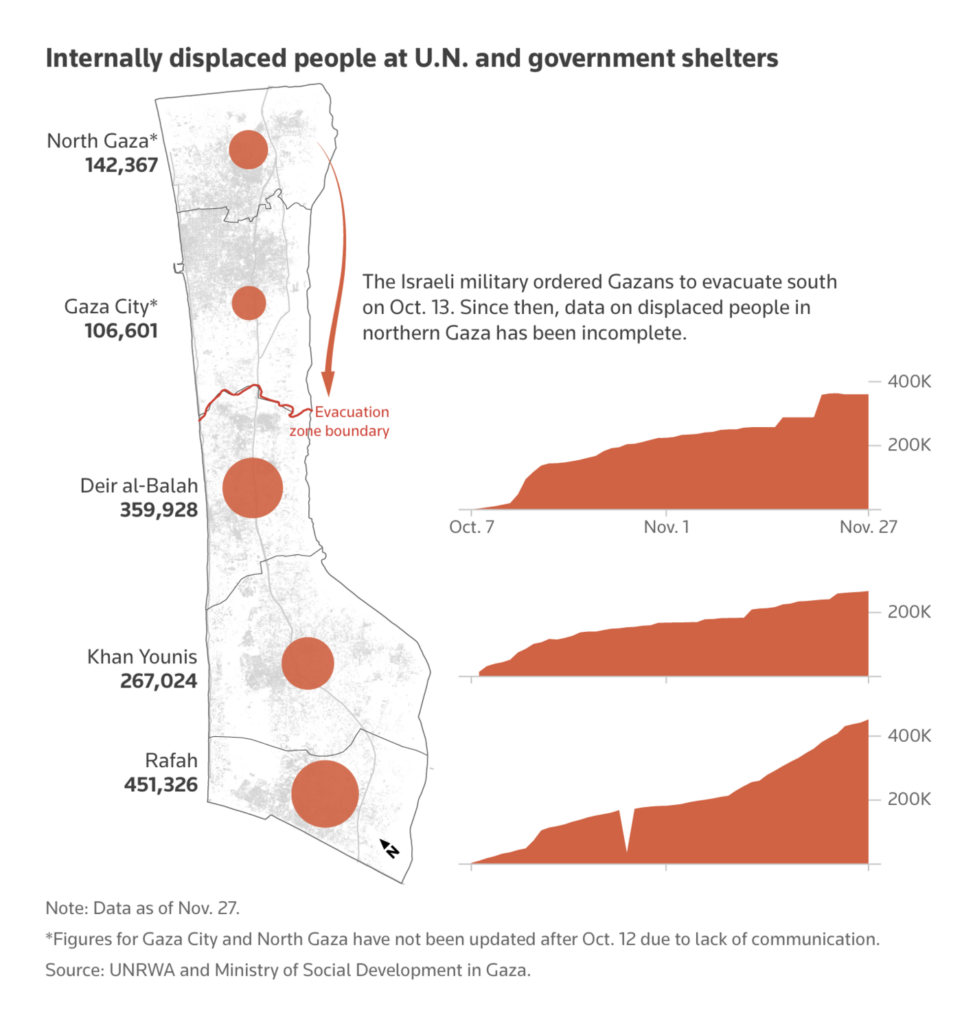
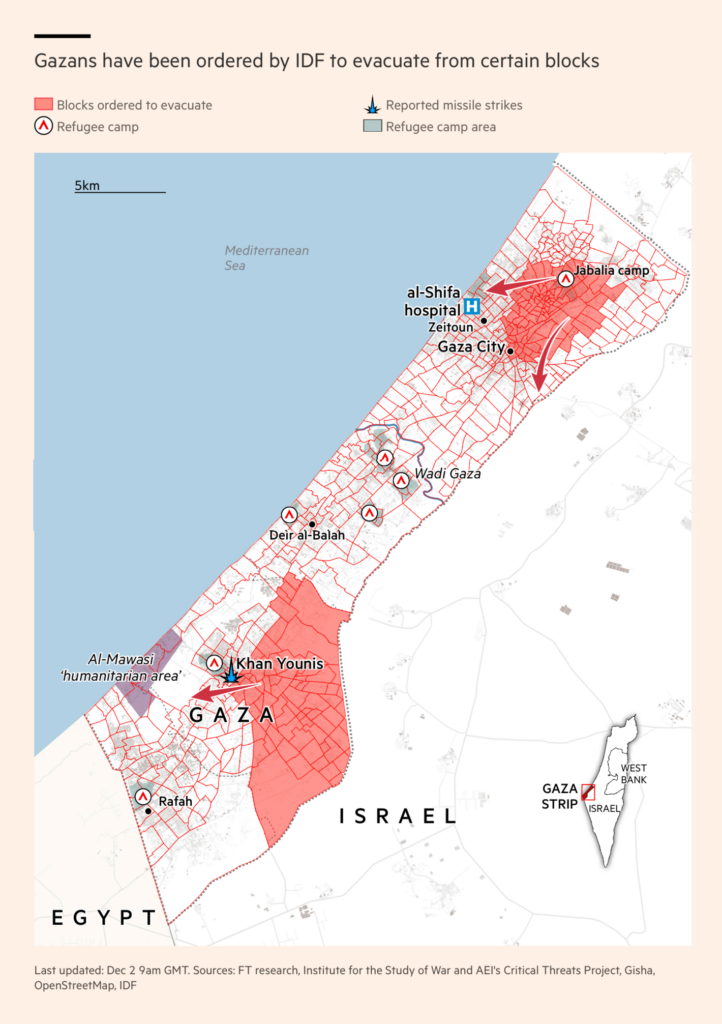
Even though war is an unpleasant topic, visualizations can help us understand it — and we believe it’s important to show them. On the war between Hamas and Israel, several diagrams this week dealt with damage and displacement in the Gaza Strip:

The New York Times: What the Scale of Displacement in Gaza Looks Like, December 2
Reuters: Mapping the conflict in Israel and Gaza, November 28
Financial Times: Israel-Hamas truce talks stall after Mossad negotiators leave Qatar, December 2
The Guardian: Hospital damage in Gaza during Israeli offensive – a visual investigation, December 1

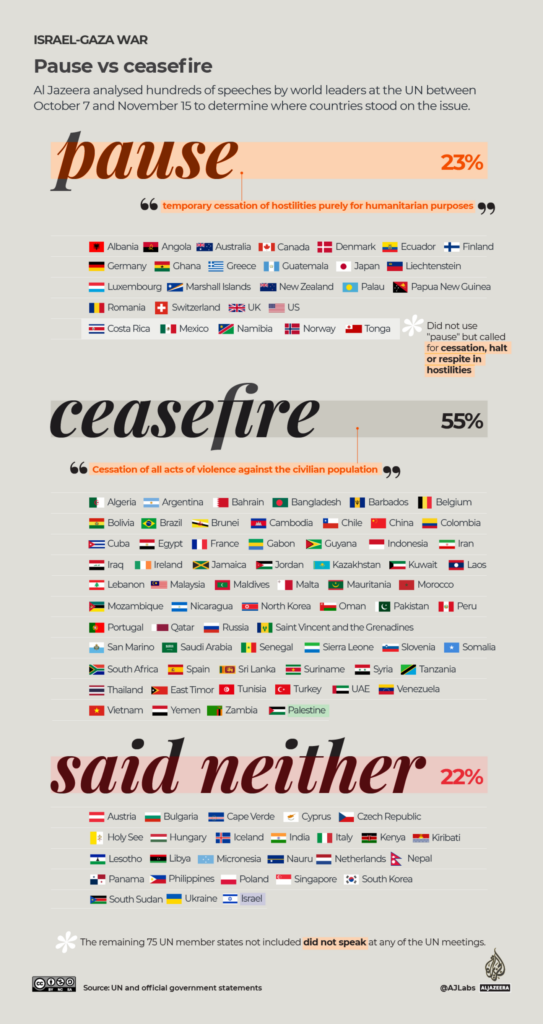
One article we found deals with the use of words about war and how this could relate to political thinking:

Al Jazeera: Israel-Palestine war of words, November 30

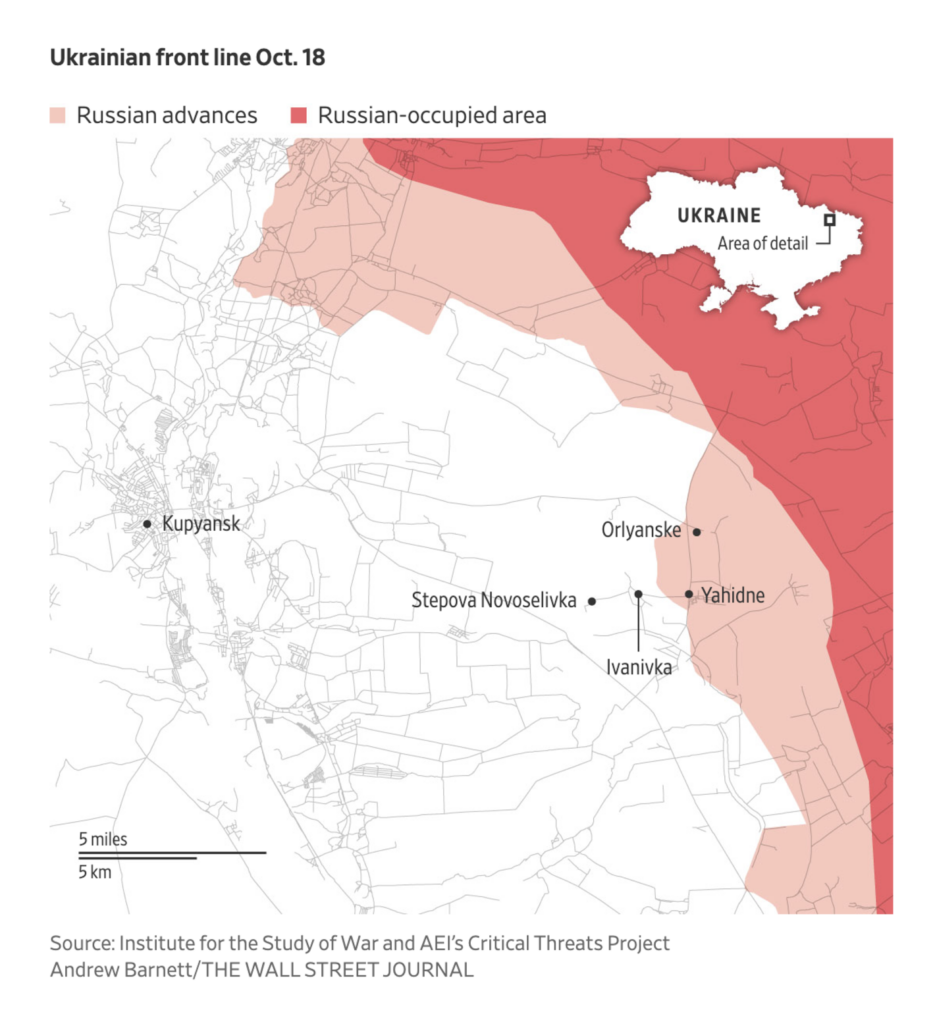
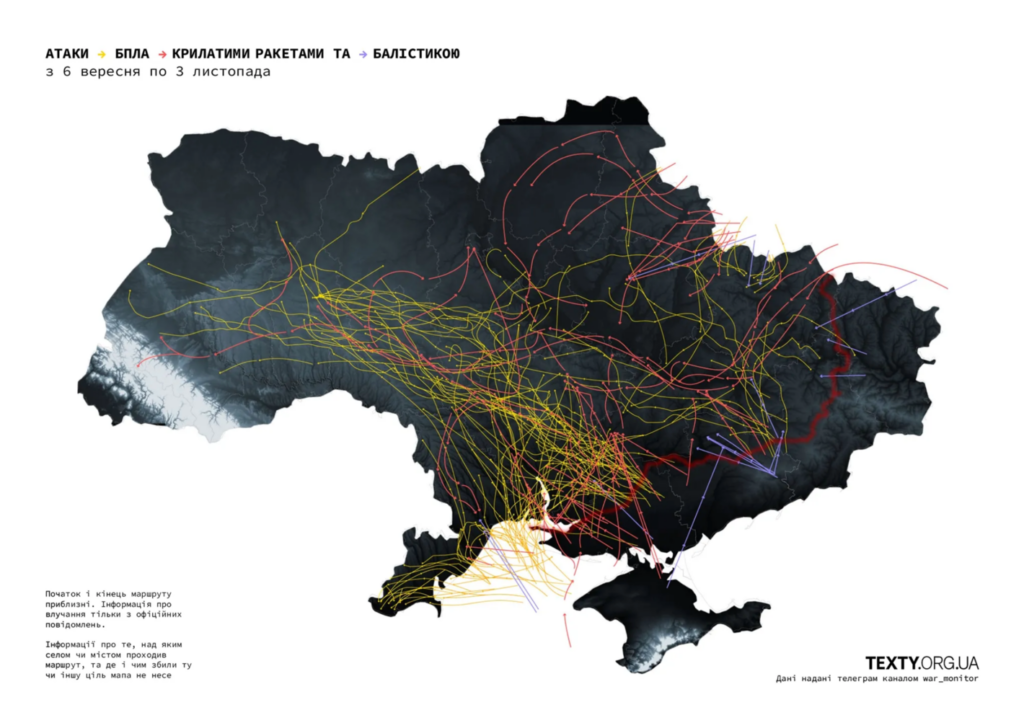
Other visualizations covered Russia’s ongoing war against Ukraine:

The Wall Street Journal: Dead or Alive? The Hunt for a Ukrainian Soldier Missing on a Chaotic Battlefield, December 3
Тексти: Повітряна війна. Якими маршрутами летіли «Шахеди» і ракети протягом вересня-жовтня, December 4

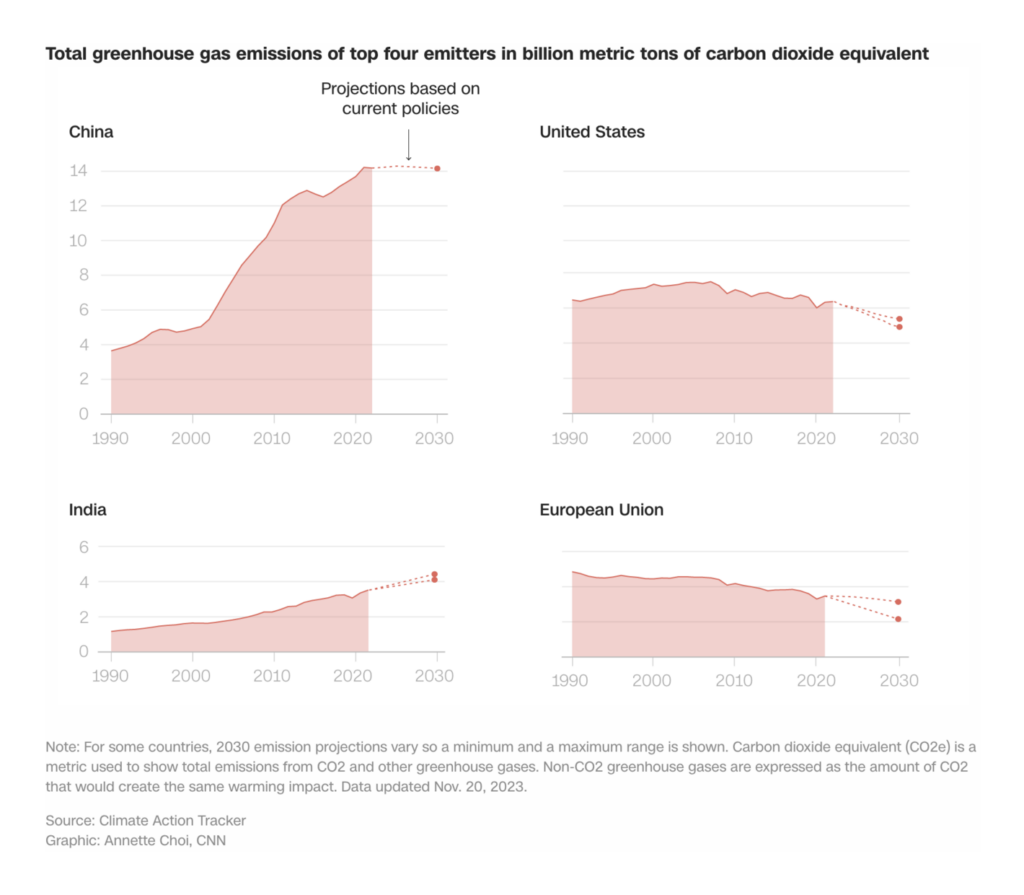
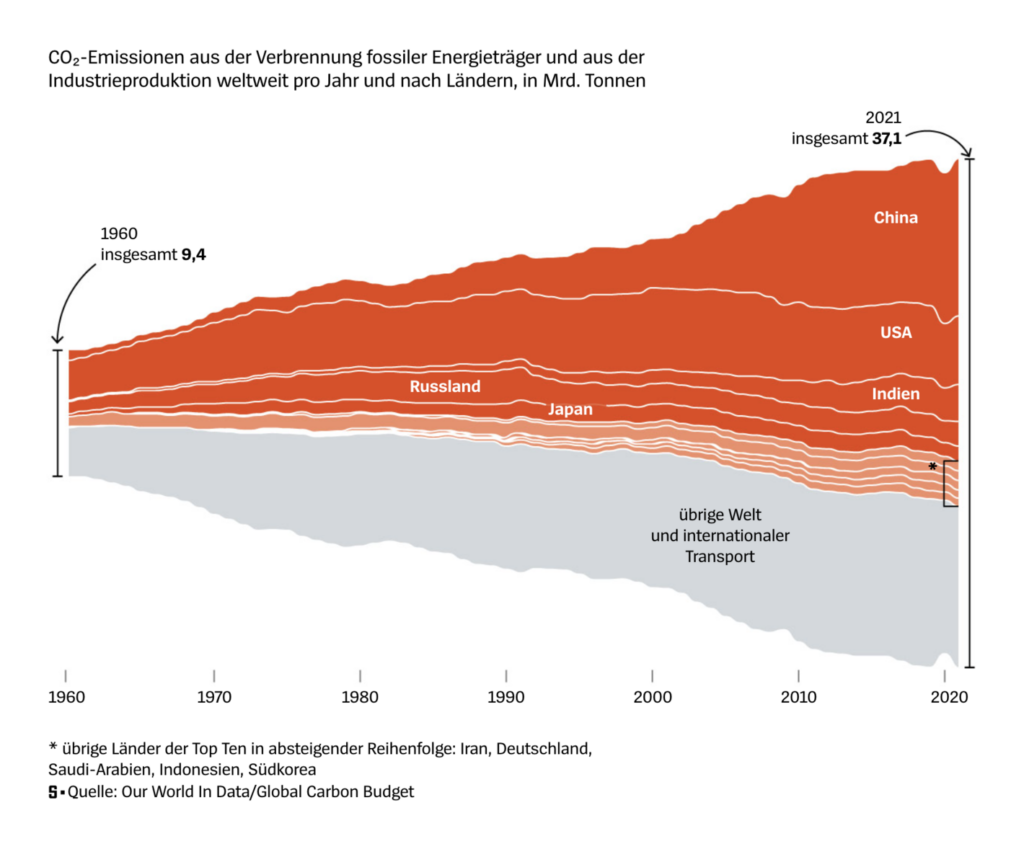
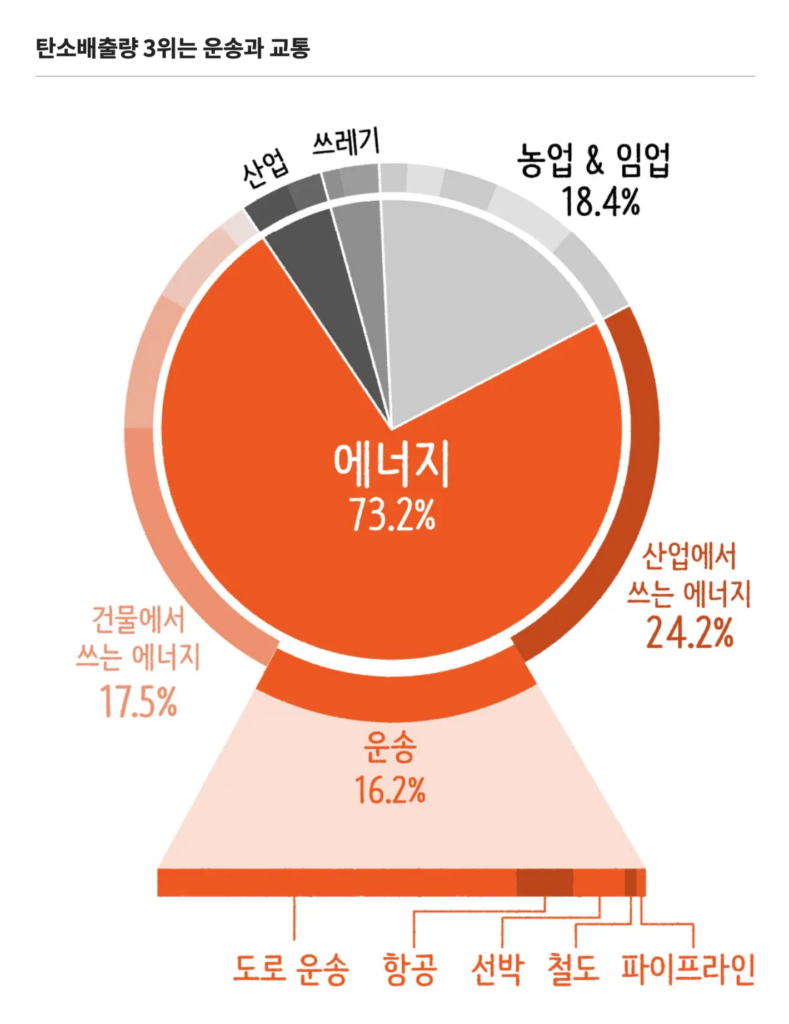
COP28, the U.N.’s 28th annual climate summit, started on November 30. Not surprisingly, we found a large number of charts about climate change and its main causes — in particular, CO₂:

CNN: As climate chaos accelerates, which countries are polluting the most?, December 1
Les Echos: Emissions de CO2 : où en est la France, secteur par secteur ?, November 30
Der Spiegel: Die 23 wichtigsten Fragen und Antworten zur Weltklimakonferenz, December 2
SBS News: 만약 모든 대중교통 요금이 0원이 된다면?, November 29
Diario Sur: +2,2ºC, November 28

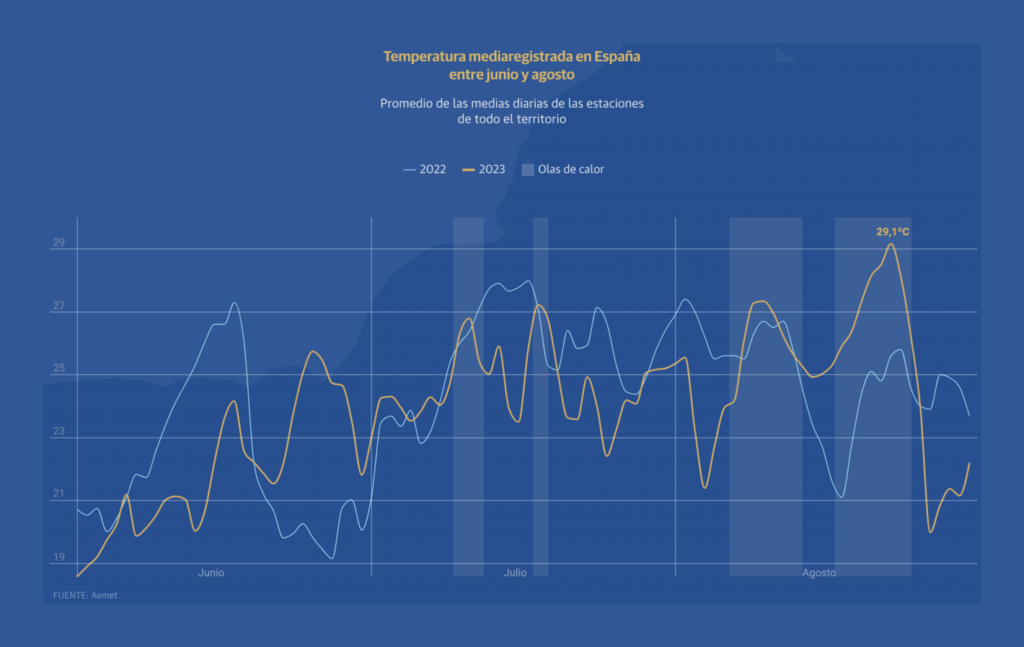
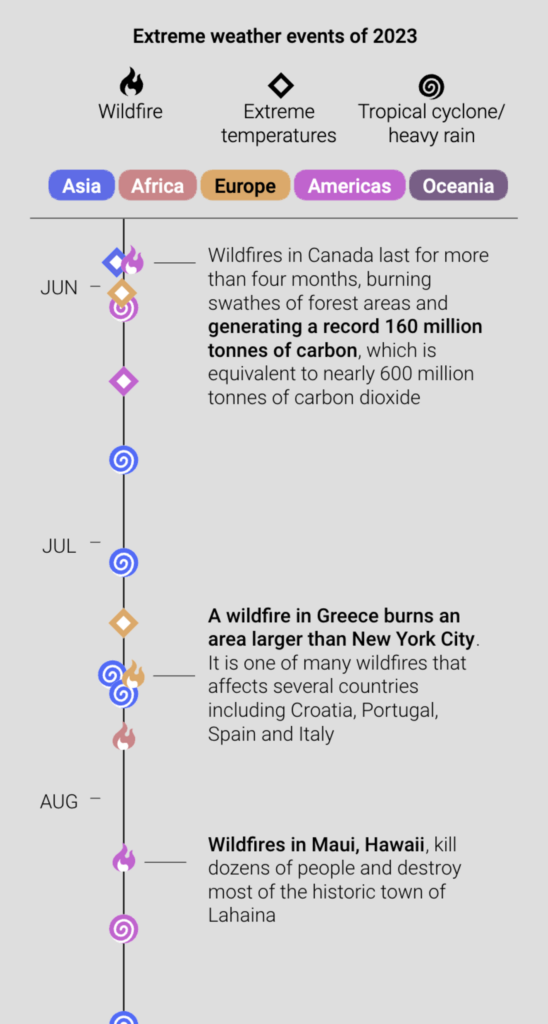
Carbon emissions and rising temperatures are just the beginning of climate visualization topics. Their effects on the weather and on people were also explored:

McKinsey Institute for Black Economic Mobility: Impacts of climate change on Black populations in the United States, November 30
South China Morning Post: Are gates to hell open? What 2 degrees warmer means for Earth, November 30

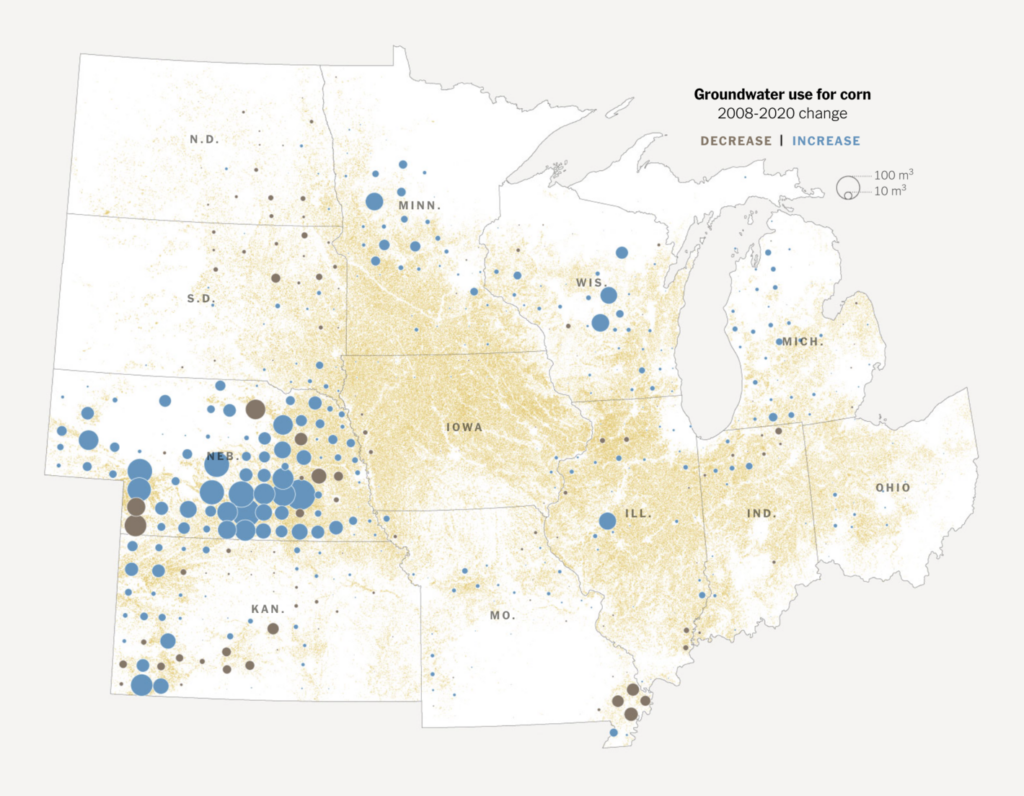
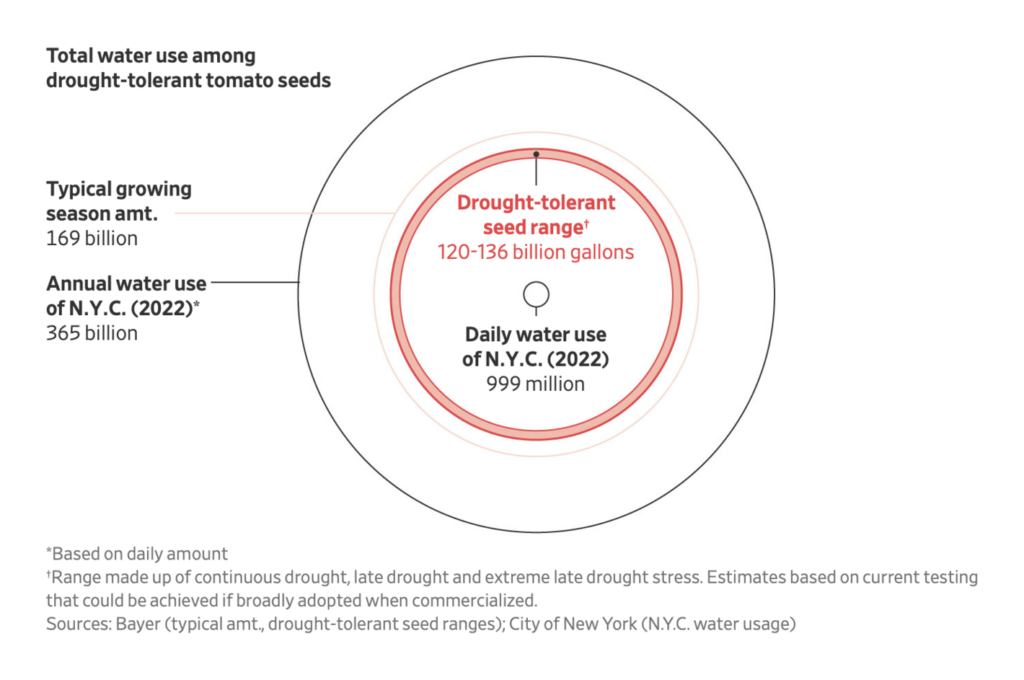
The effects of climate change on the agricultural sector deserve their own cluster:

The New York Times: Airlines Race Toward a Future of Powering Their Jets With Corn, November 30
The Wall Street Journal: The Race to Save Ketchup: Building a Tomato for a Hotter World, December 3

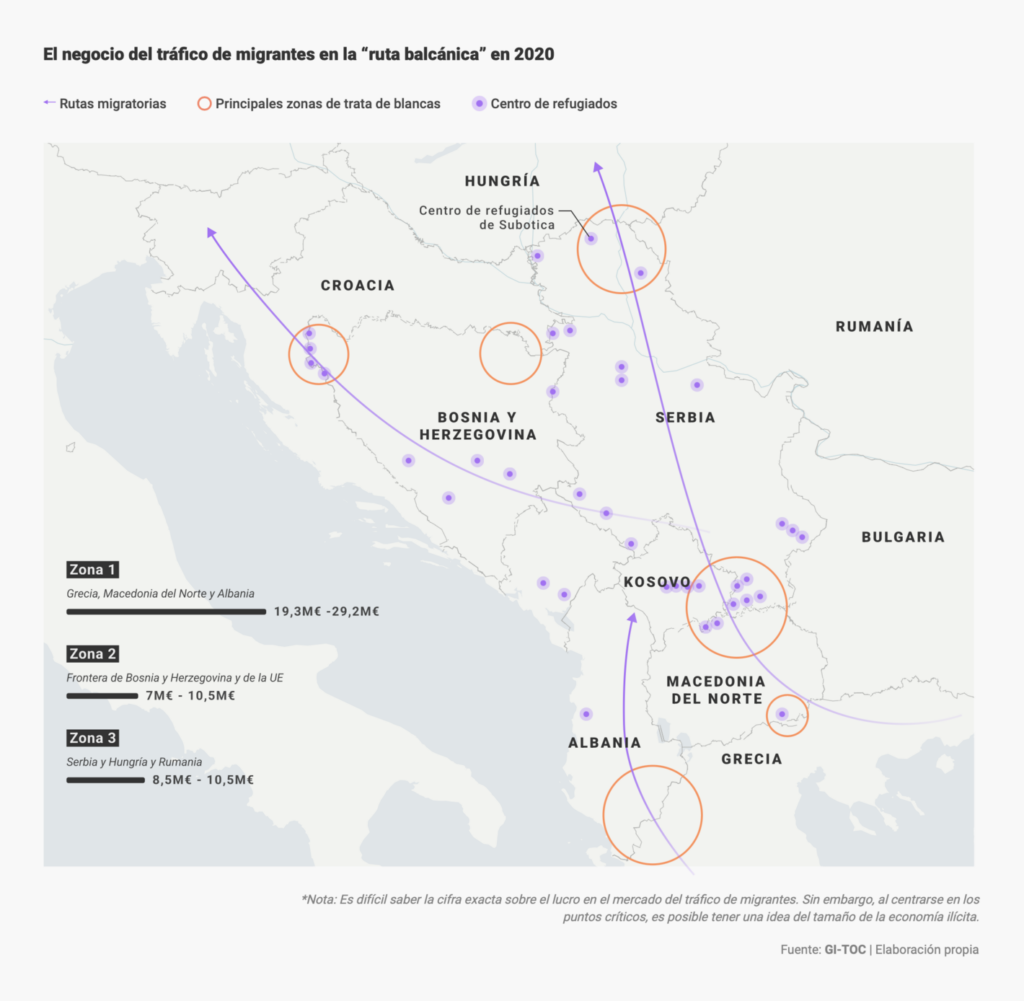
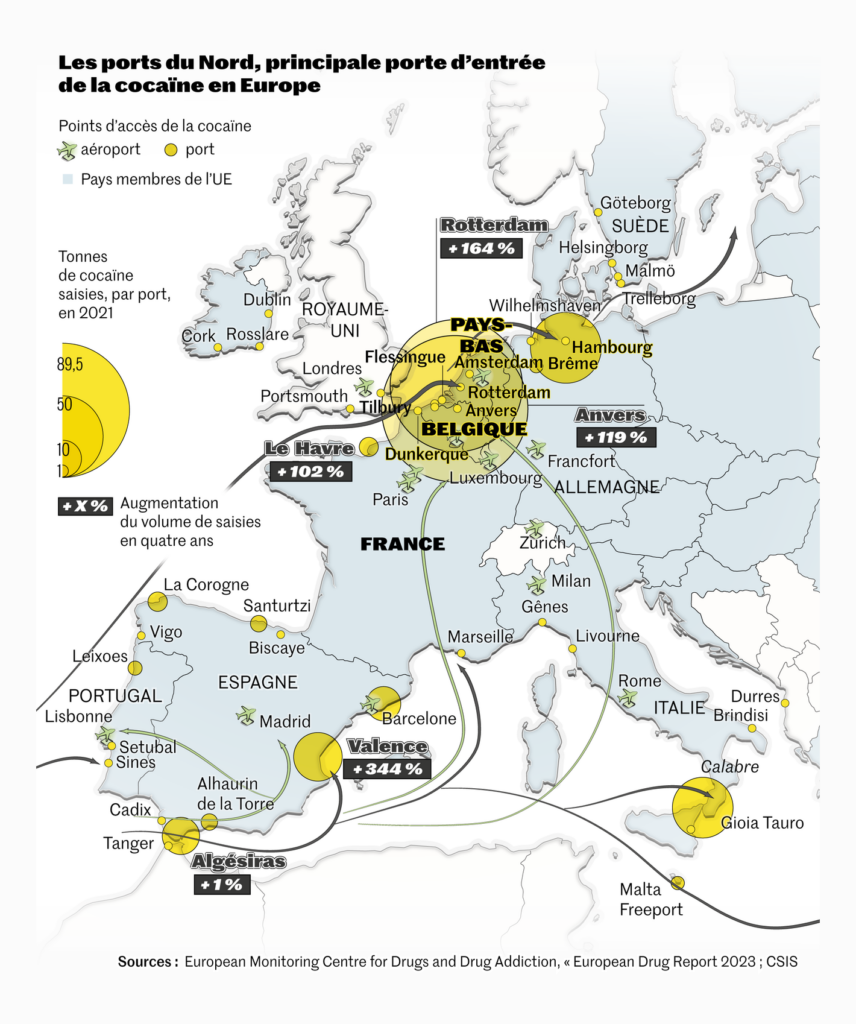
On international routes of migration and trade:

El Confidencial: La Europa de los muros, November 29
Le Monde: « Le narcotrafic est une guerre à laquelle le débat politique doit s’intéresser », December 1

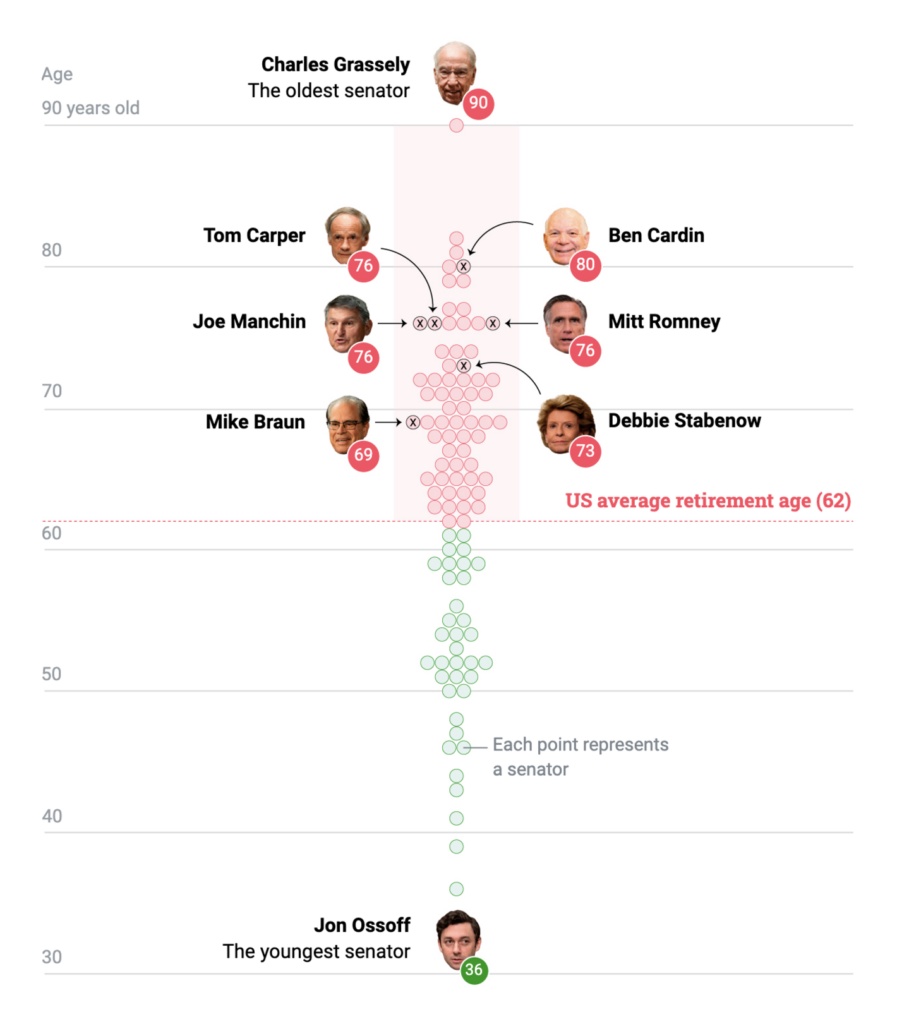
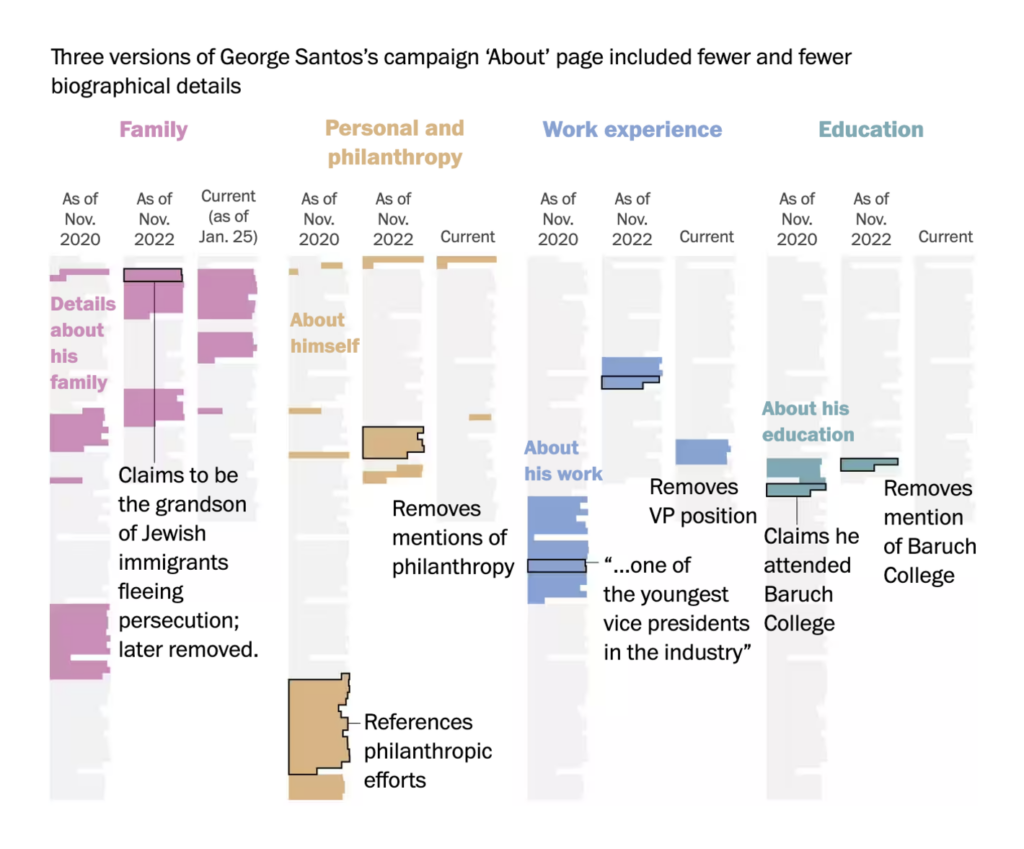
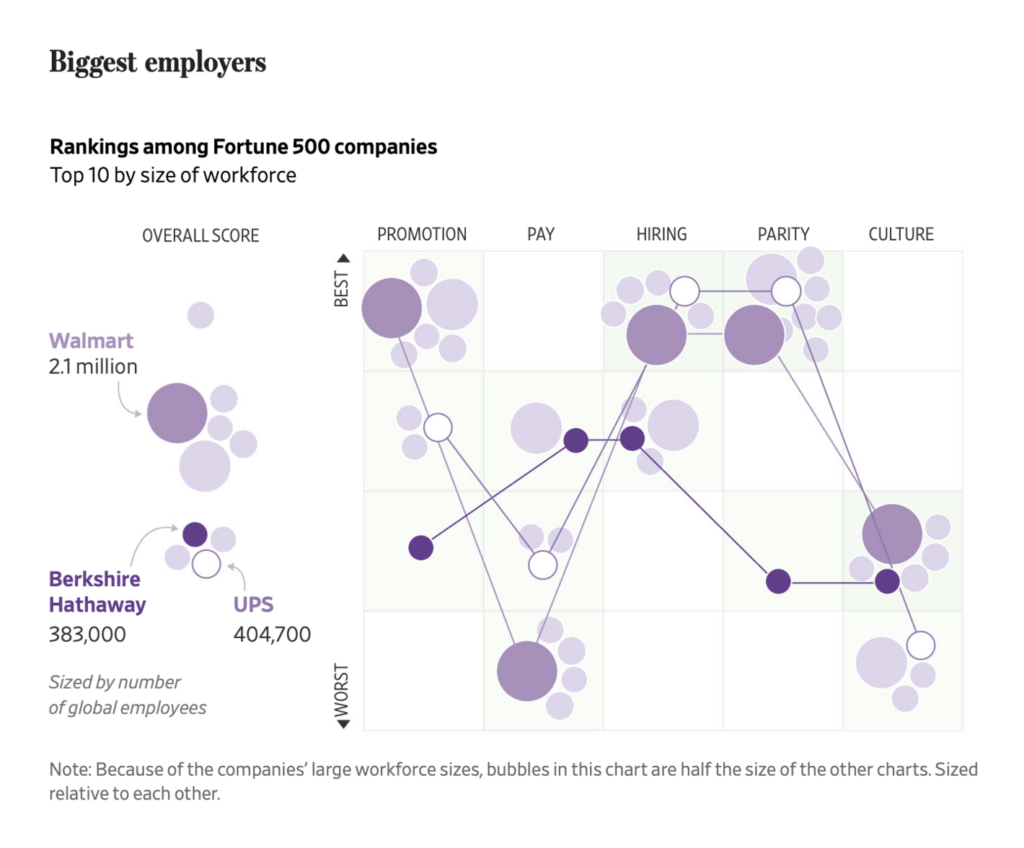
Off to U.S. politics. Spoiler: The U.S. Senate is pretty old:

Univision: The Oldest Senate in History: Two-Thirds of its Members Surpass Retirement Age, November 29
The Washington Post: See the evolution of lies in George Santos’s campaign biography, December 1

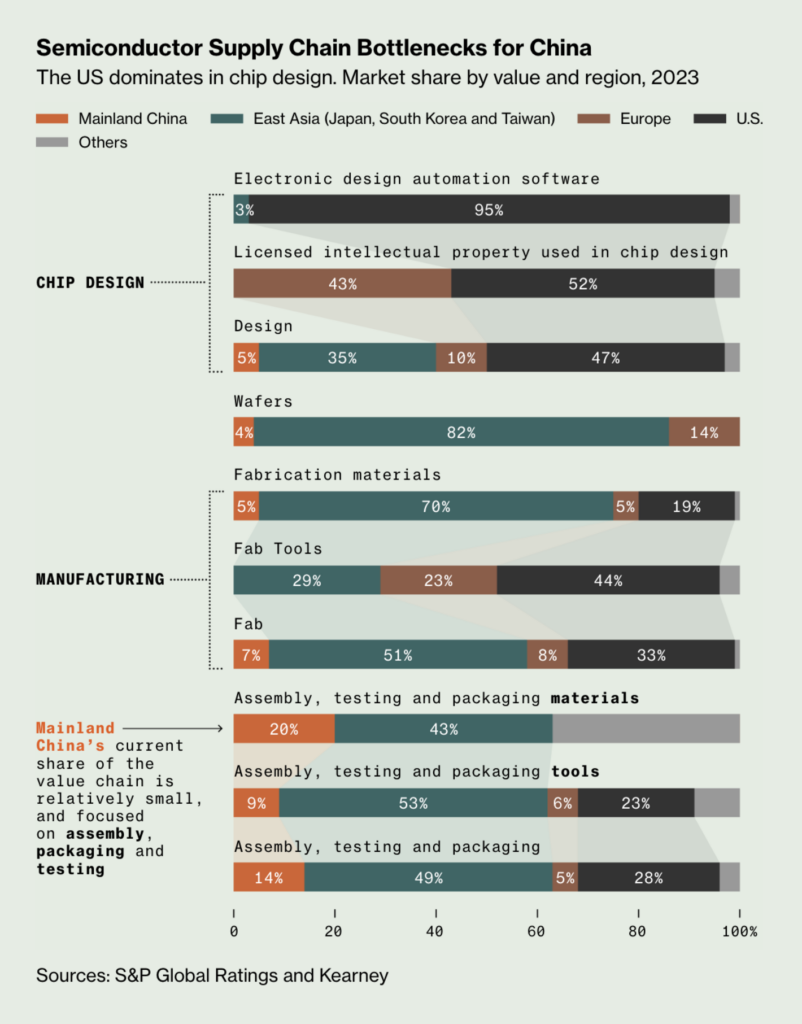
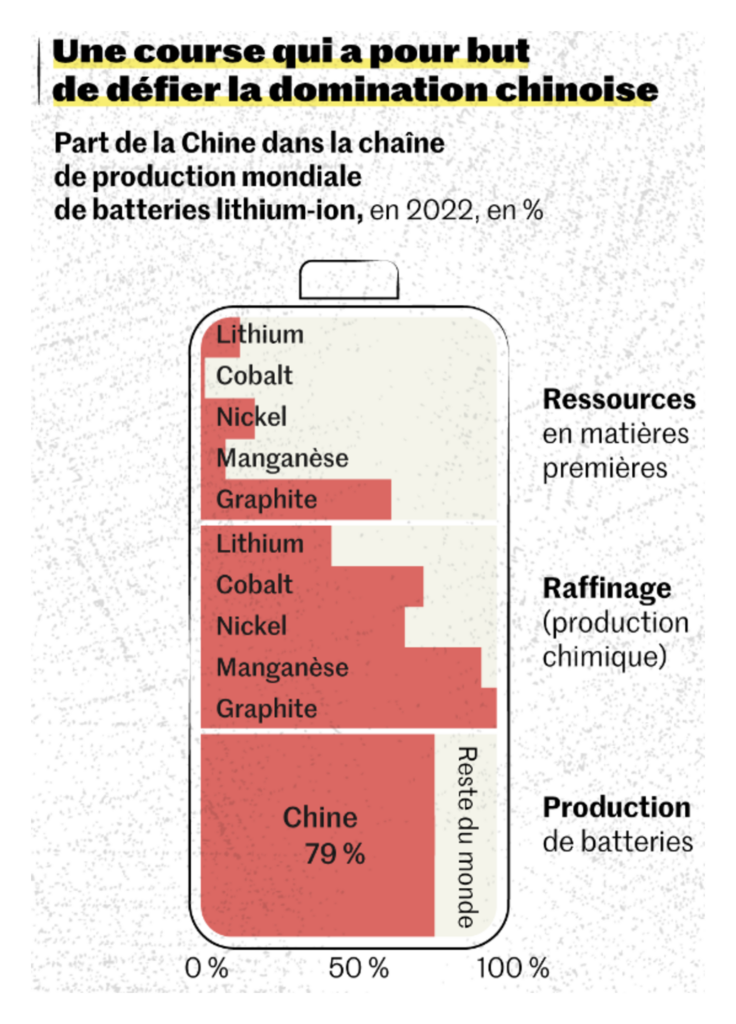
A very special topic in this week’s economic charts: Where do the little components in our gadgets come from? And what does China have to do with it?:

Bloomberg: China Secretly Transforms Huawei Into Most Powerful Chip War Weapon, December 1
Le Monde: Voitures électriques : une frénésie mondiale de gigafactories, November 29

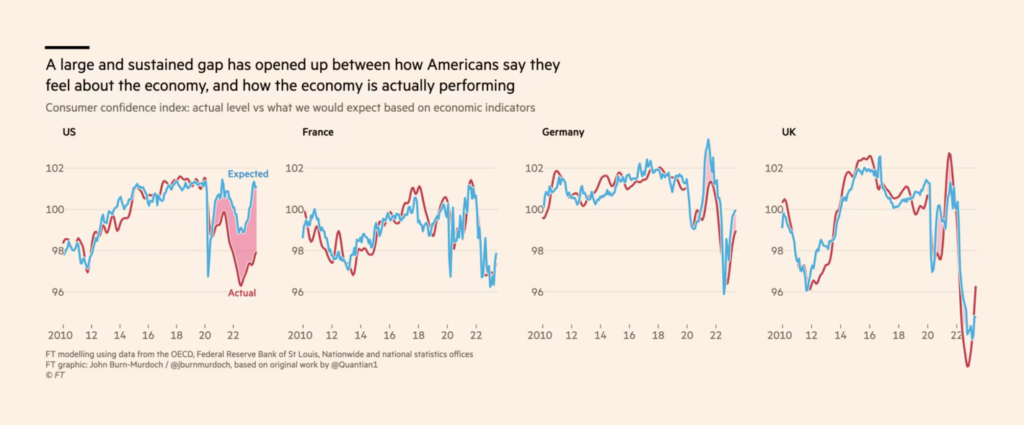
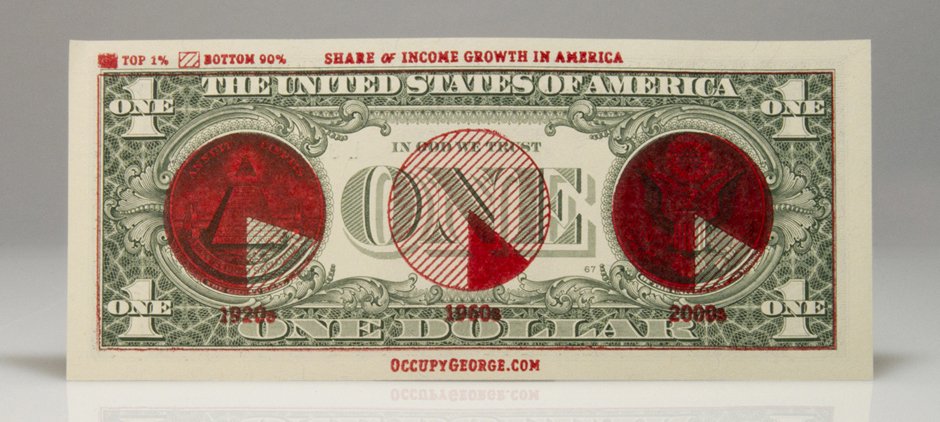
Money, money, money. An omnipresent topic:

Inkyfada: Business opaque, irrégularités multiples… la face cachée de l’empire Ardjan, November 29
The Wall Street Journal: Ranking the Best Companies for Career Growth, November 30

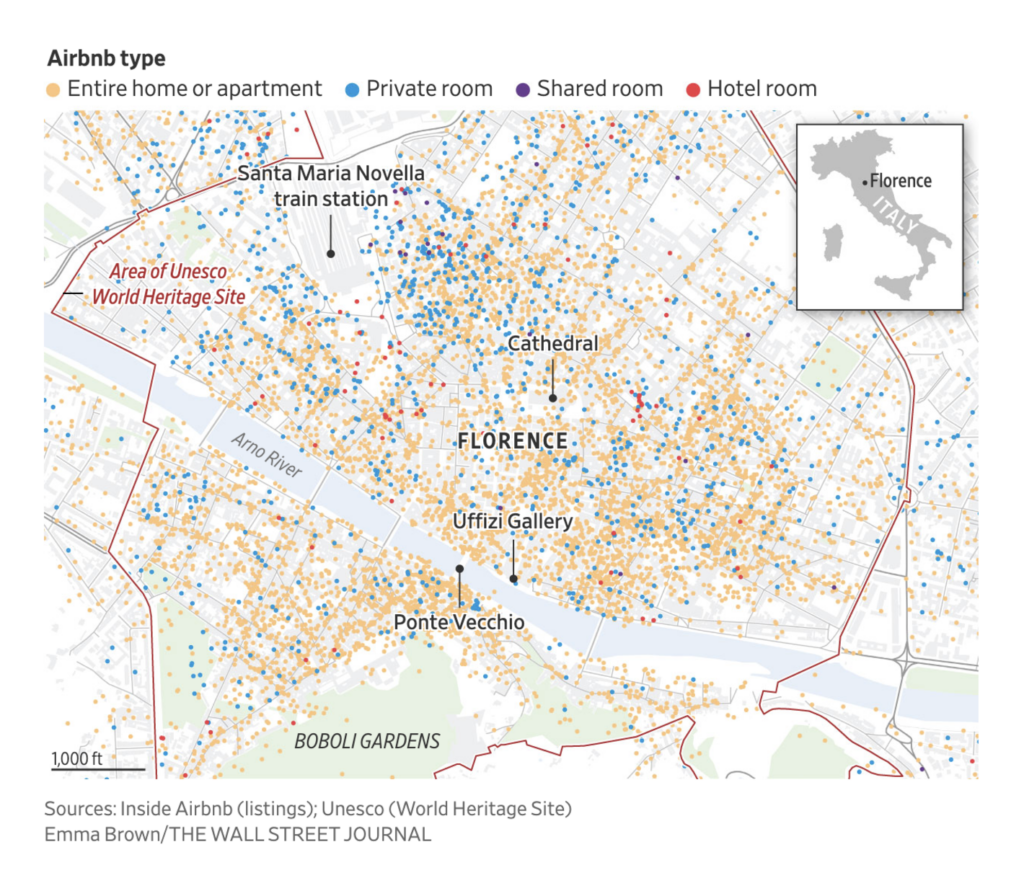
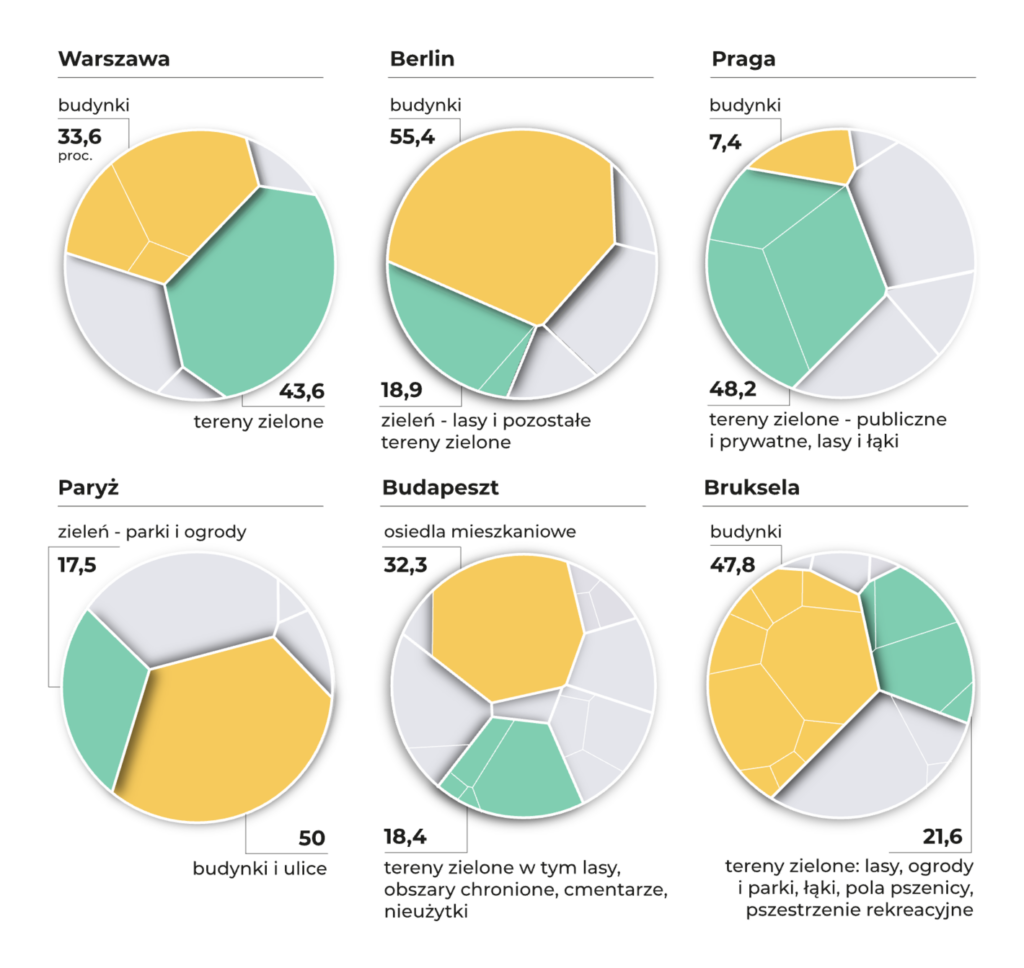
The cities that we live in and travel to starred in two charts this week:

The Wall Street Journal: Airbnb Is Conquering Italy. One City Is Fighting Back, November 30
Gazeta Wyborcza: Rozlewająca się zabudowa Warszawy pochłania miejską zieleń [RAPORT, CZĘŚĆ 3.], December 1

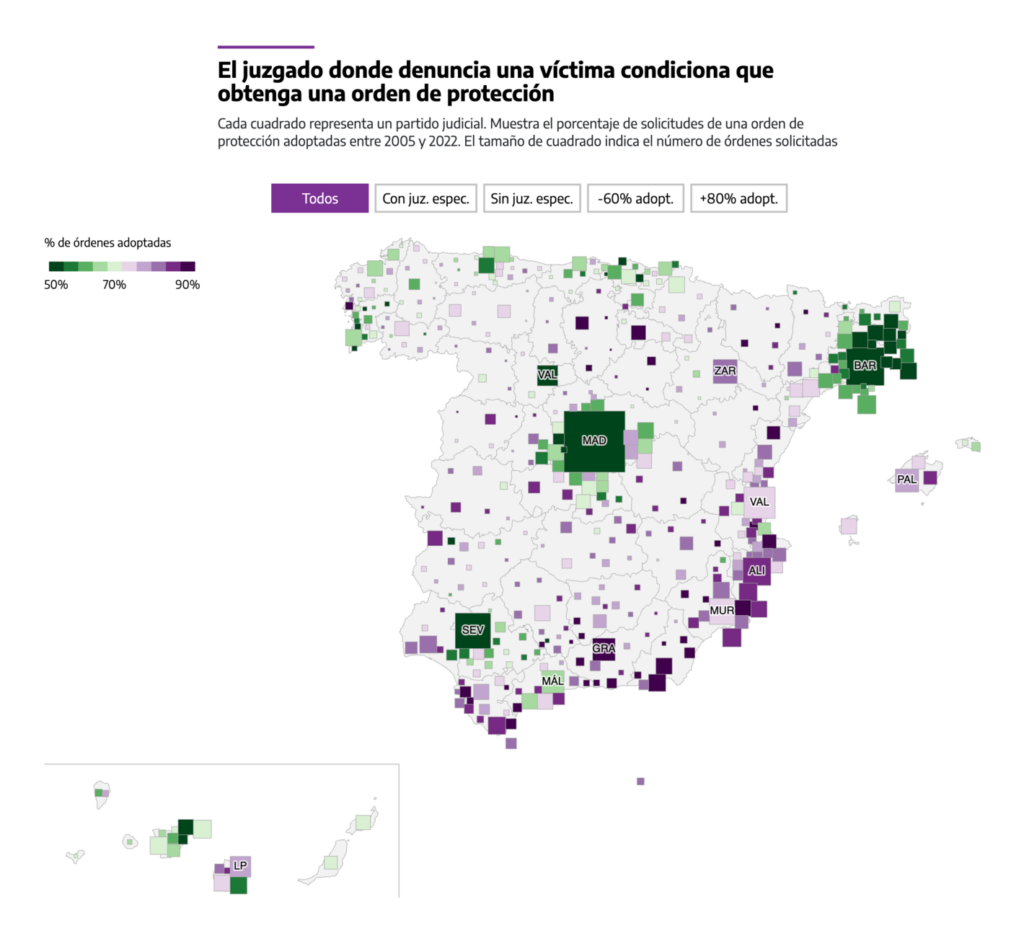
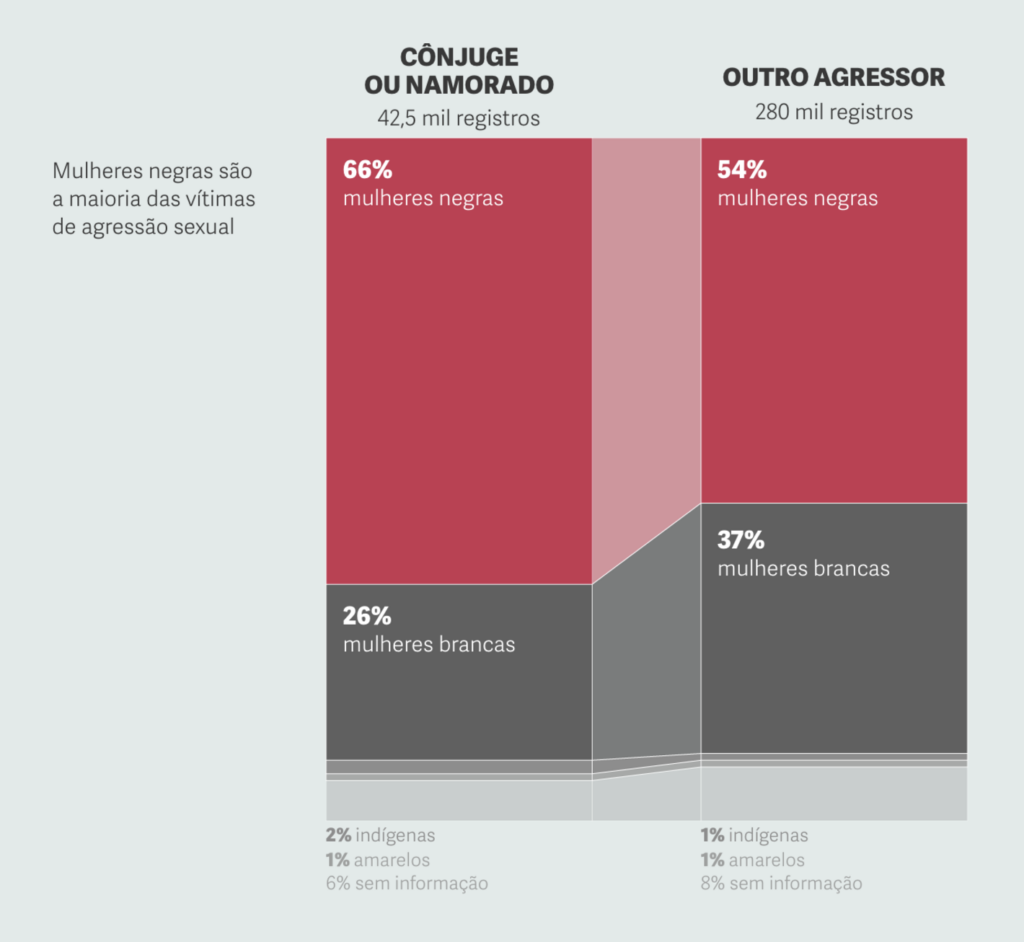
Unsurprising, sad, and always important to remember — violence against women is still a problem around the world:

elDiario.es: España protege de forma desigual a las víctimas de violencia de género: algunos juzgados rechazan el 70% de las órdenes, November 29
Gênero e Número: Cônjuges ou namorados são autores de um a cada oito estupros de mulheres no Brasil, November 28

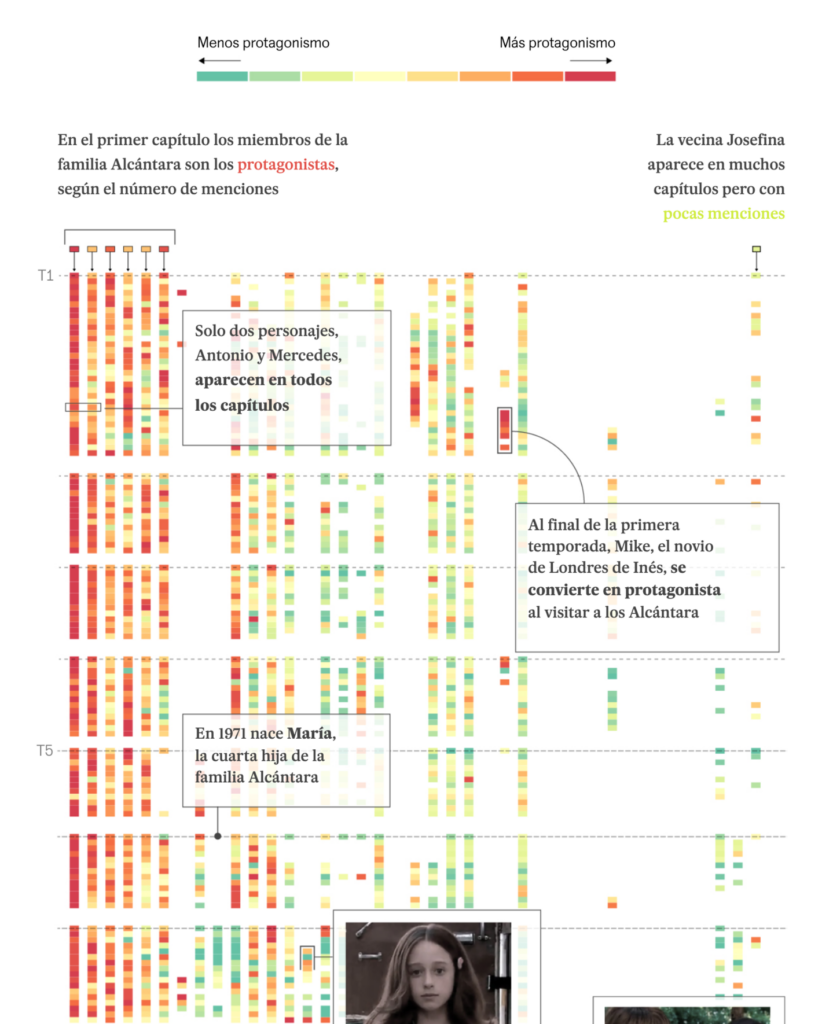
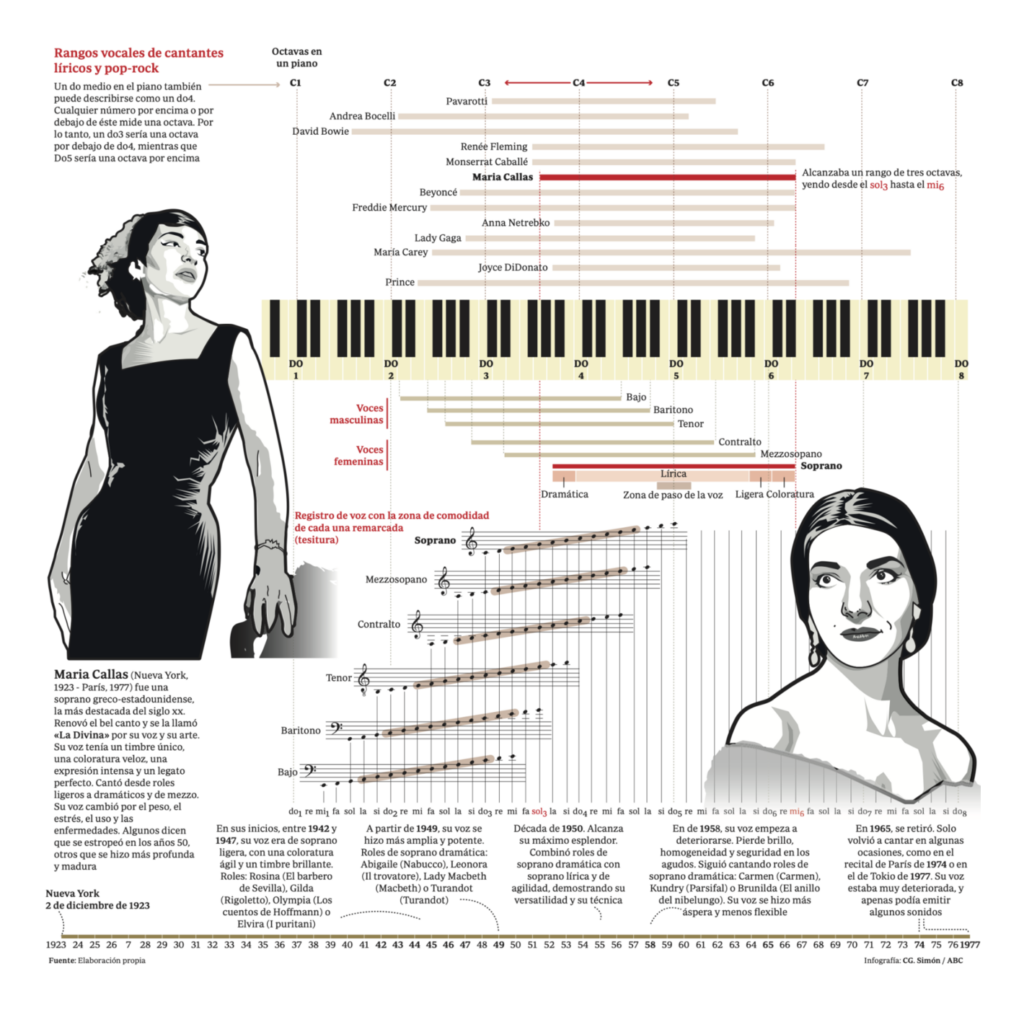
Let’s move on to something happier — memories in pop culture:

El País: Descifrando ‘Cuéntame’: 420 episodios y más de 1.000 personajes que han contado nuestras vidas, November 29
Diario ABC: Maria Callas, un caleidoscopio inagotable de colores, December 2

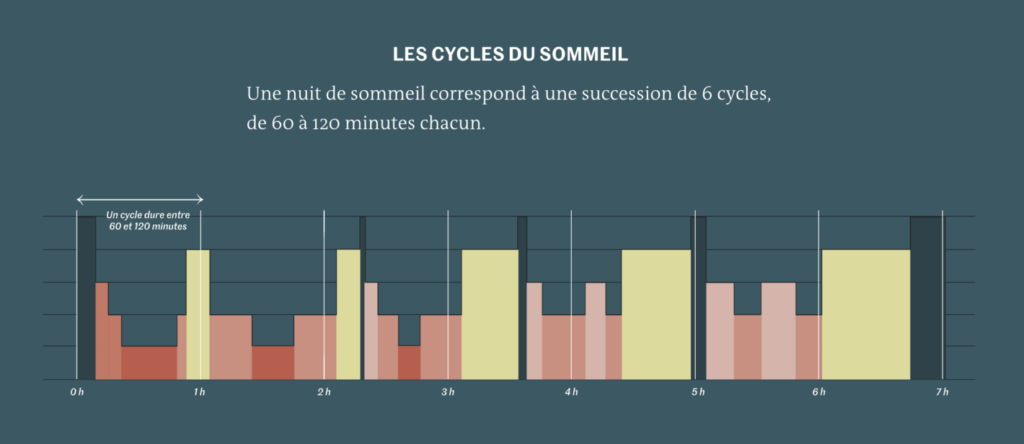
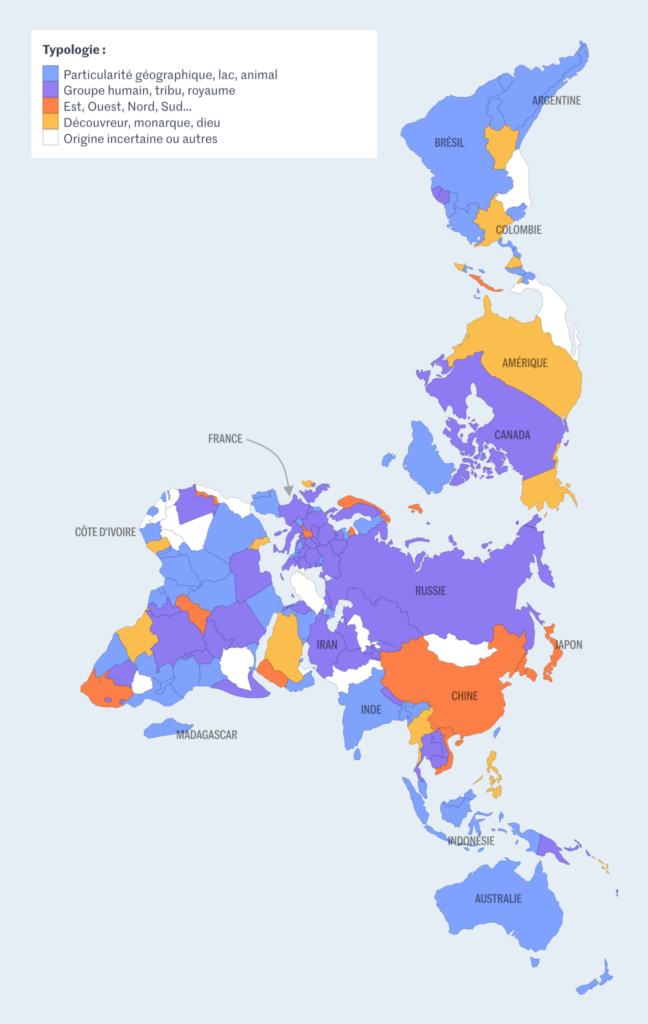
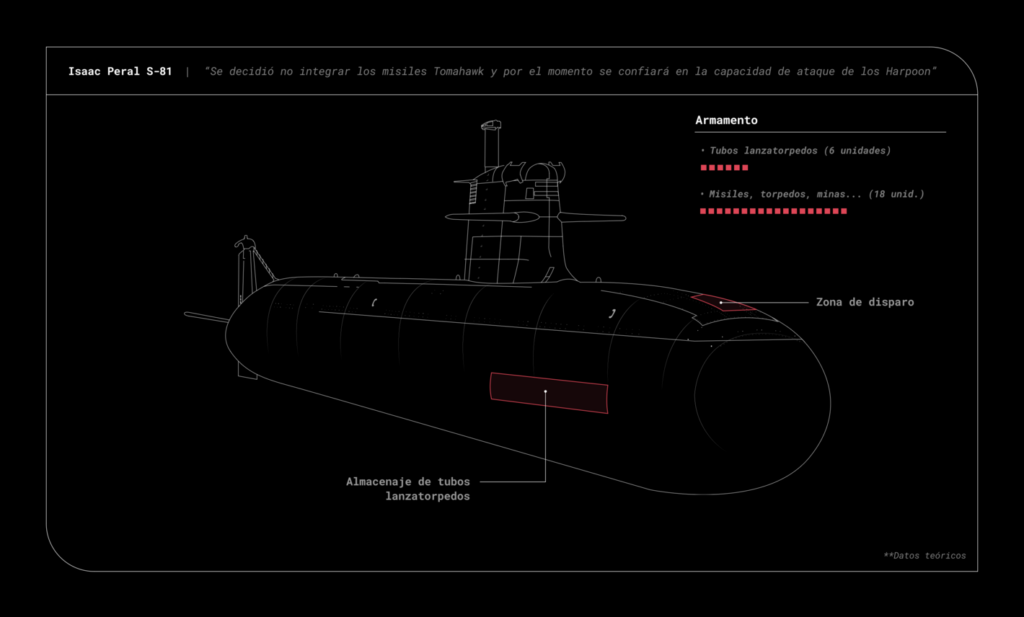
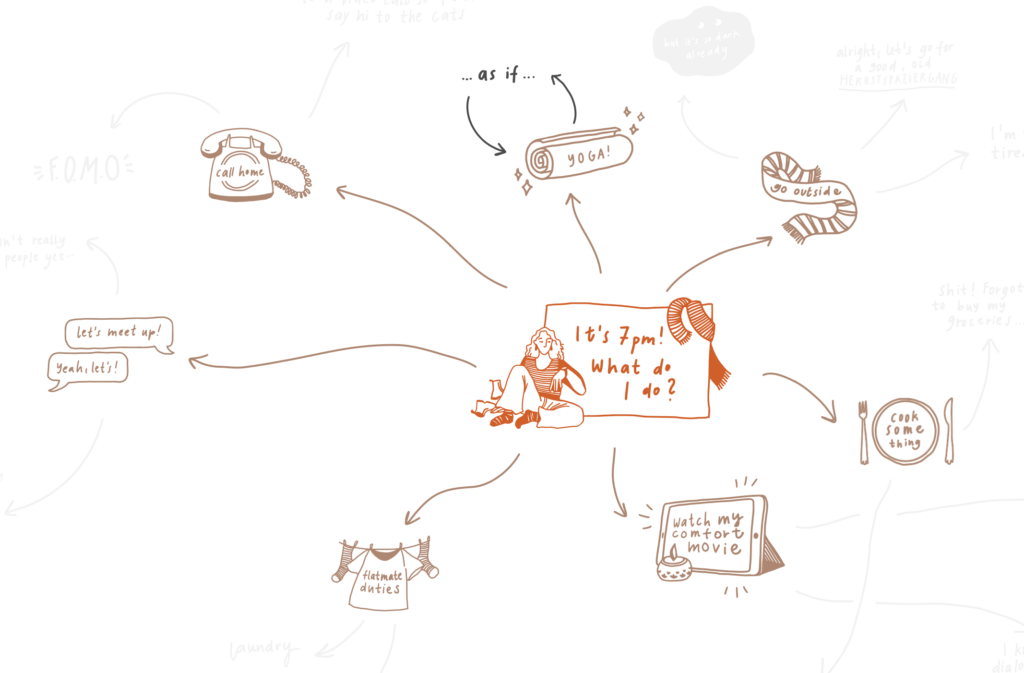
We also learned interesting things about sleep, the origin of country names, and submarines:

Le Monde: Dans les limbes des mécanismes du sommeil, November 28
Financial Times: Should we believe Americans when they say the economy is bad?, December 1
Le Monde: Découvrez l’origine de tous les noms de pays : « Hommes intègres », « nation centrale », « frontière des Danes »…, December 1
El Confidencial: Semblanza Con Todos Los Grises Del Primer Submarino Español: La Saga/fuga Del S-81 Isaac Peral, November 30

What else we found interesting

UCLAB Potsdam: “Last week @jona Pomerance presented the interactive and narrated #BetterCatastrophe flowchart at #infoplus2023 in Edinburgh. For this occasion we also released Interactive Flowchart as a free reusable template with detailed explanations of its structure, a visual step-by-step tutorial, and 12 student examples covering a range of well-known personal dilemmas,” (Mastodon, Project)
The Straits Times: The night chaos broke out: Little India riot, 10 years on, December 3
RJ Andrews: “By circulating dollar bills stamped with fact-based infographics, Occupy George informs the public of America’s daunting economic disparity one bill at a time,” December 2 (Tweet)

Applications are open for…


Help us make this dispatch better! We’d love to hear which newsletters, blogs, or social media accounts we need to follow to learn about interesting projects, especially from less-covered parts of the world (Asia, South America, Africa). Write us at hello@datawrapper.de or leave a comment below.

Want the Dispatch in your inbox every Tuesday? Sign up for our Blog Update newsletter!

Comments