This article is brought to you by Datawrapper, a data visualization tool for creating charts, maps, and tables. Learn more.
Data Vis Dispatch, February 20
The best of last week’s big and small data visualizations

Welcome back to the 130th edition of Data Vis Dispatch! Every week, we’ll be publishing a collection of the best small and large data visualizations we find, especially from news organizations — to celebrate data journalism, data visualization, simple charts, elaborate maps, and their creators.
Recurring topics this week include basketball, elections, and real estate.
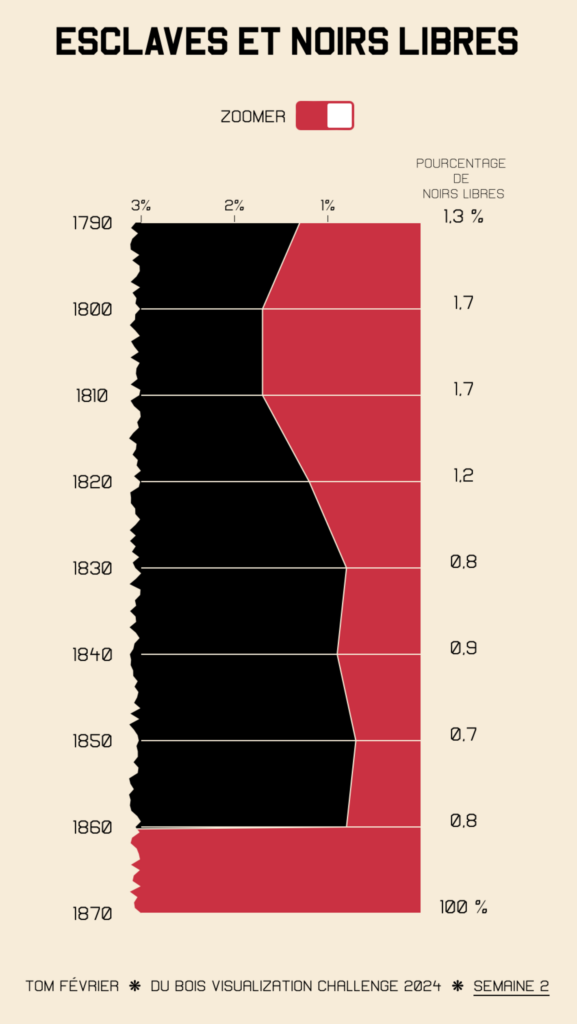
The #DuBoisChallenge2024 is a tribute to W.E.B. Du Bois, who changed the way that African Americans were viewed through a series of impactful data visualizations. Here is a recreation of one of his charts:
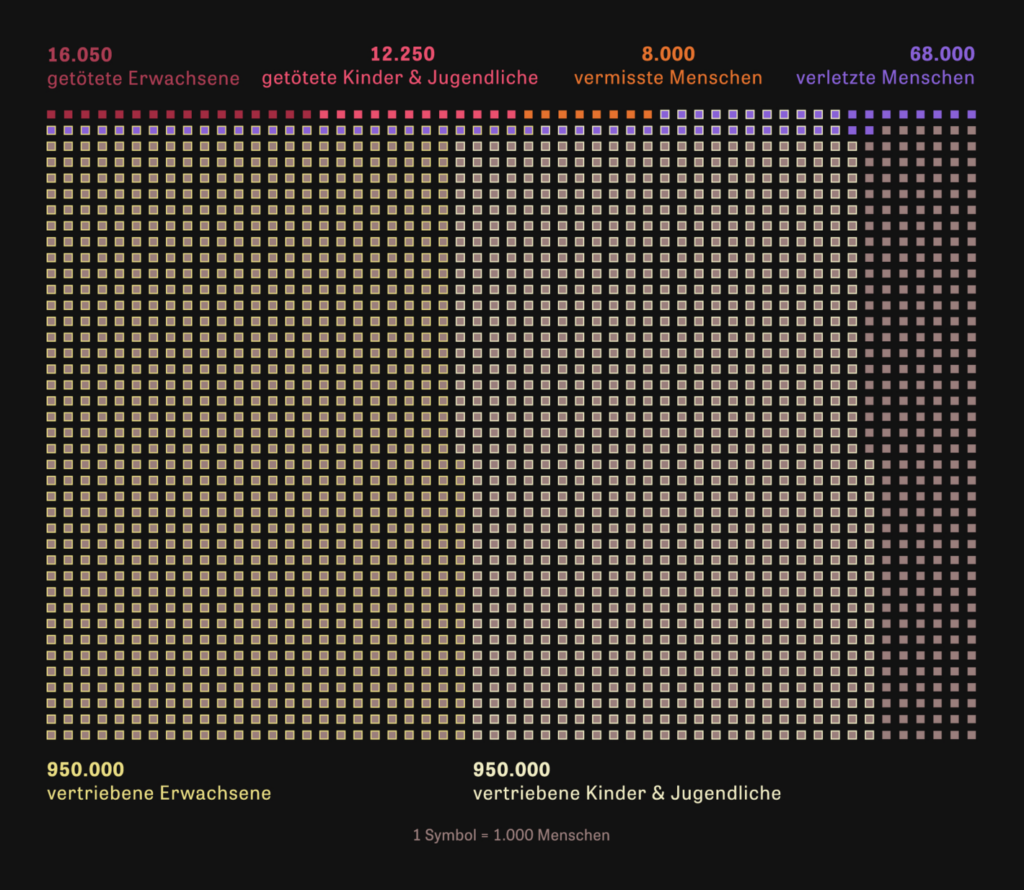
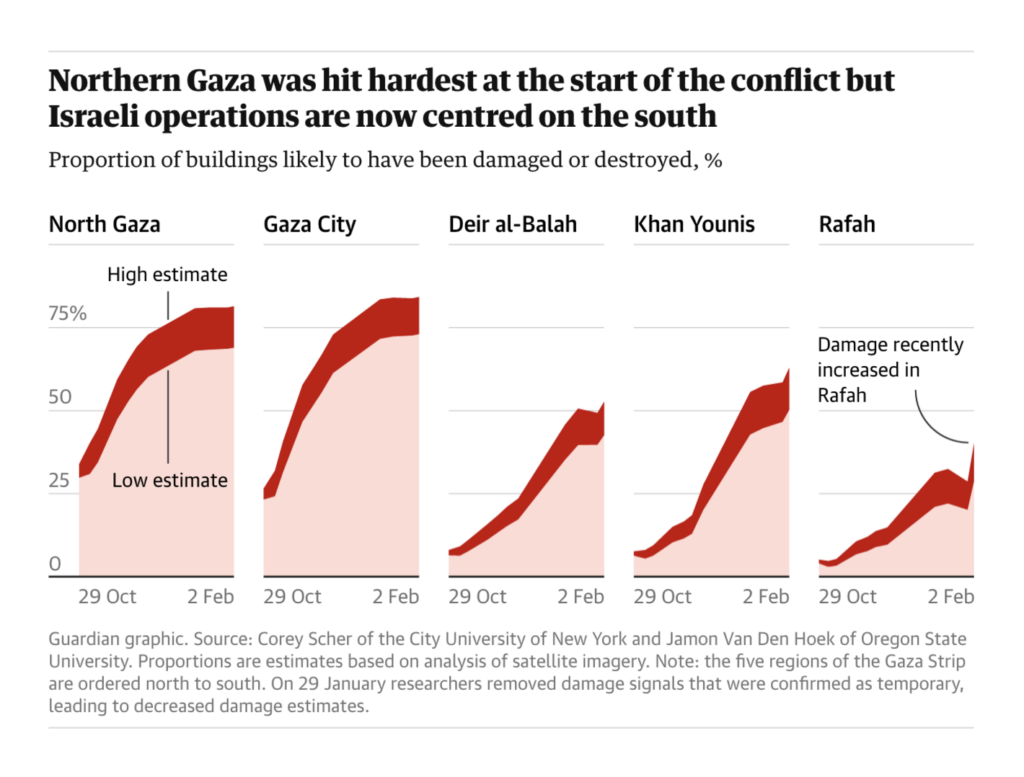
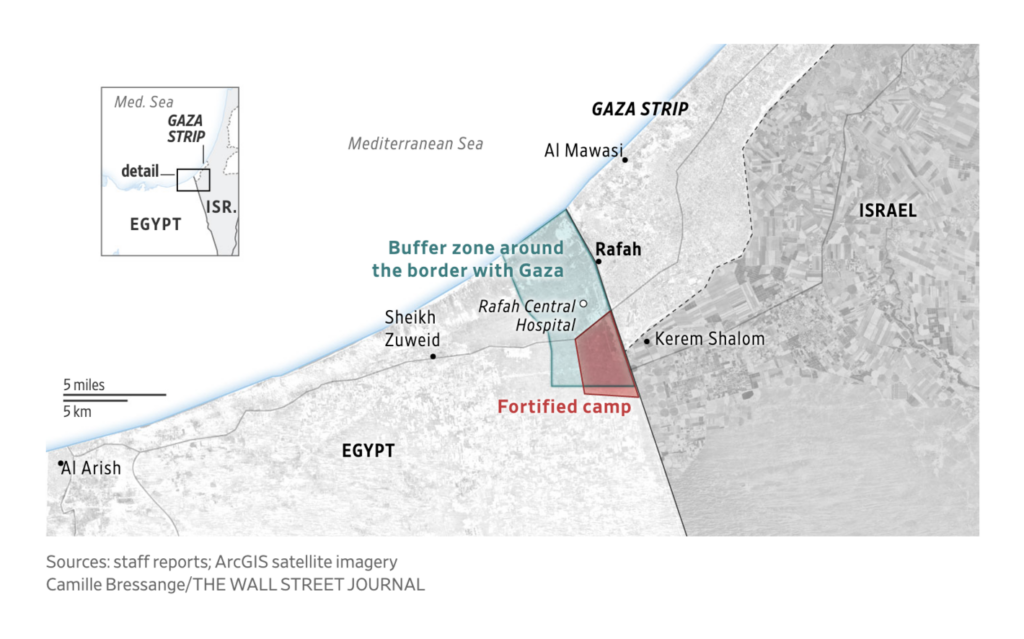
After more than 130 days of war in the Gaza Strip, we found visualizations of the killed, missing, and displaced; the increasing threat to the city of Rafah; and Egypt’s efforts to build a buffer zone on its border:
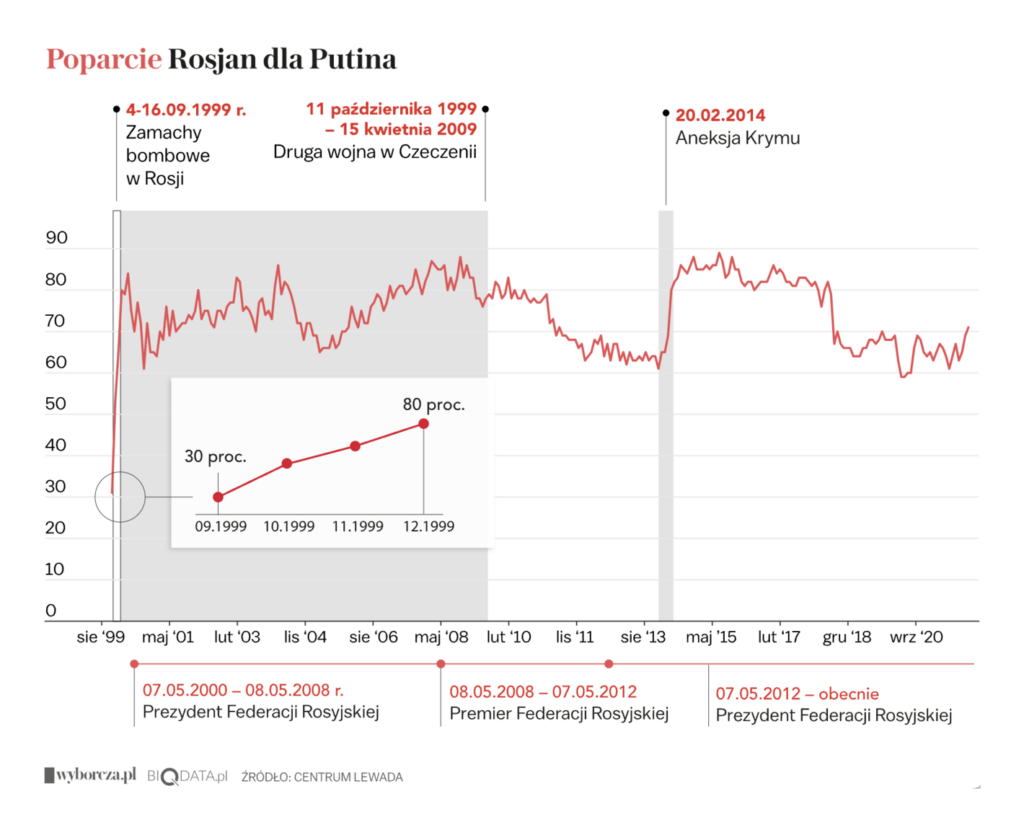
With the death of Alexei Navalny in an Arctic penal colony, Putin’s way of governing came into focus this week:
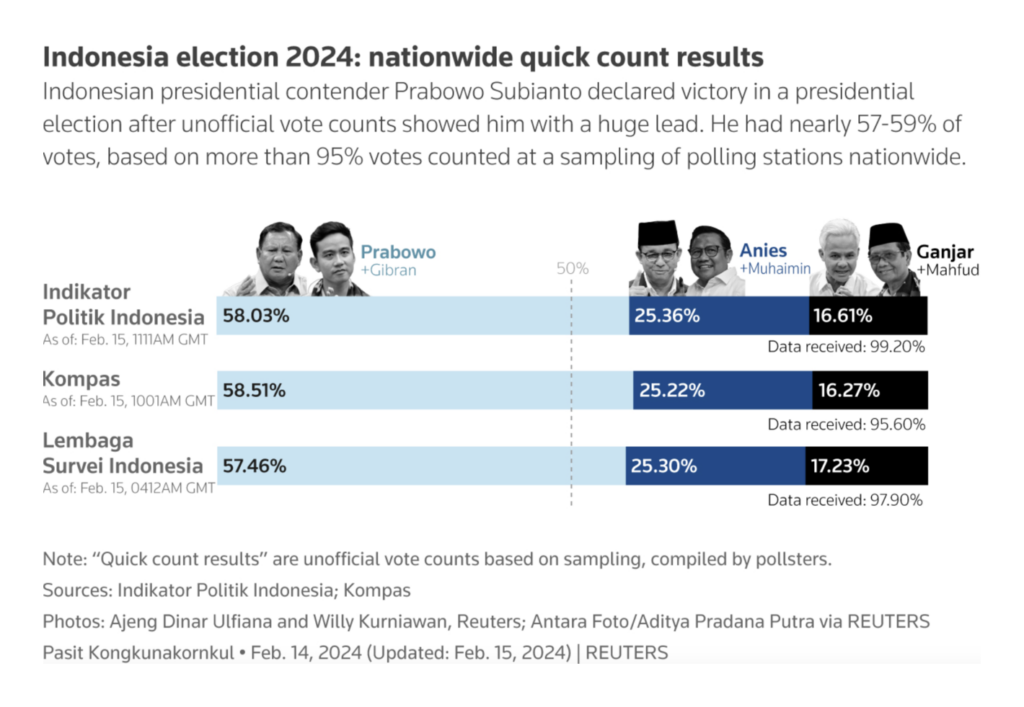
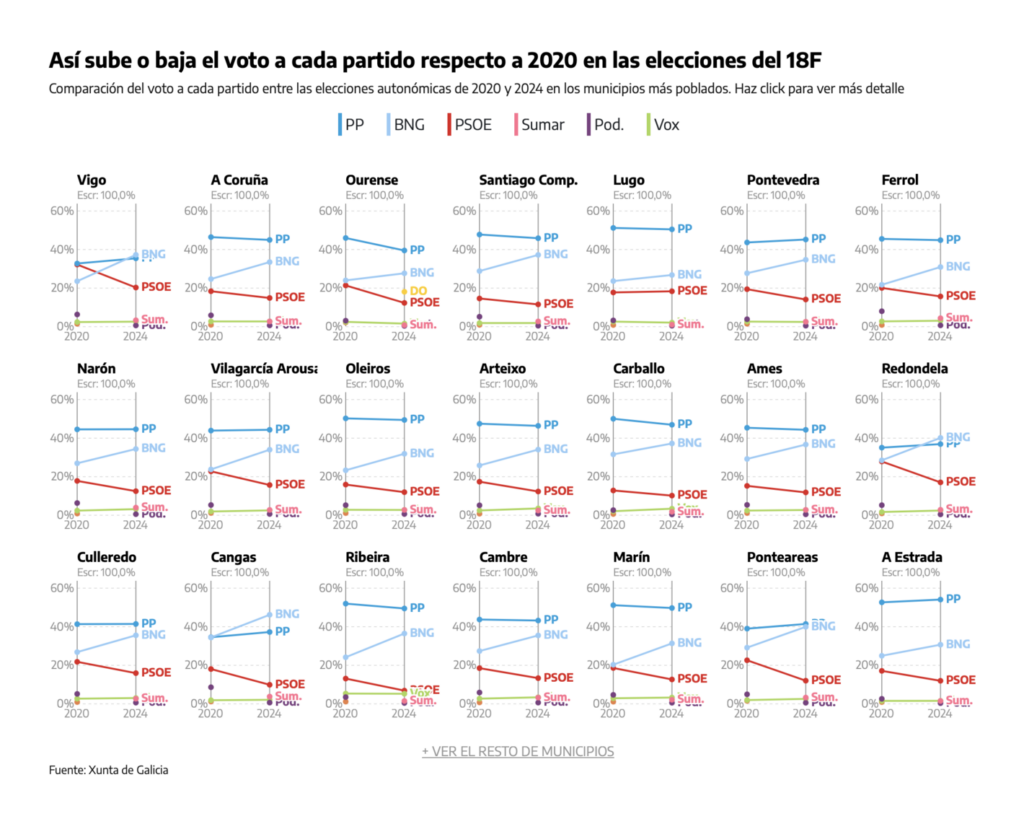
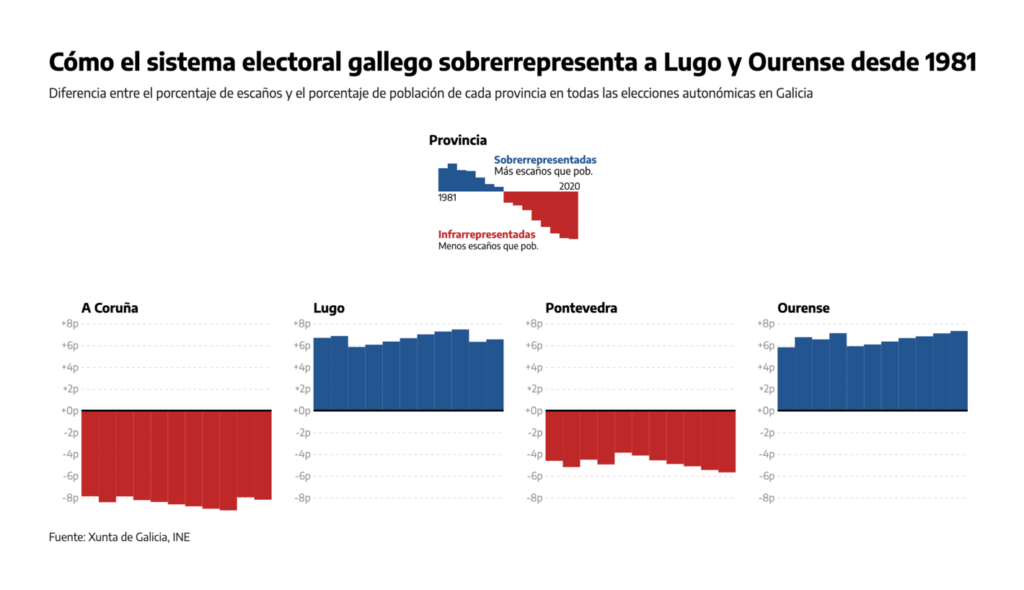
Remember the first Dispatch of 2024 talking about a global year of elections? Here we have national elections in Indonesia and regional ones in Galicia:
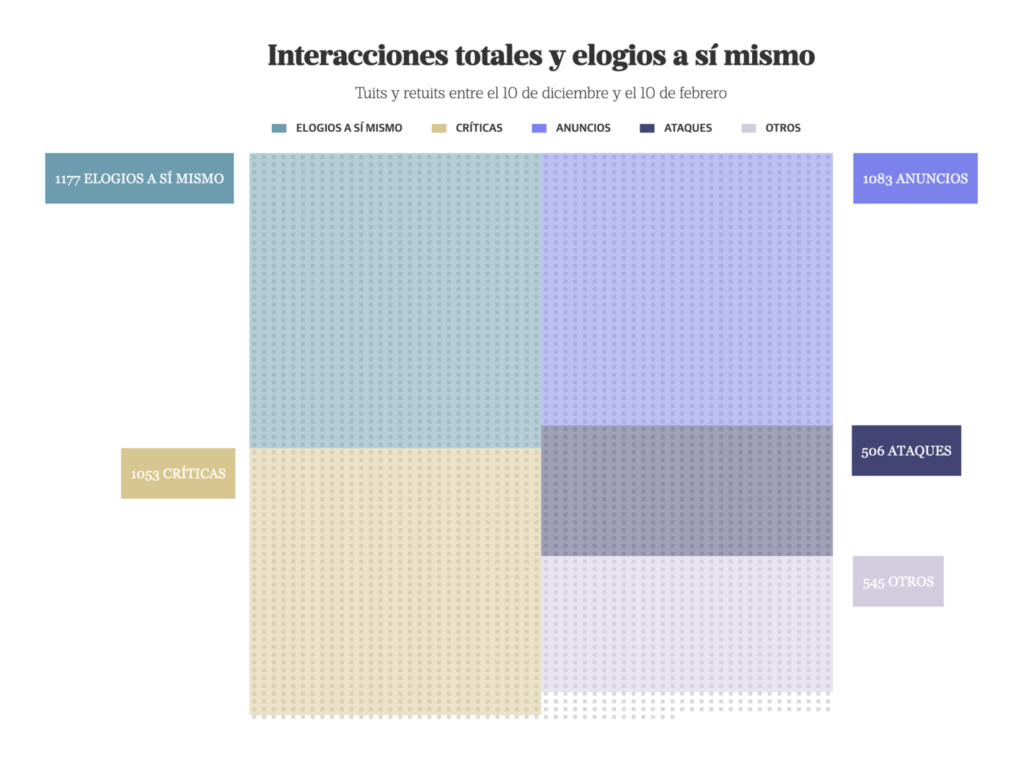
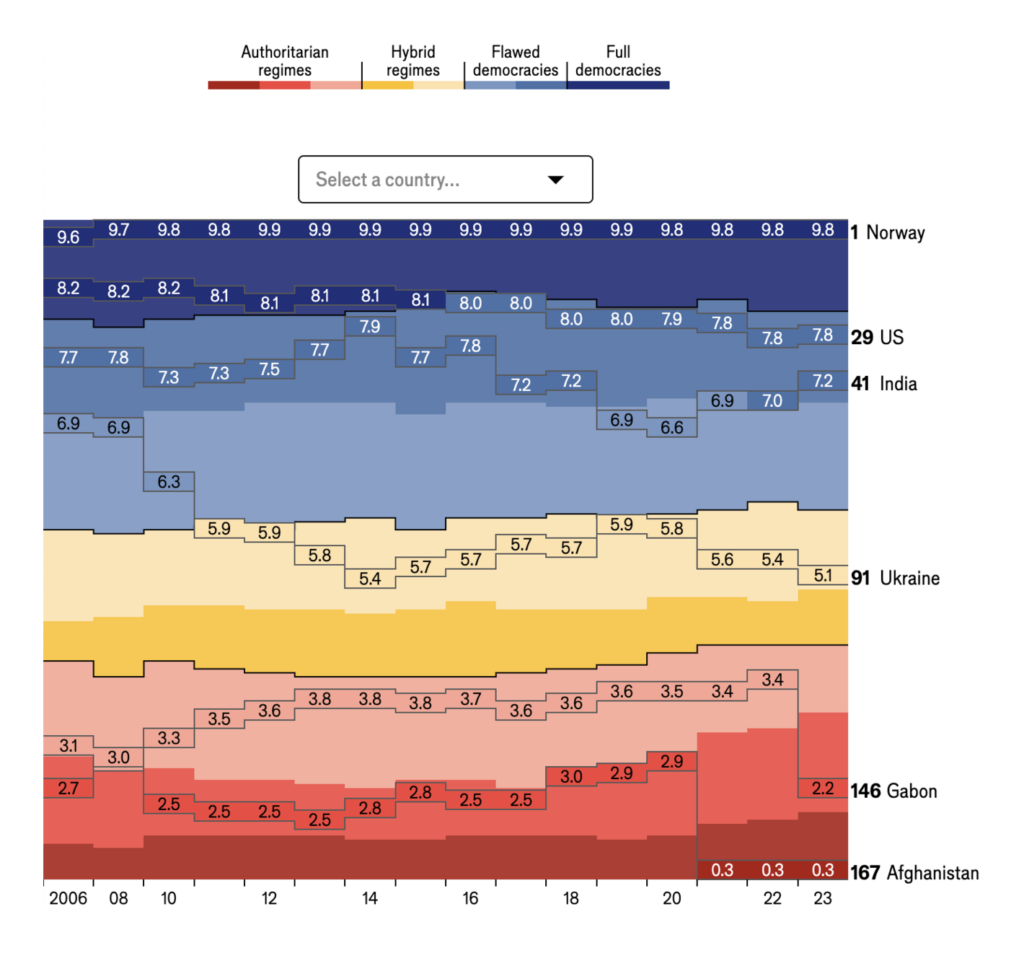
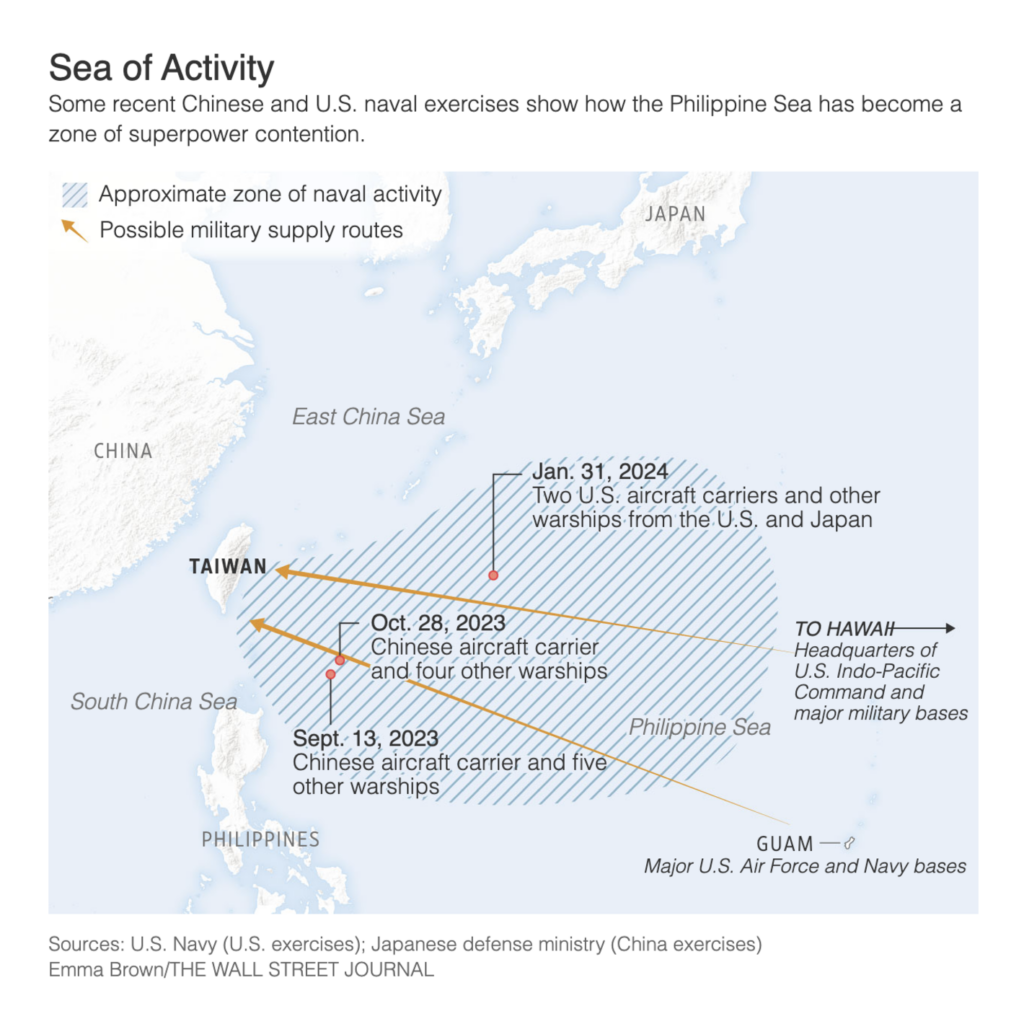
Other political visualizations covered the social media behavior of Argentina’s president, democracies at risk, and U.S. and Chinese activities off the coast of Taiwan:
We still can’t stop creating clusters of small multiples:
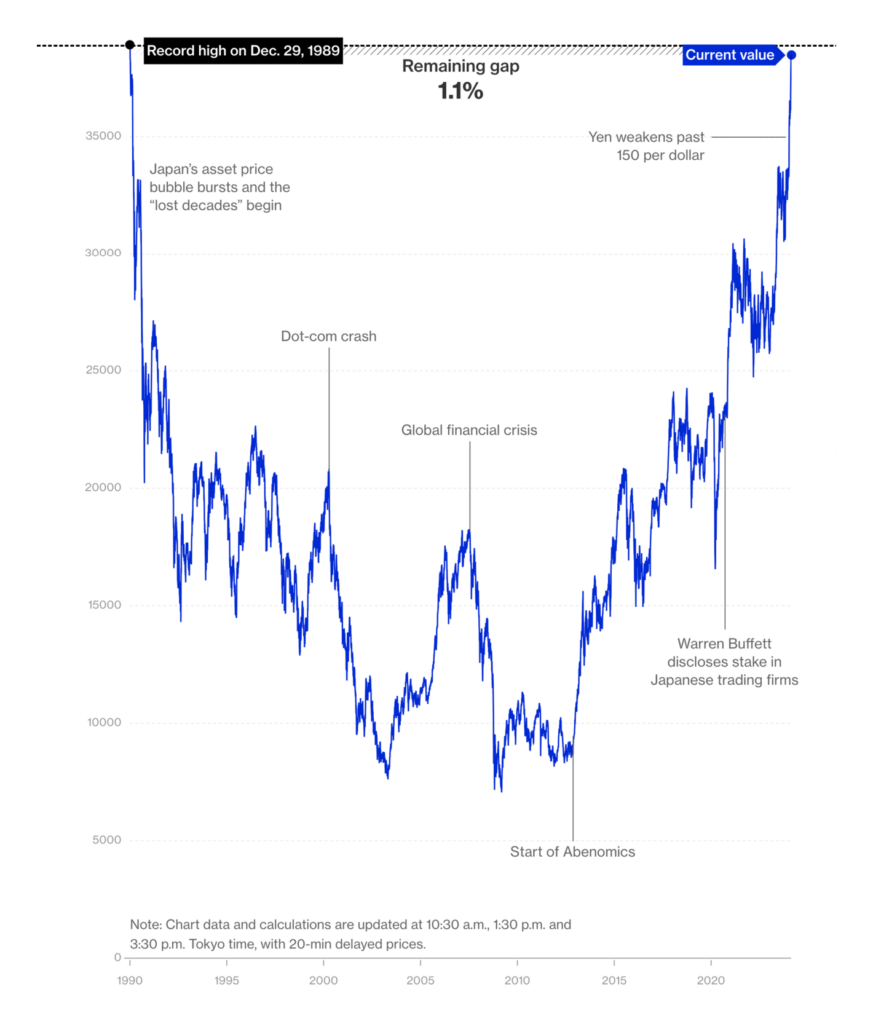
But with all our love for the small multiple line chart, let’s not forget its older sibling, the simple but effective line chart:
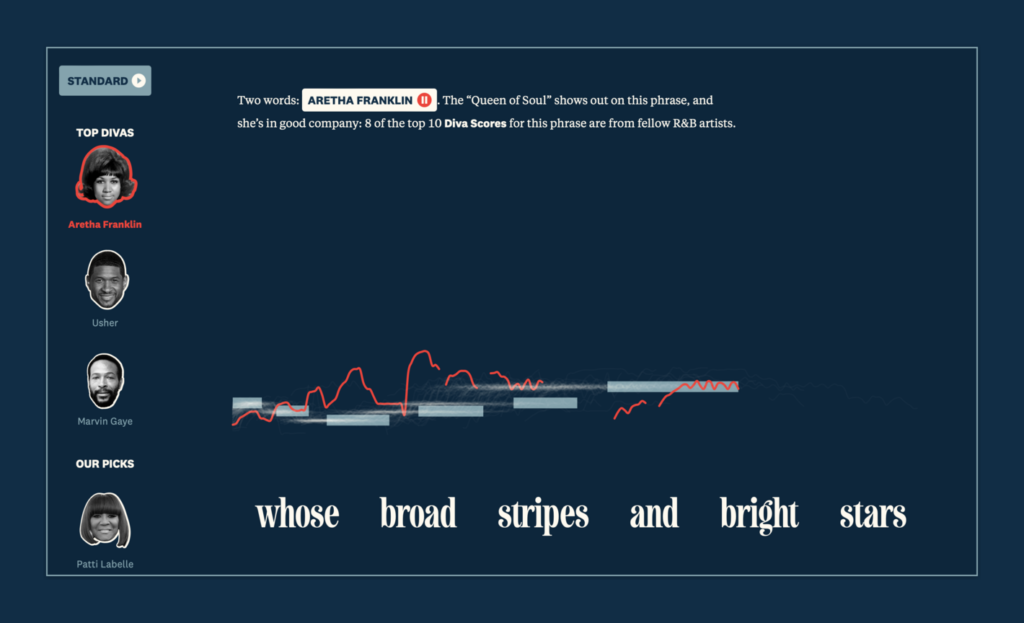
Line charts can even be used in an experimental way to decode a national anthem:
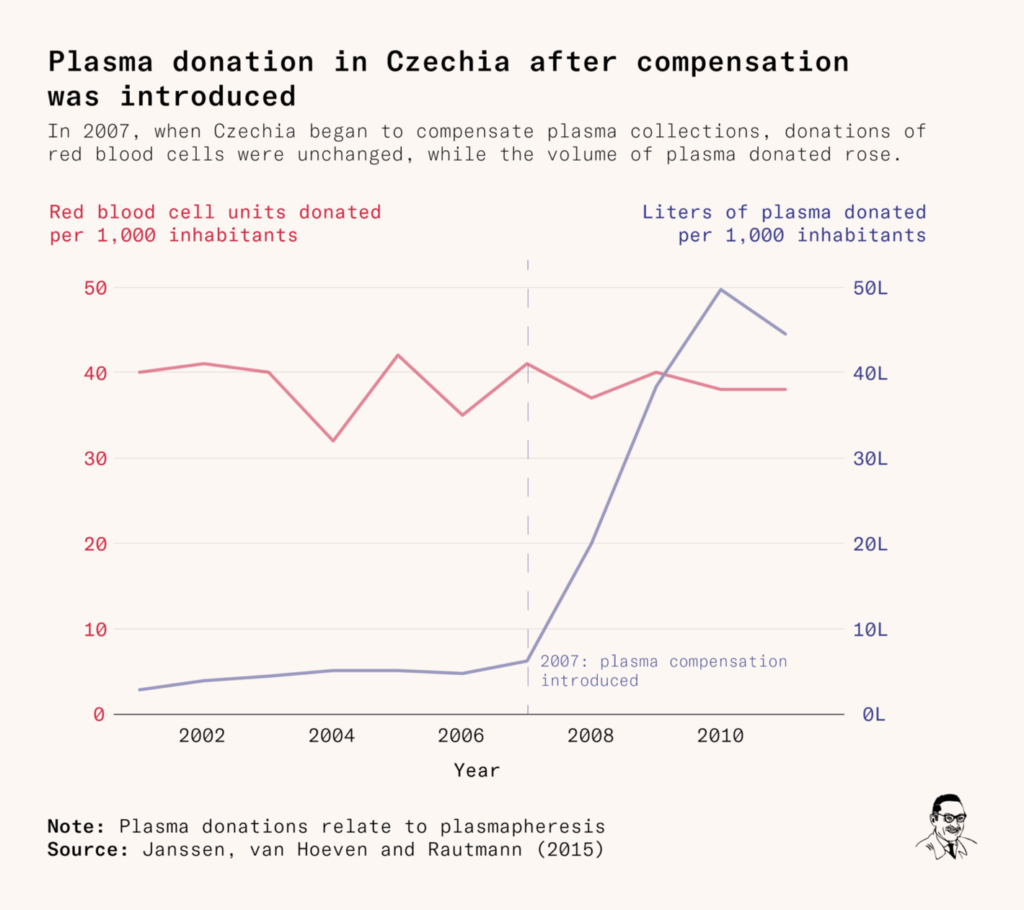
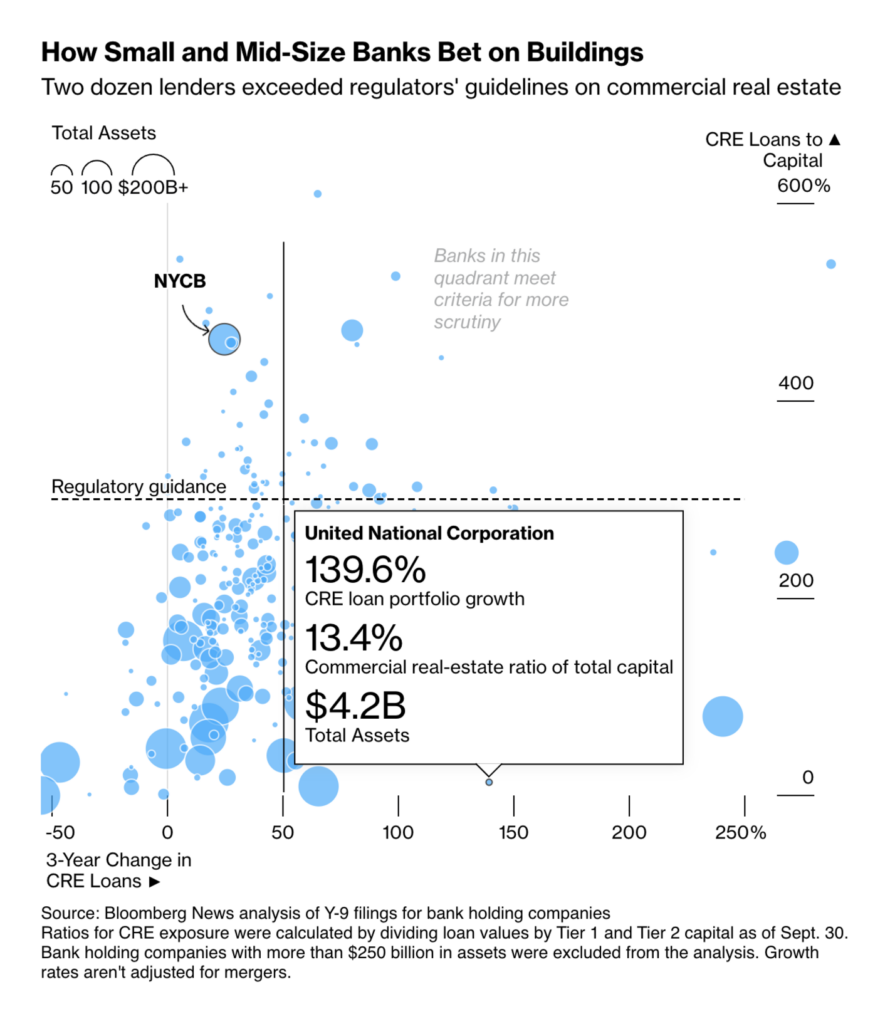
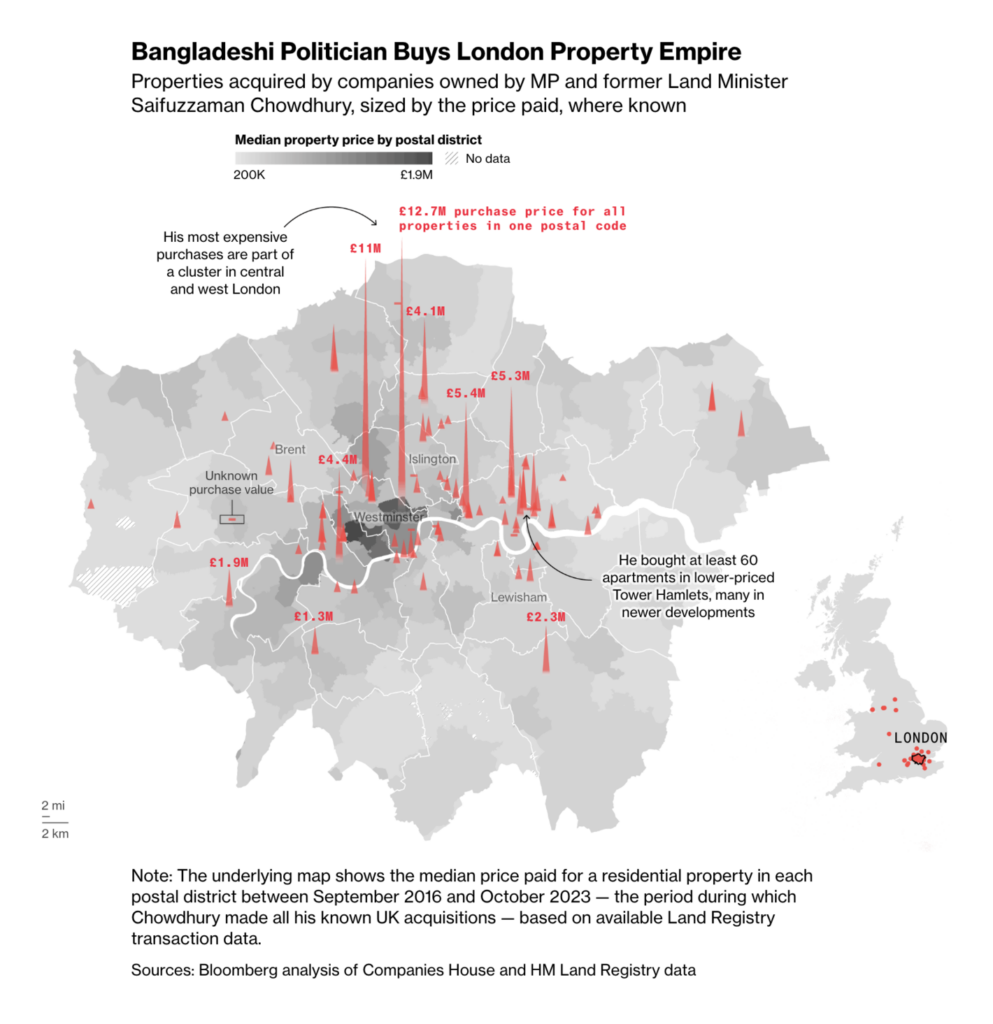
Two data visualizations featured real estate loans and transactions:
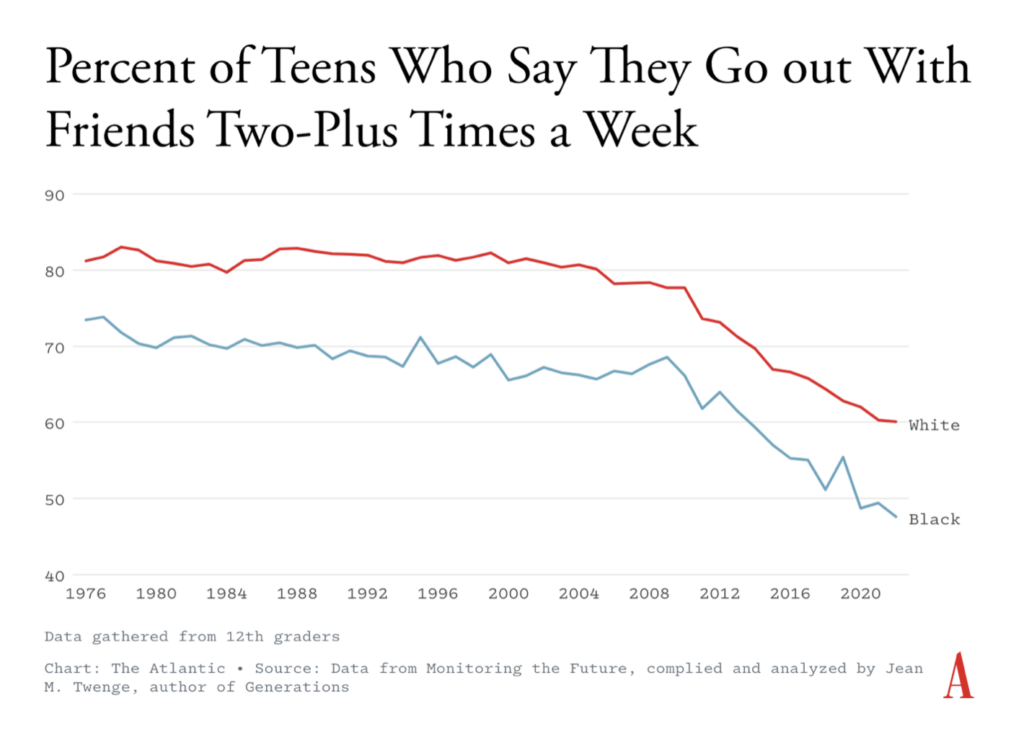
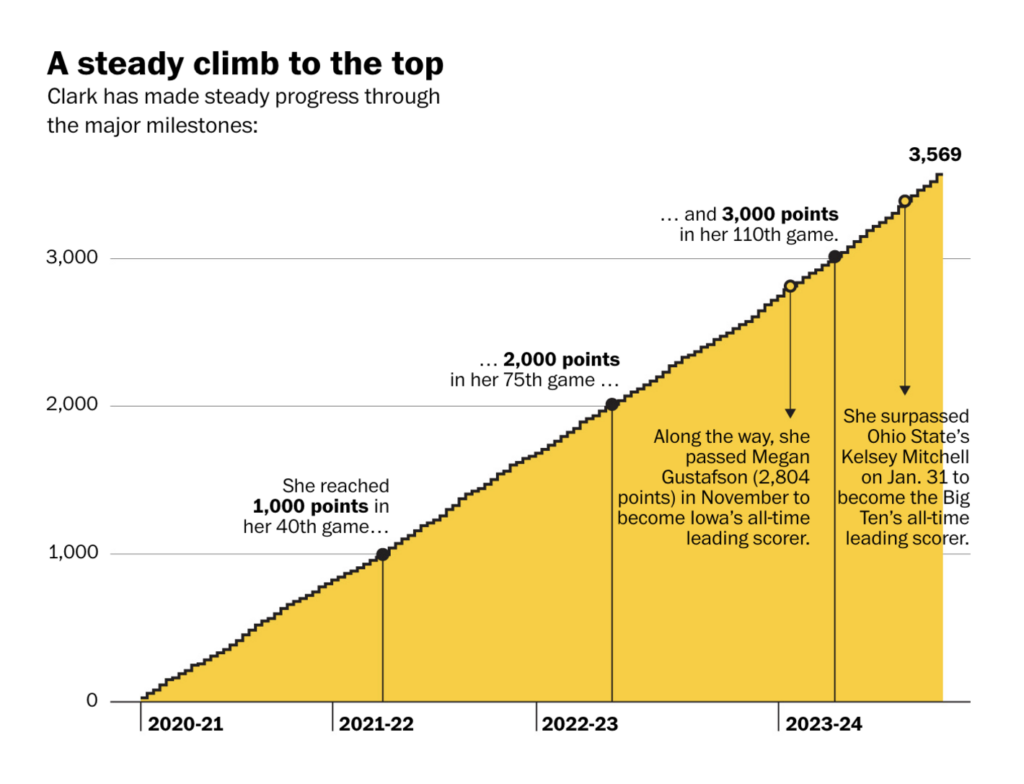
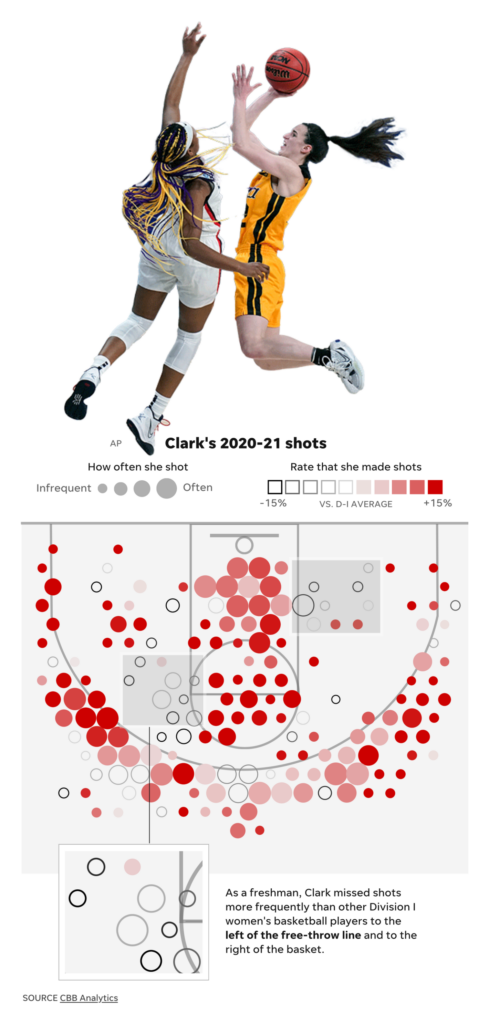
This week was all about sports, especially the rise of Caitlin Clark as the face of women’s basketball:

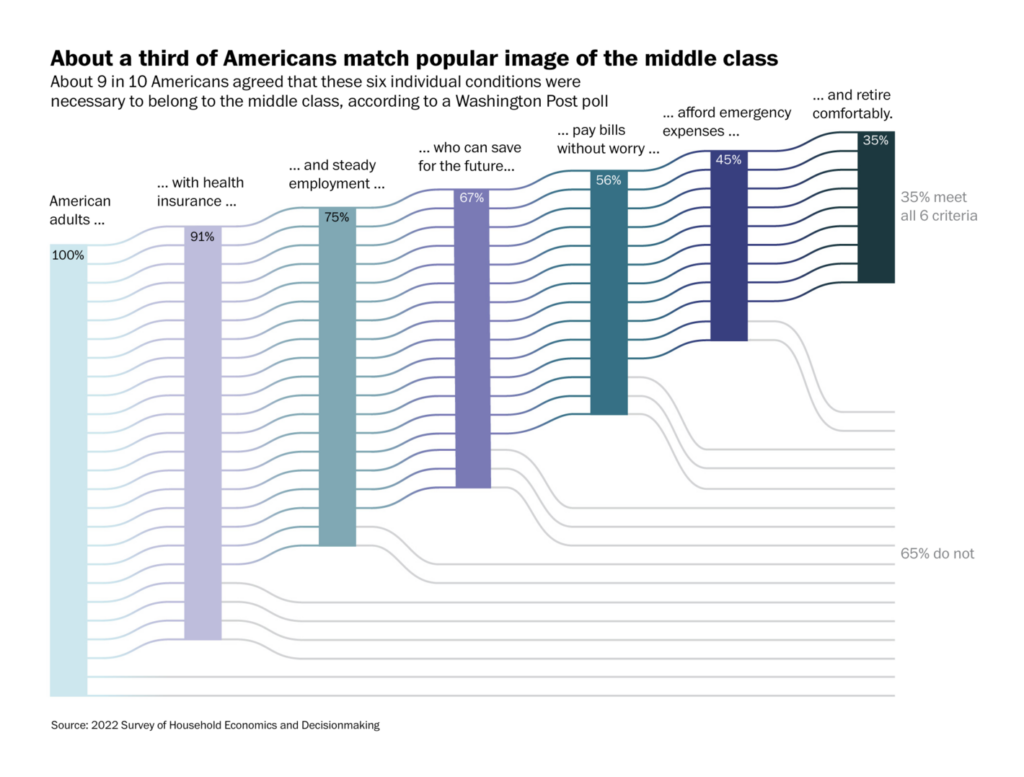
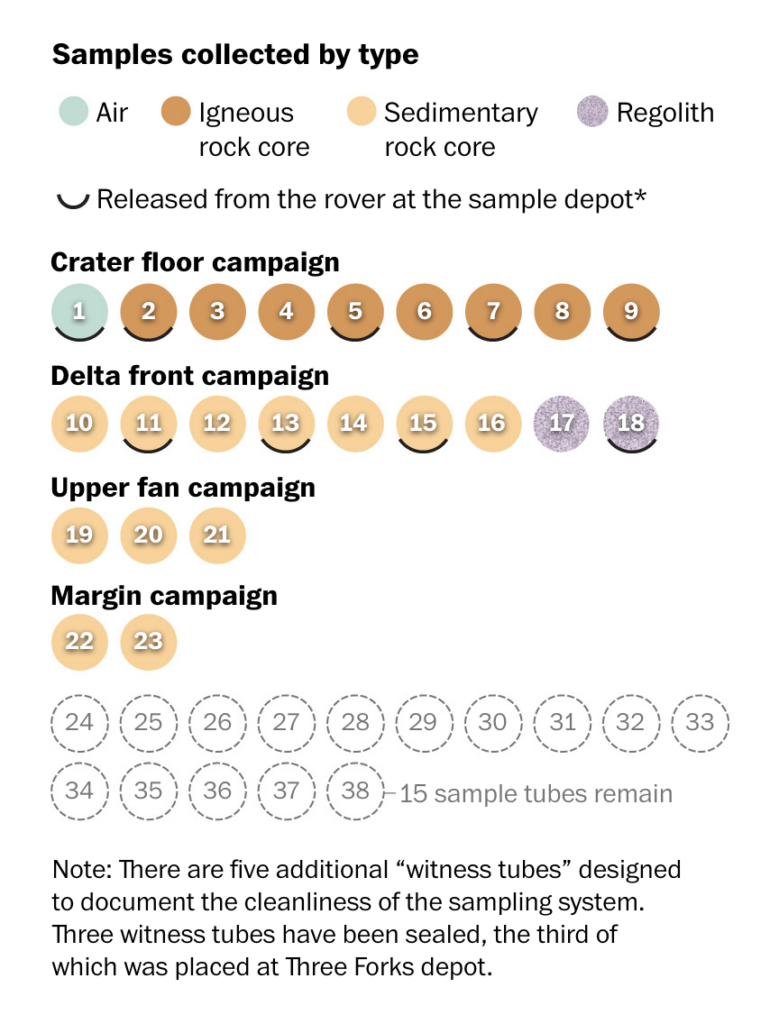
Finally, a shoutout to the Washington Post for two beautiful visualizations of Americans’ class perceptions and NASA’s Mars rover tracking:
What else we found interesting

Applications are open for…
- A senior data visualization reporter at PSE Healthy Energy
Help us make this dispatch better! We’d love to hear which newsletters, blogs, or social media accounts we need to follow to learn about interesting projects, especially from less-covered parts of the world (Asia, South America, Africa). Write us at hello@datawrapper.de or leave a comment below.
Want the Dispatch in your inbox every Tuesday? Sign up for our Blog Update newsletter!


Comments