This article is brought to you by Datawrapper, a data visualization tool for creating charts, maps, and tables. Learn more.
Data Vis Dispatch, July 12
The best of last week’s big and small data visualizations

Welcome back to the 53rd edition of Data Vis Dispatch! Every week, we’ll be publishing a collection of the best small and large data visualizations we find, especially from news organizations — to celebrate data journalism, data visualization, simple charts, elaborate maps, and their creators.
Recurring topics this week include wildlife habitats, resurgent COVID cases, and the resignation of Boris Johnson.
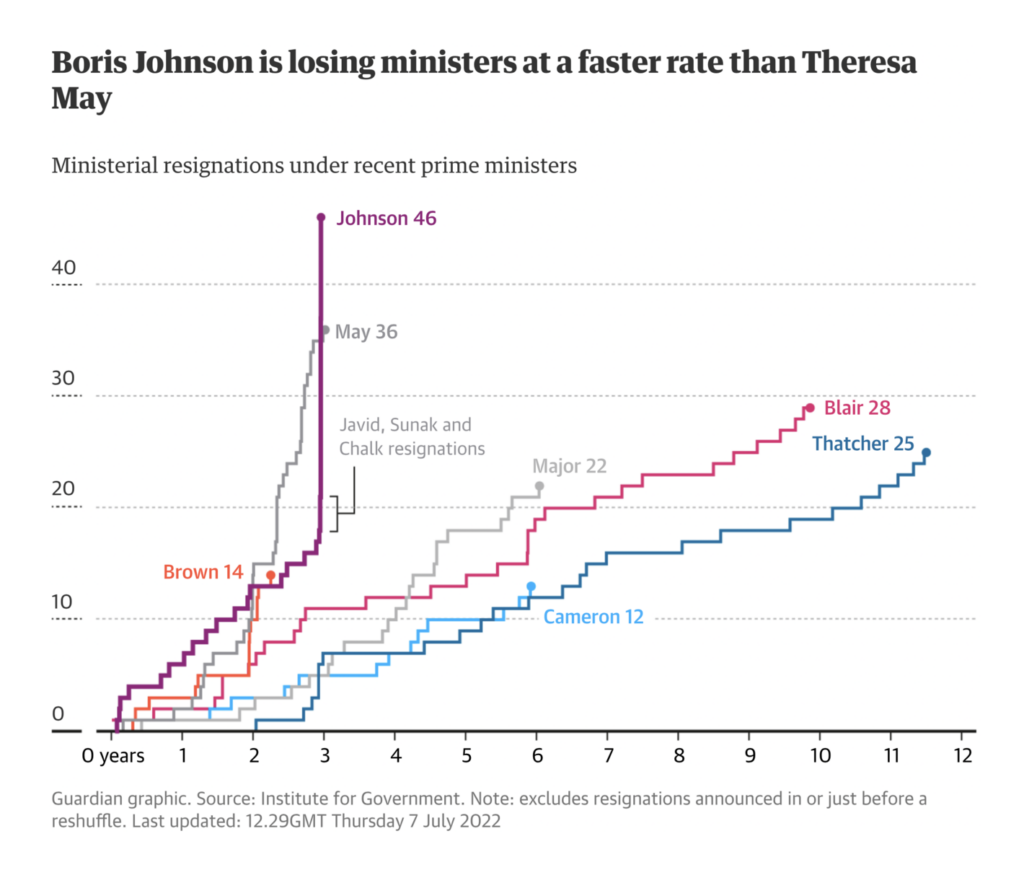
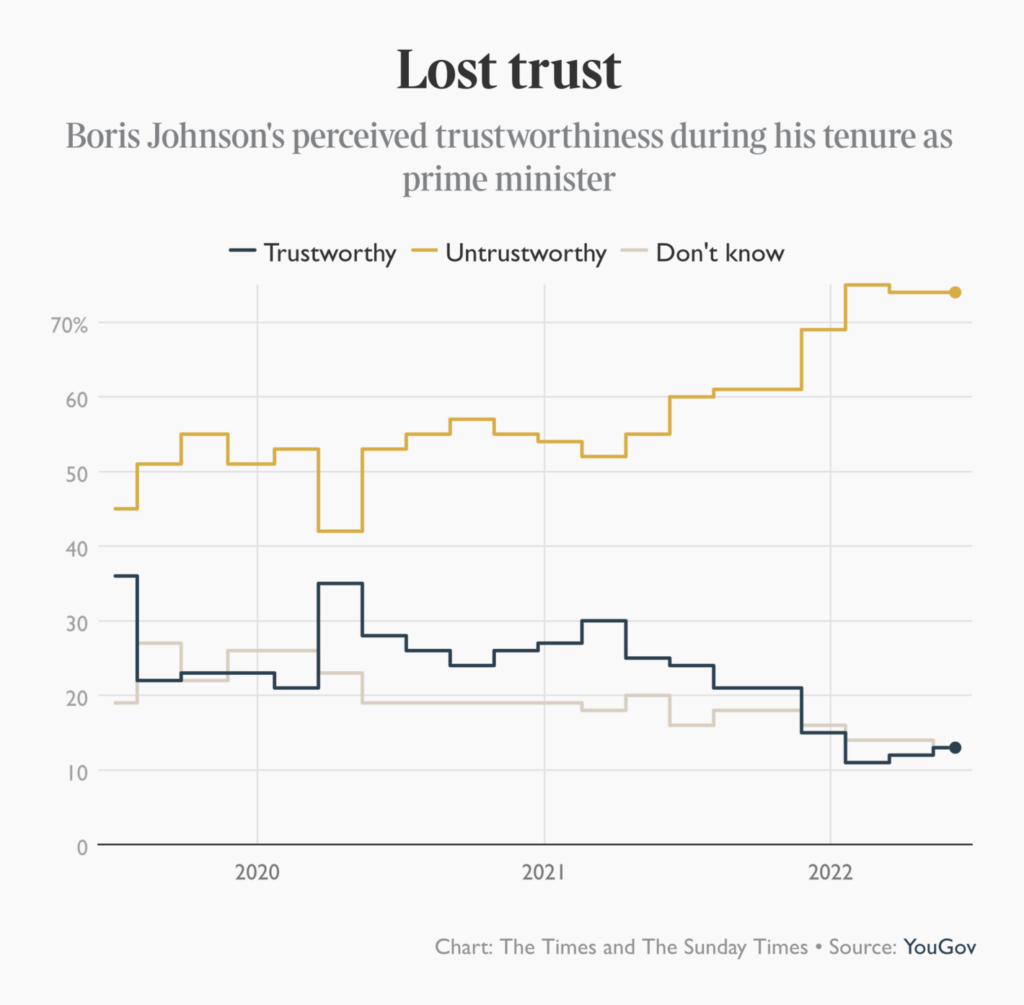
Boris Johnson announced he would step down as prime minister on Thursday, after mass resignations from his government:
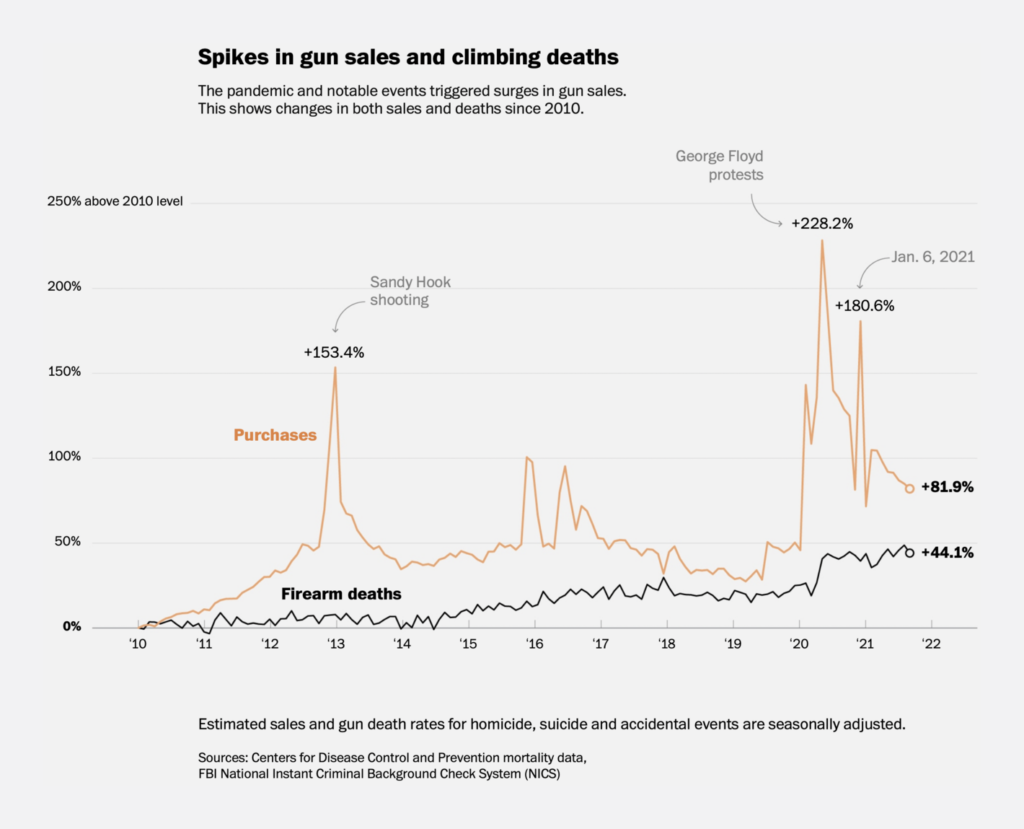
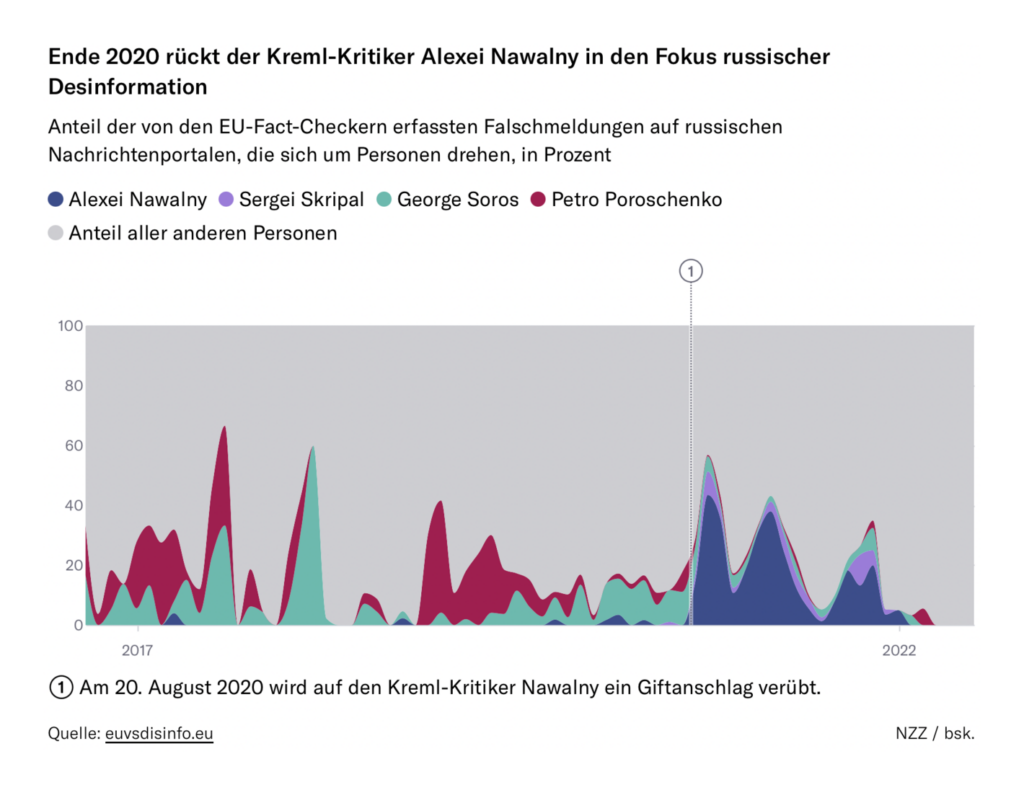
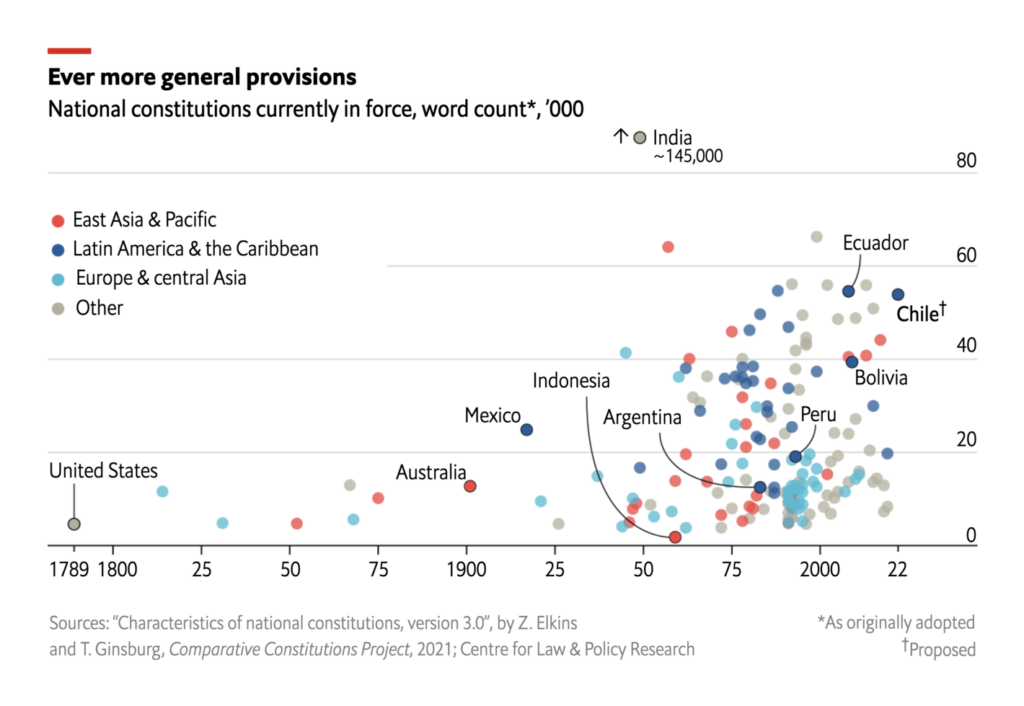
Other political charts showed gun sales against civil instability, government targeting of opposition figures, and constitutions around the world:
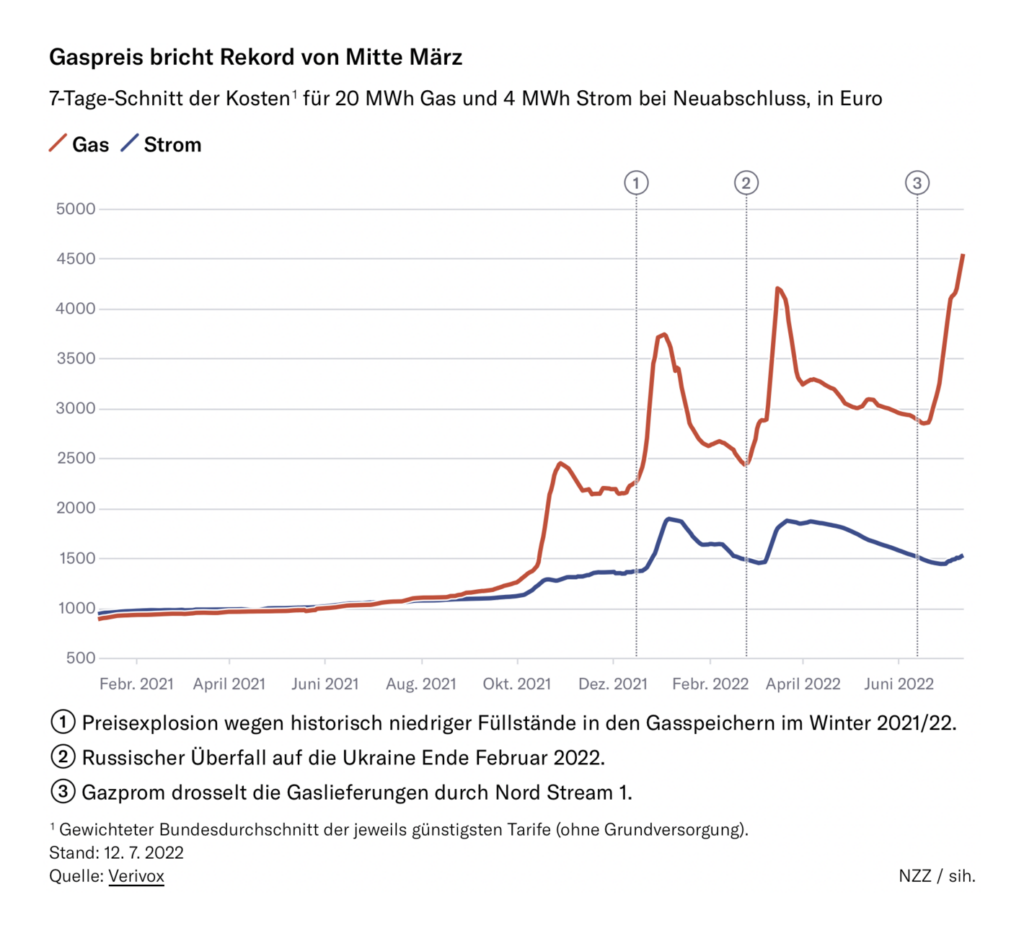
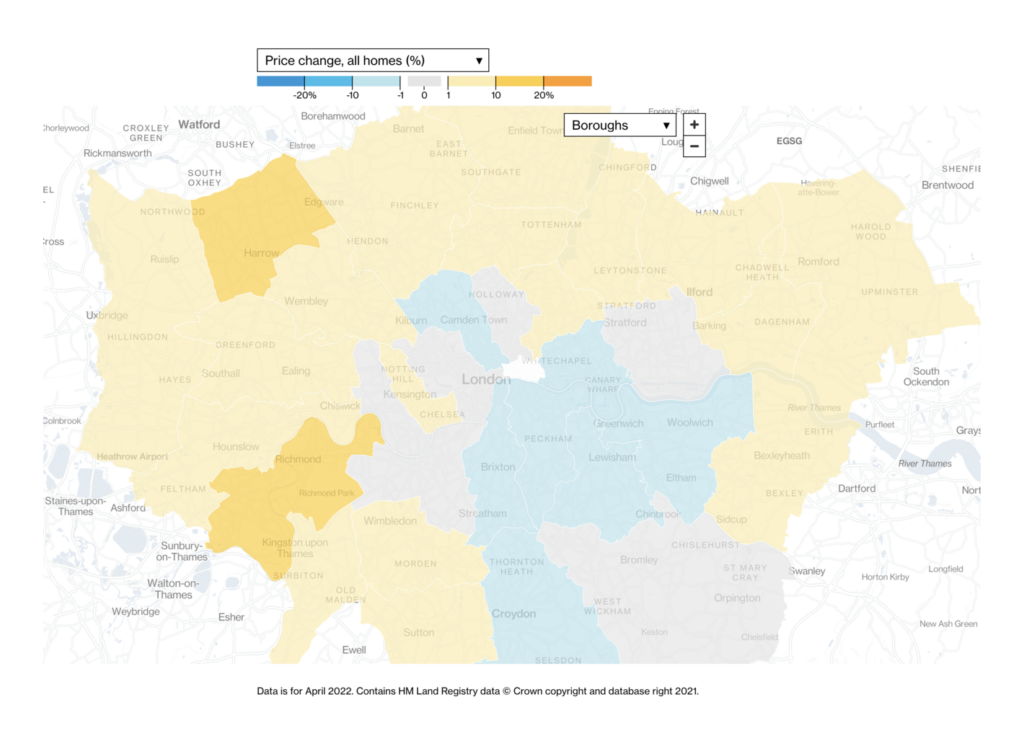
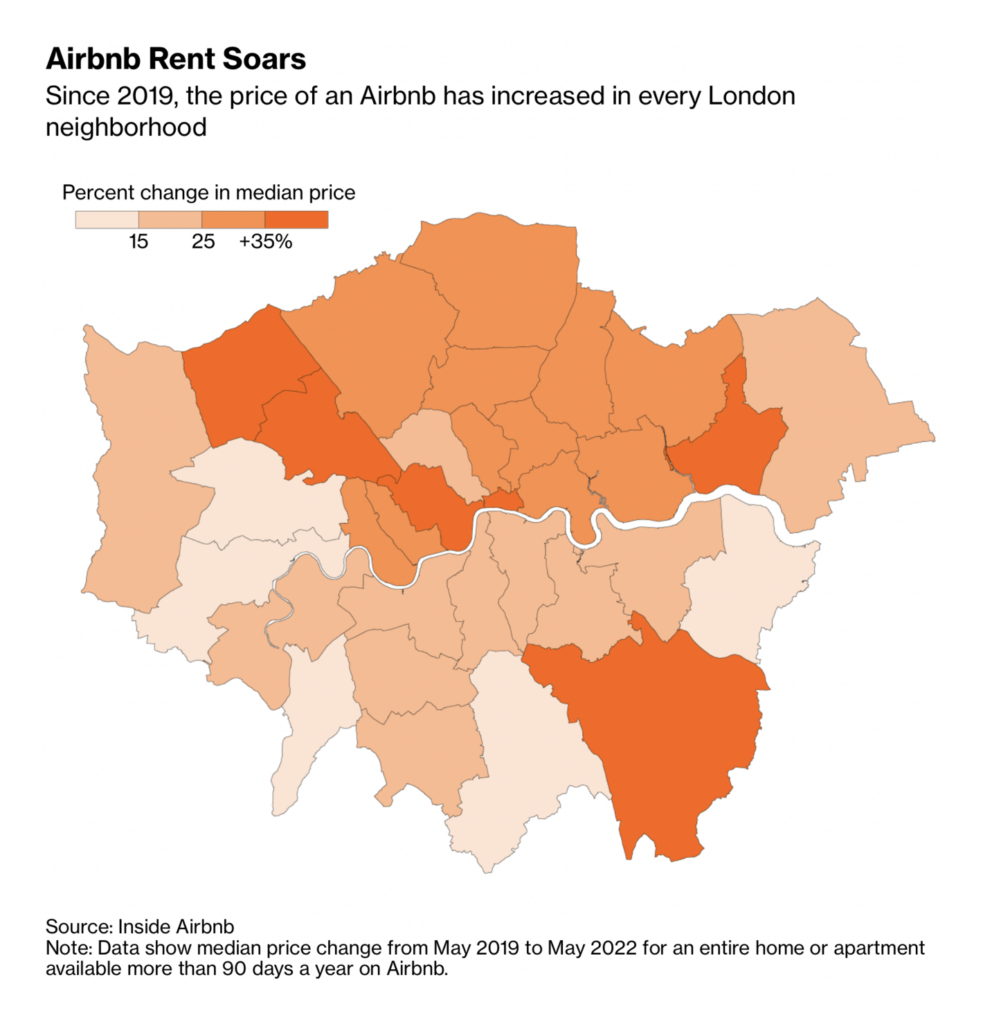
Economic charts focused on rising prices and weak currencies:
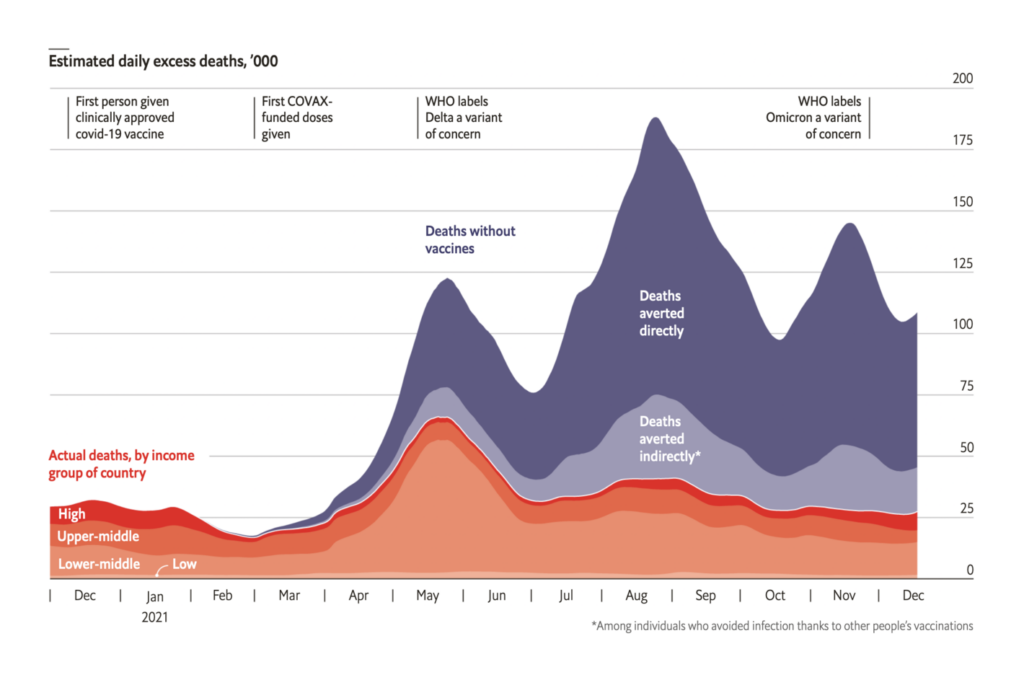
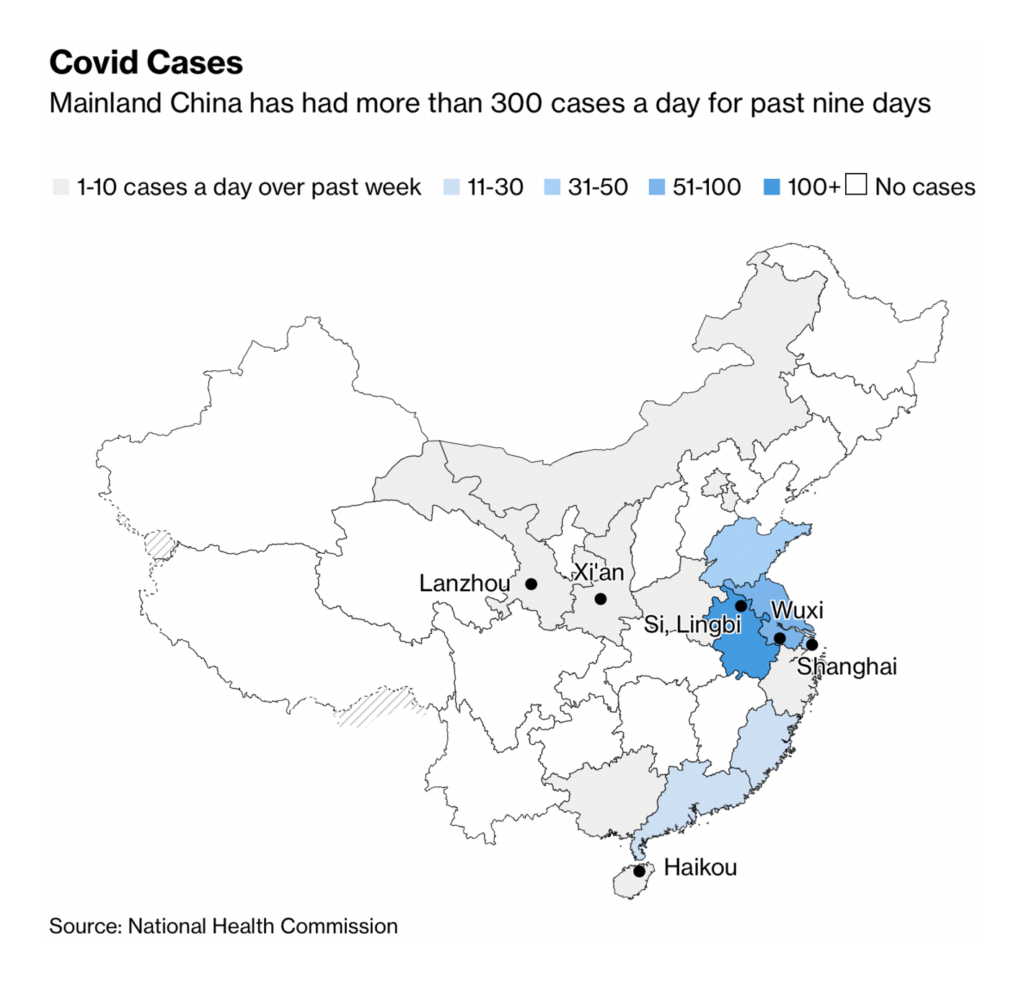
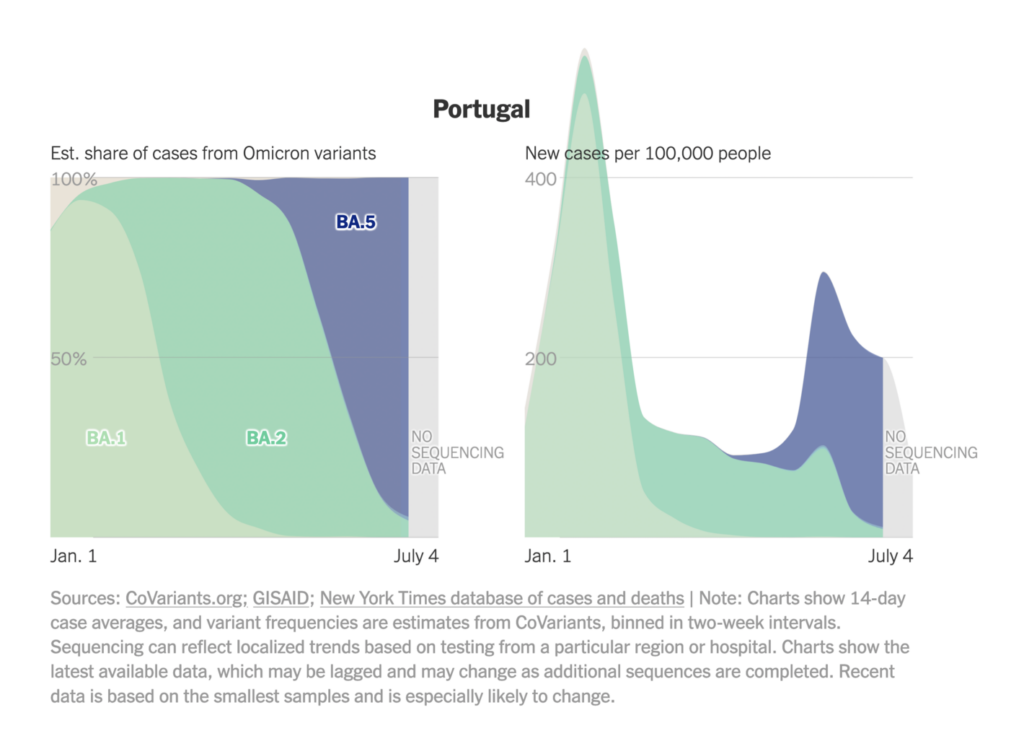
COVID cases are rising again, thanks in part to new Omicron subvariants:
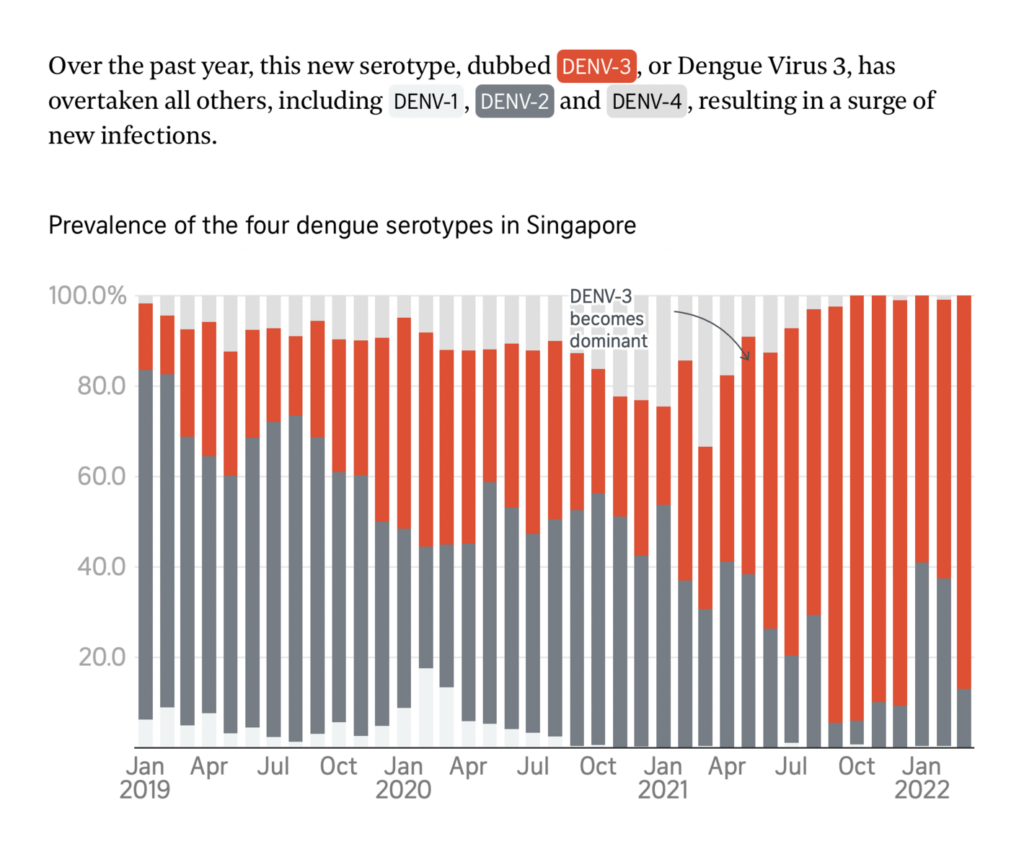
We also saw variant tracking for dengue fever:
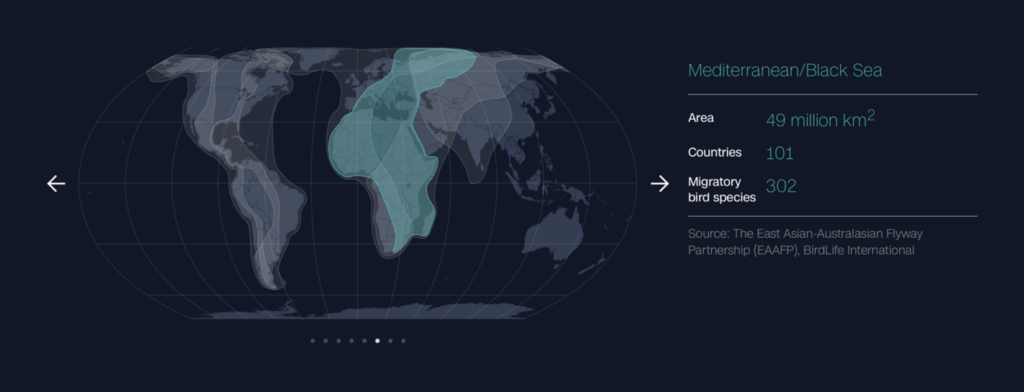
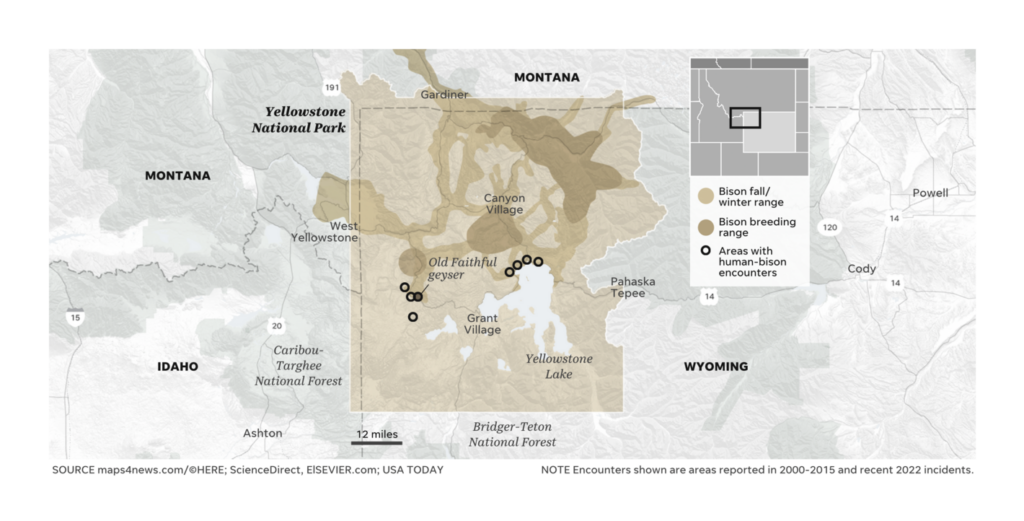
These maps showed wildlife habitats under threat from human encroachment:
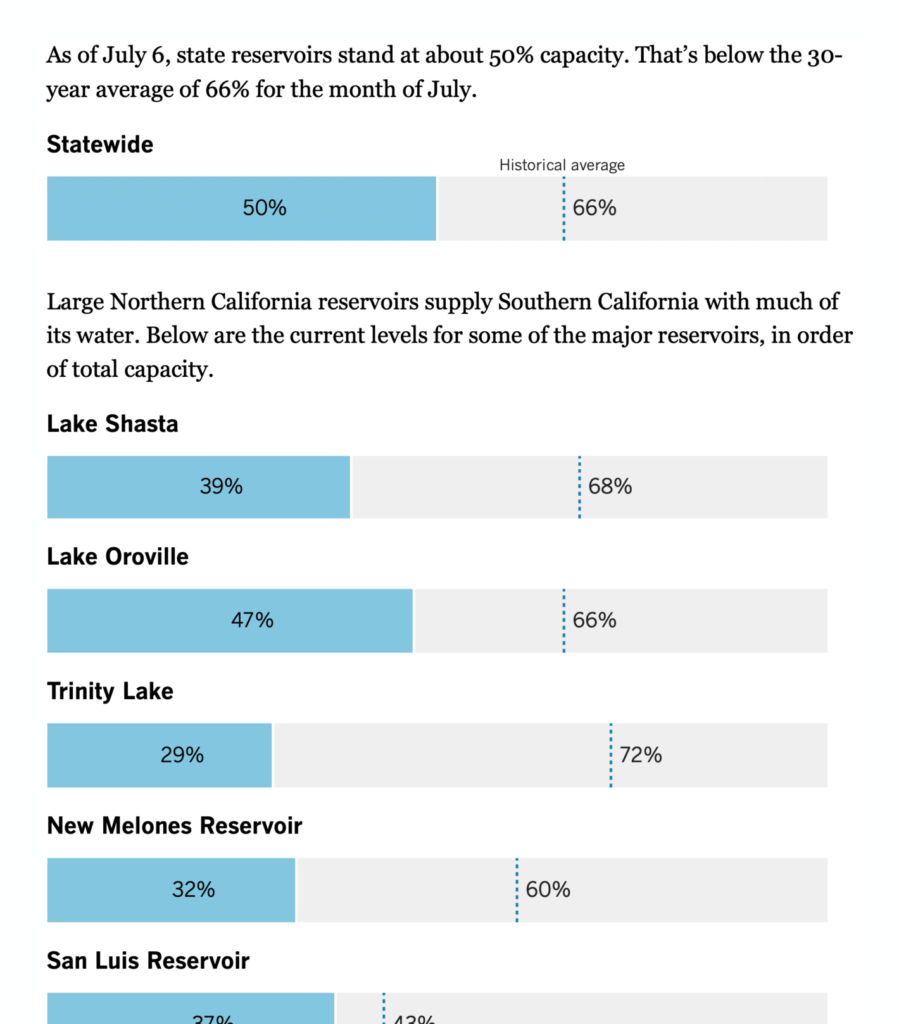
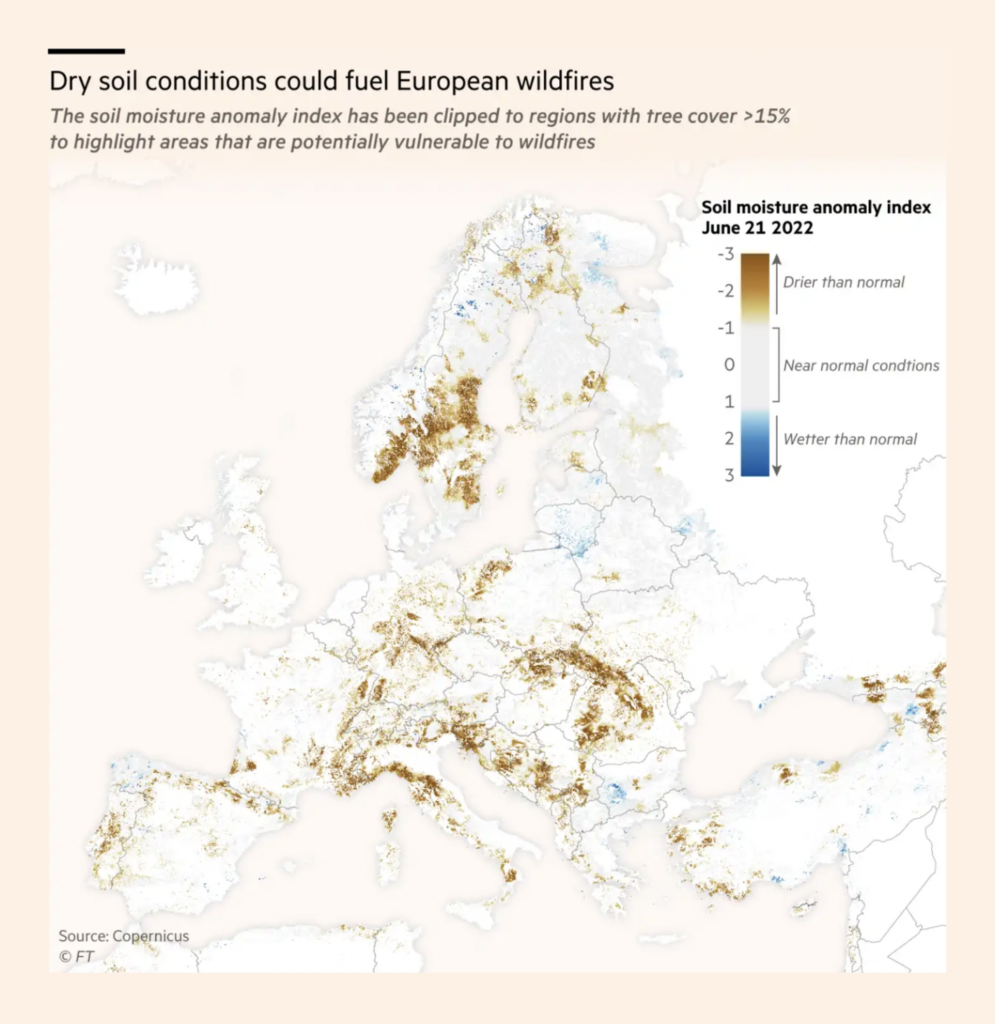
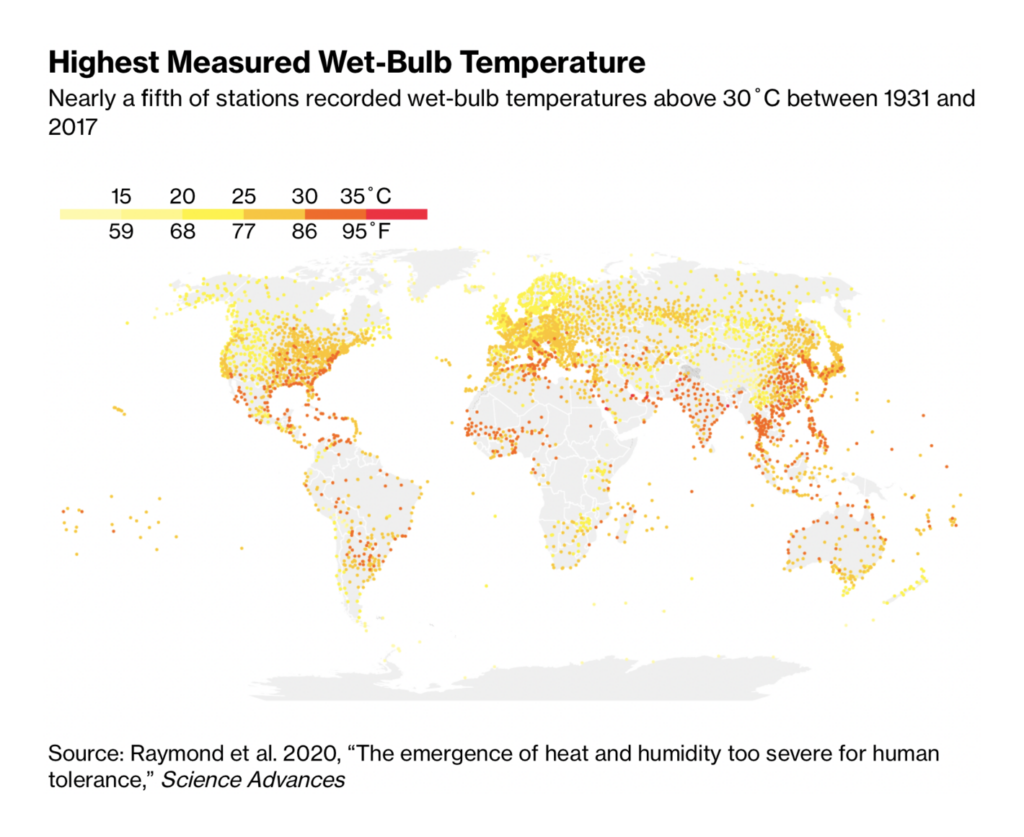
And climate charts illustrated the dangers of another too-hot, too-dry summer:
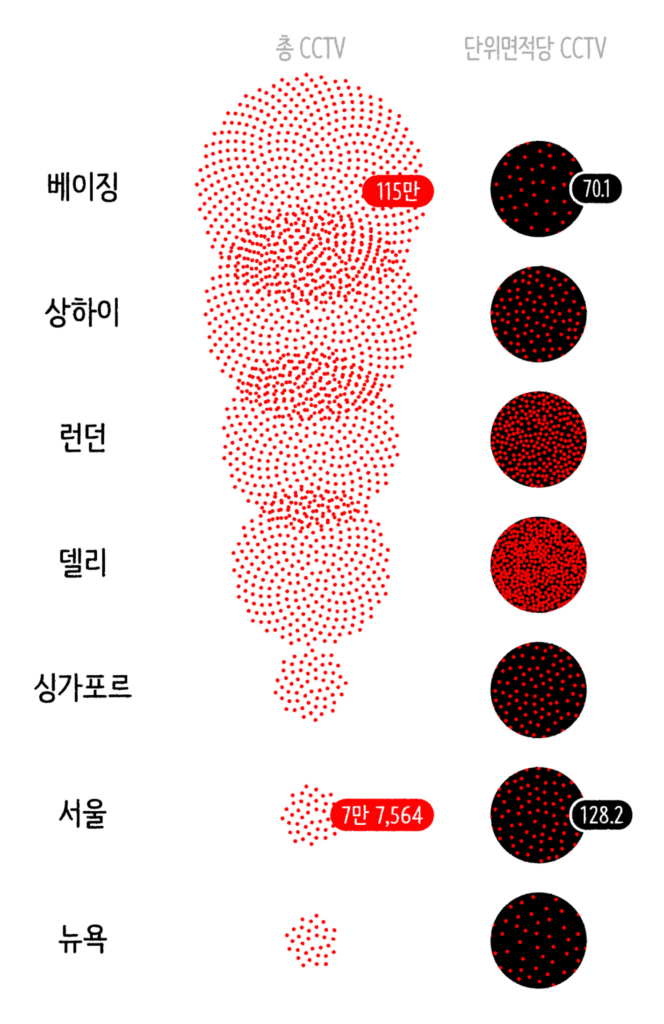
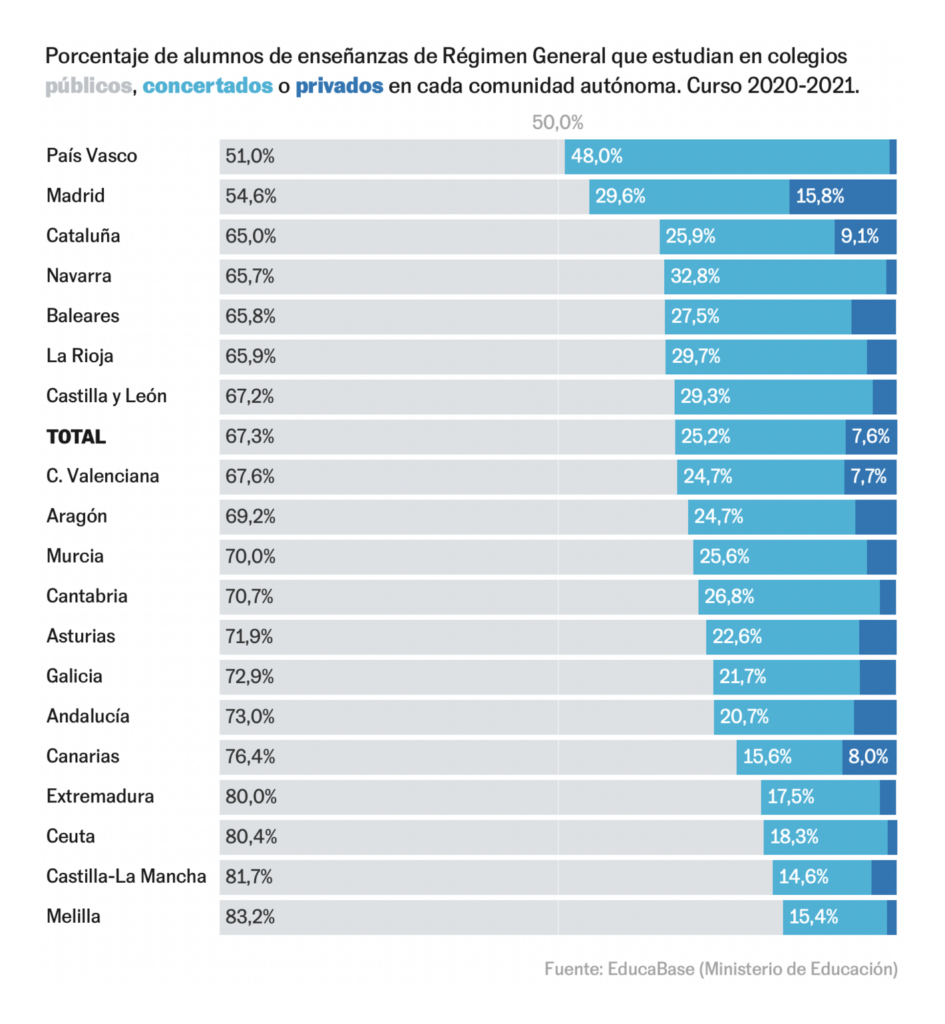
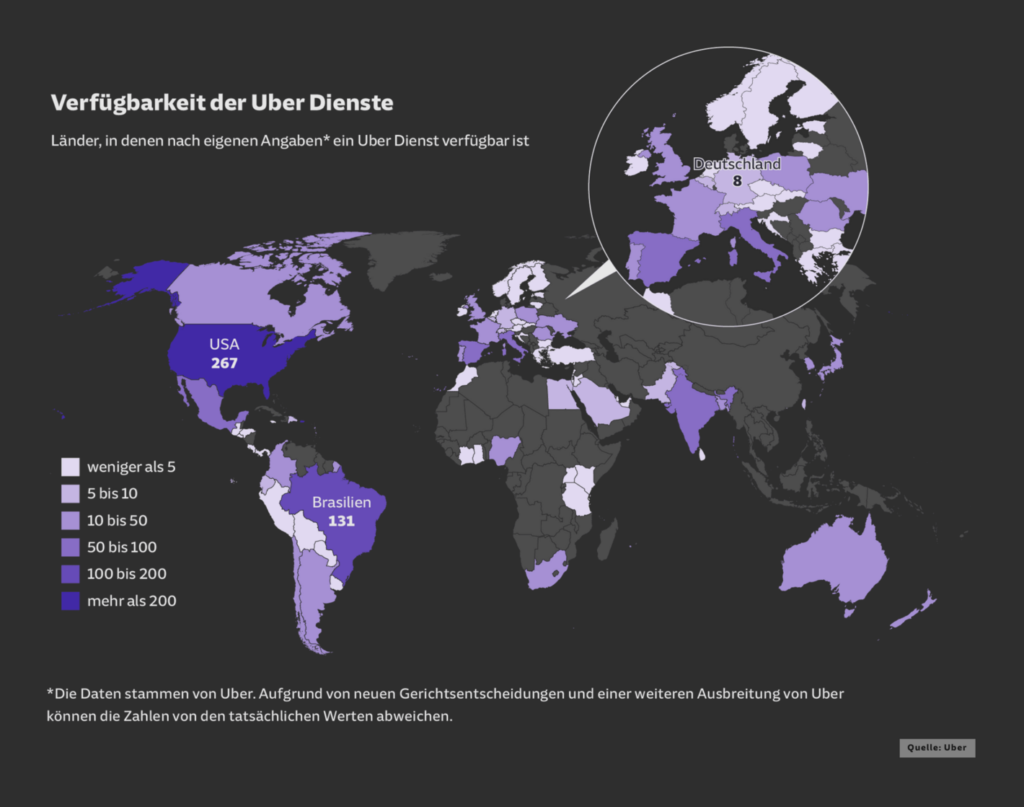
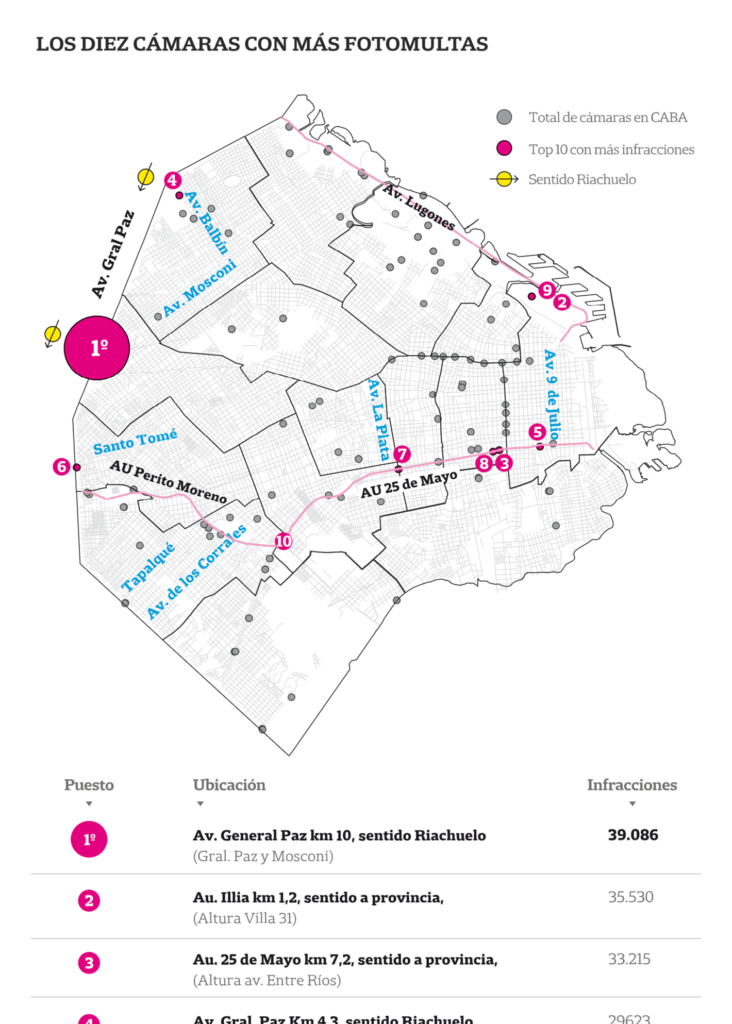
Other charts covered topics from CCTV surveillance in cities to the price of electric cars:

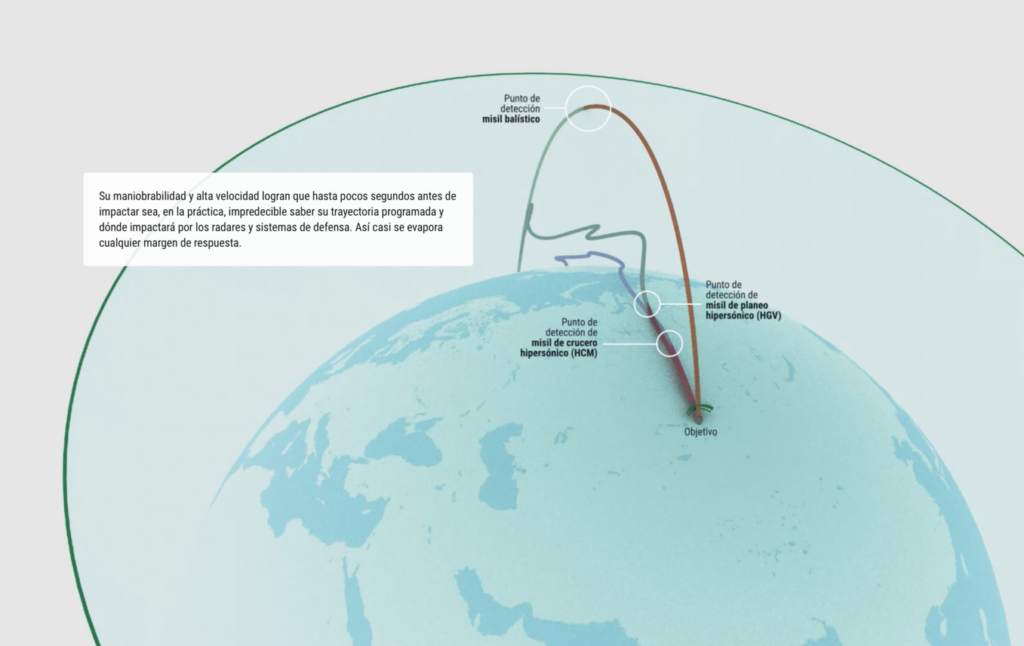
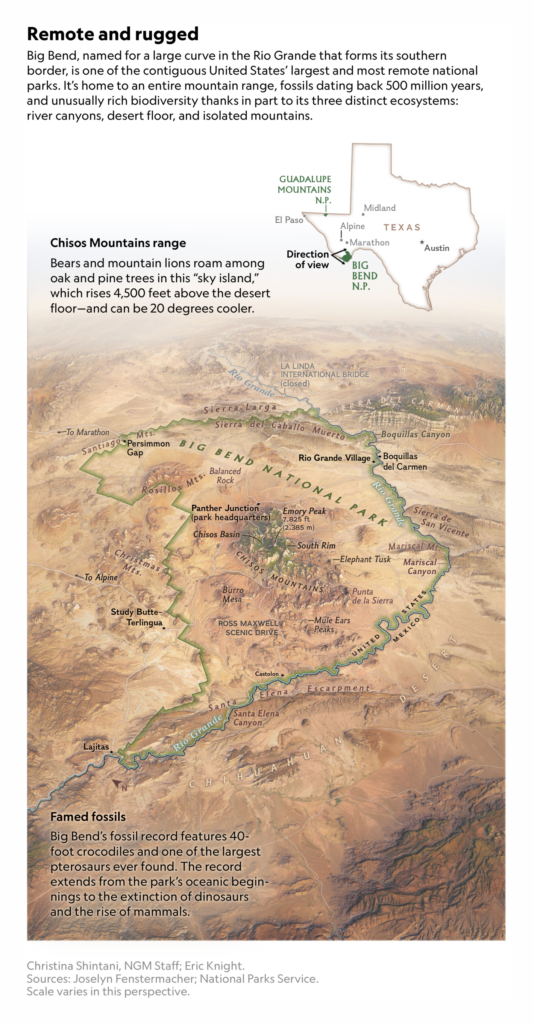
While maps dealt with everything from hypersonic missiles to national parks:
What else we found interesting

Applications are open for…
- A data journalist at the Financial Times
- A data journalist at Nesta
- A data visualization developer at Reuters
- Several jobs at Datawrapper, including a full-stack developer and a senior backend developer!
Help us make this dispatch better! We’d love to hear which newsletters, blogs, or social media accounts we need to follow to learn about interesting projects, especially from less-covered parts of the world (Asia, South America, Africa). Write us at hello@datawrapper.de or leave a comment below.
Want the Dispatch in your inbox every Tuesday? Sign up for our Blog Update newsletter!


Comments