We want to enable everyone to create beautiful charts, maps, and tables. New to data visualization? Or do you have specific questions about us? You'll find all the answers here.
The best of last week’s big and small data visualizations
Rose Mintzer-Sweeney
Welcome back to the 149th edition of the Data Vis Dispatch! Every week, we publish a collection of the best small and large data visualizations we find, especially from news organizations — to celebrate data journalism, data visualization, simple charts, elaborate maps, and their creators.
Recurring topics this week include elections in France, the U.K., and the U.S.
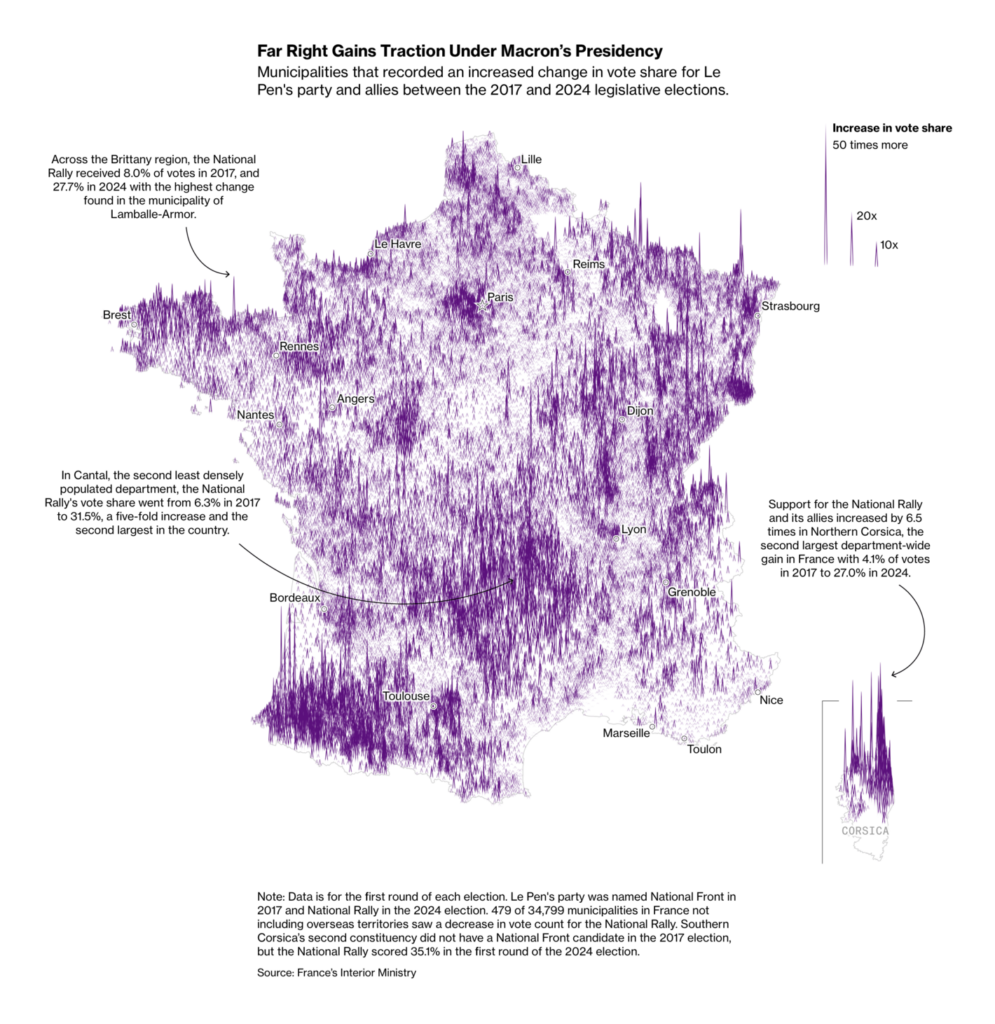
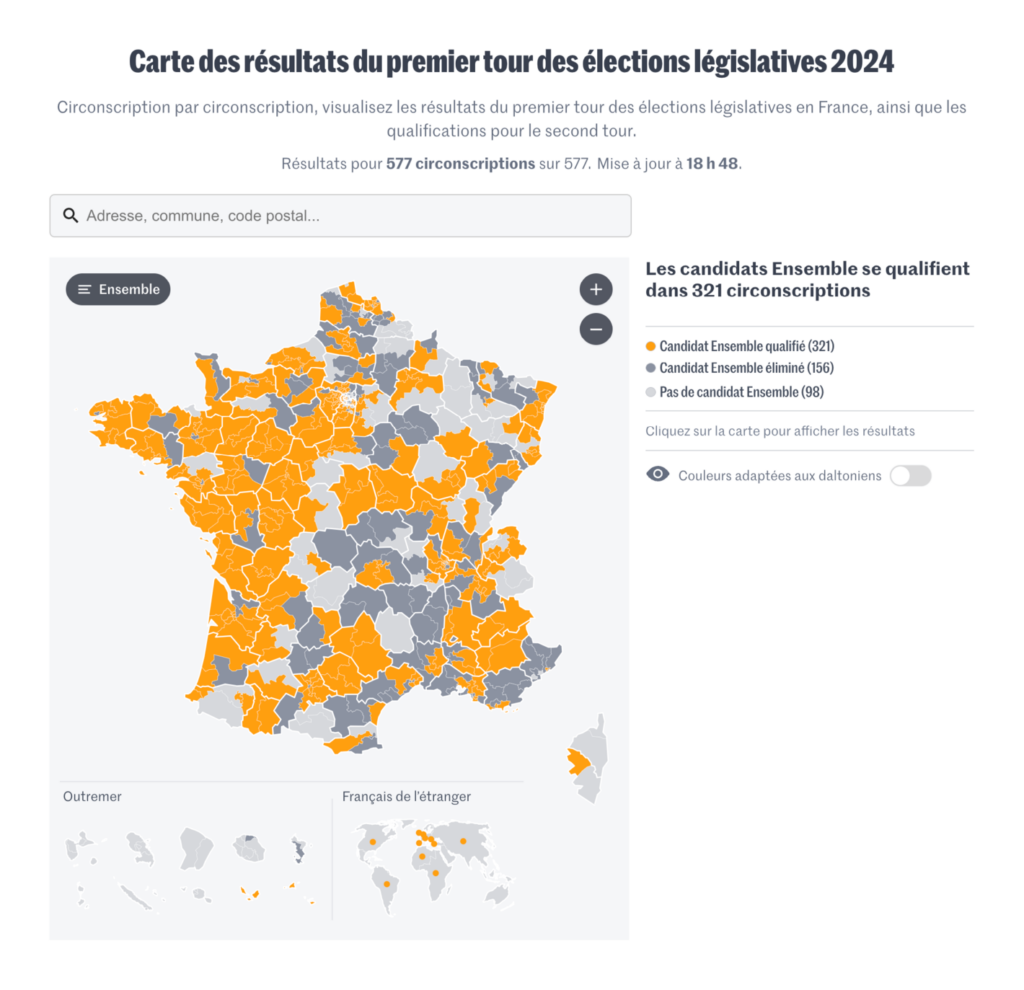
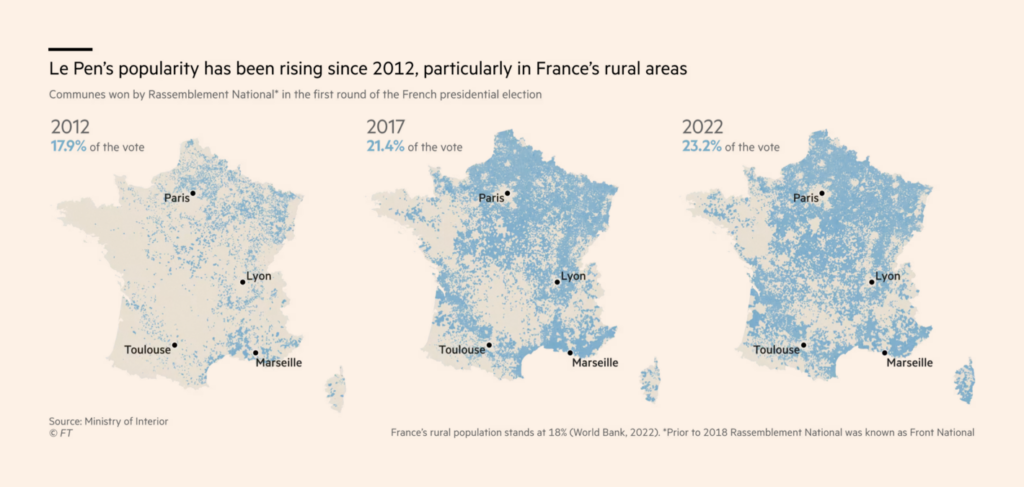
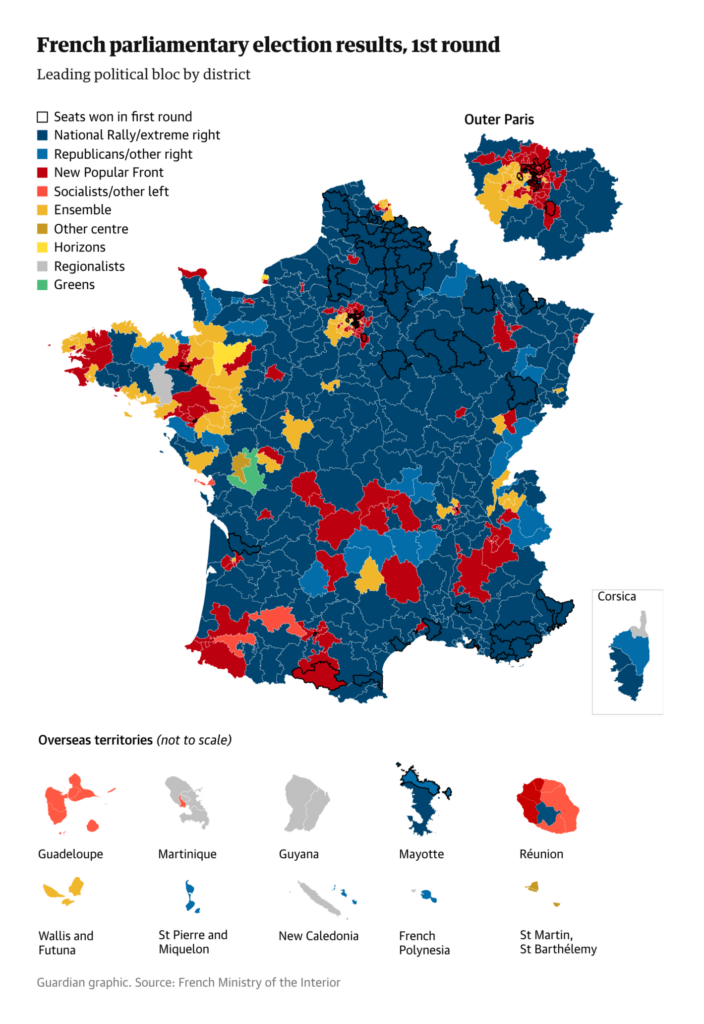
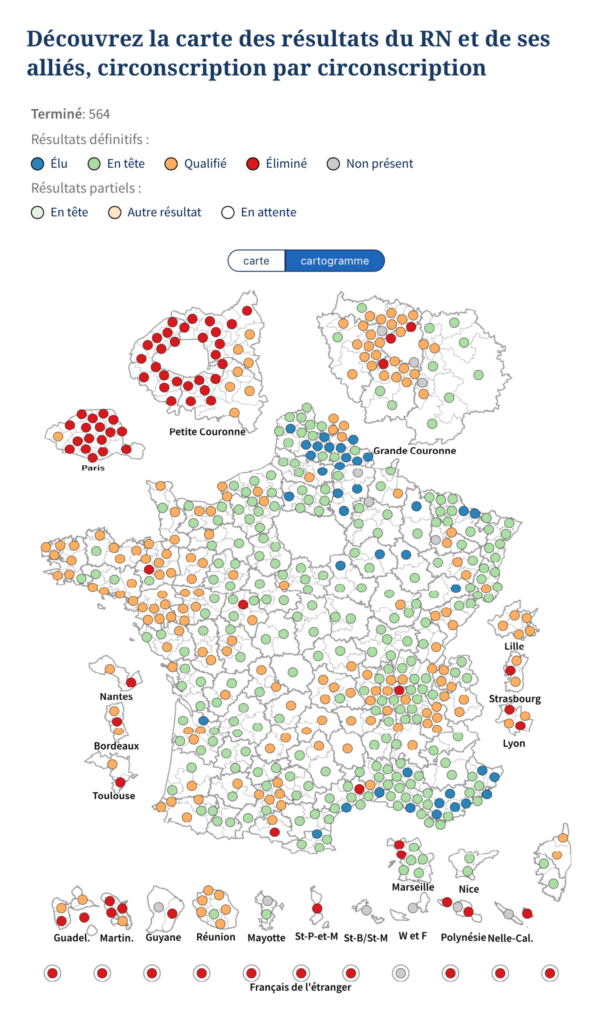
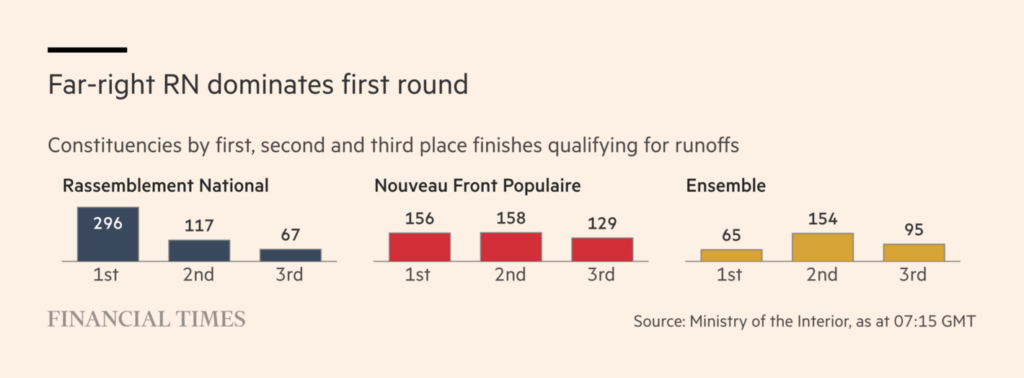
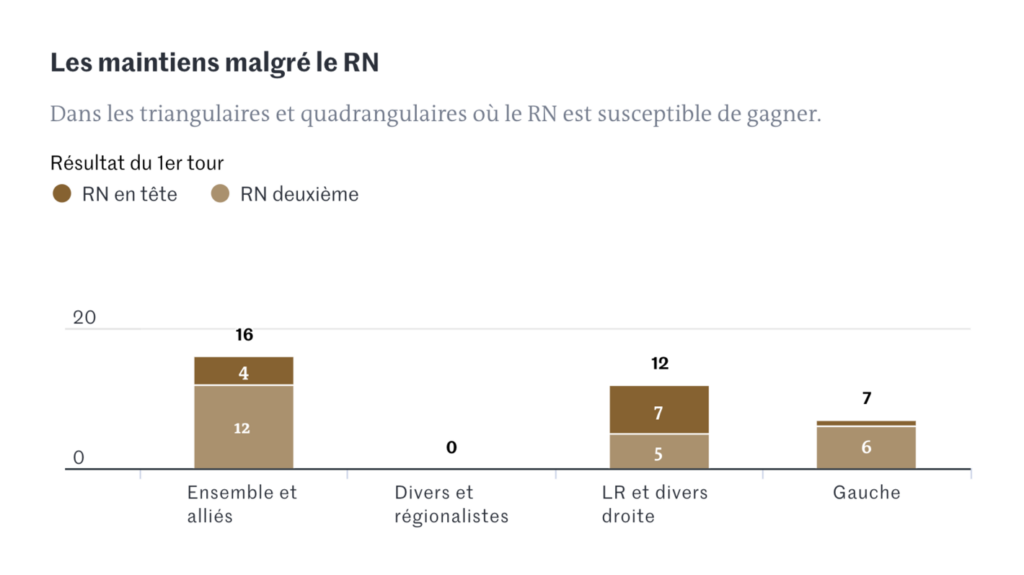
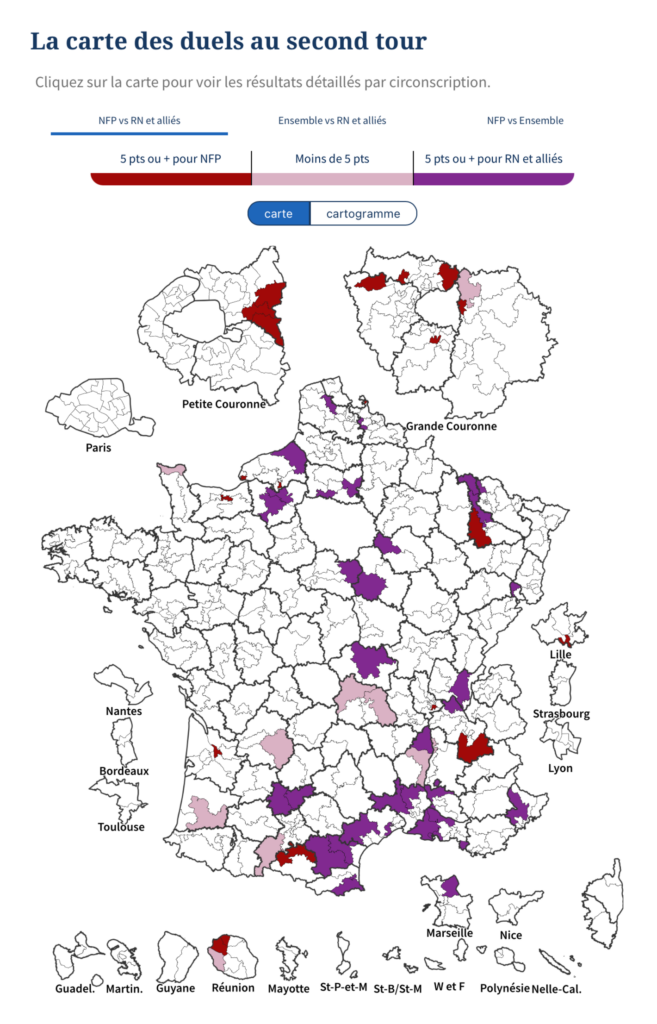
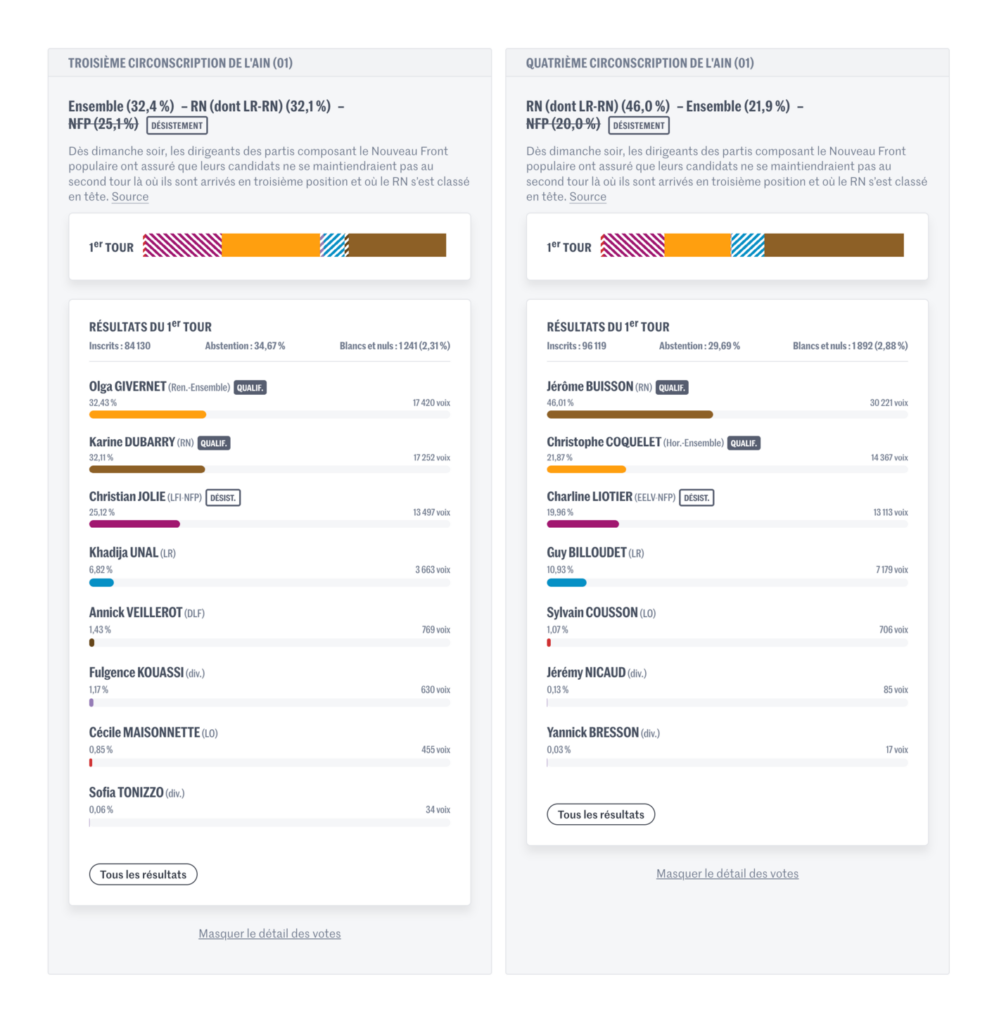
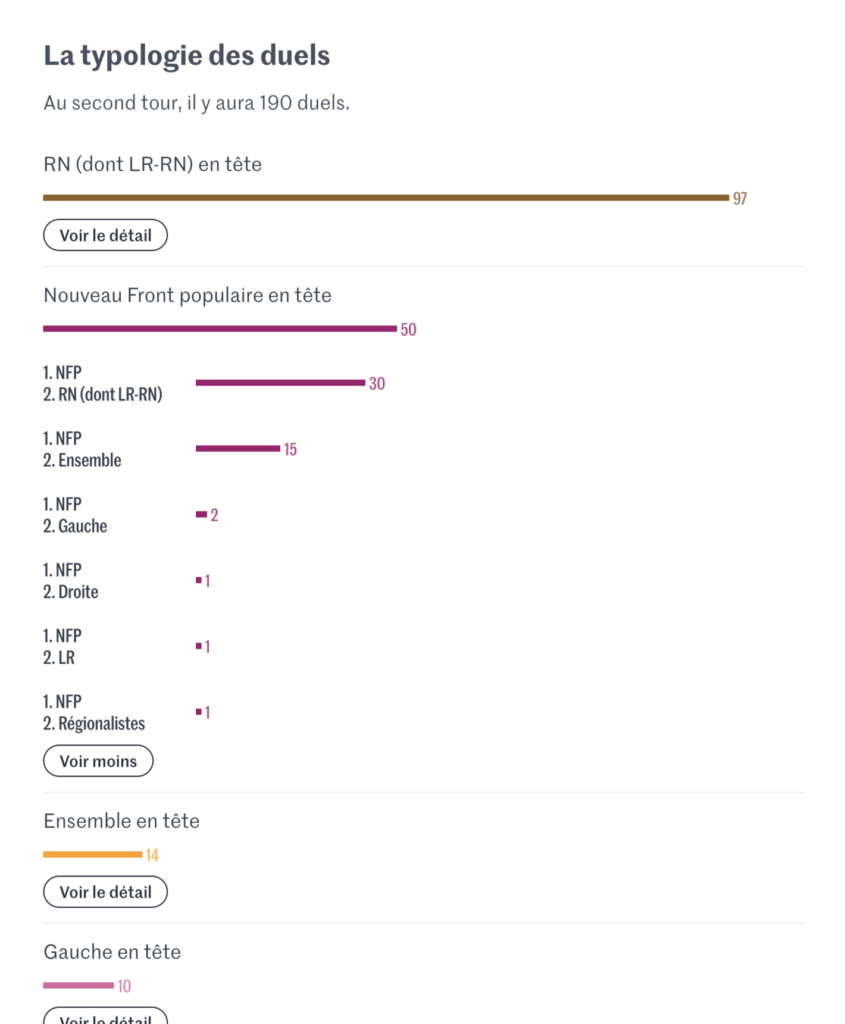
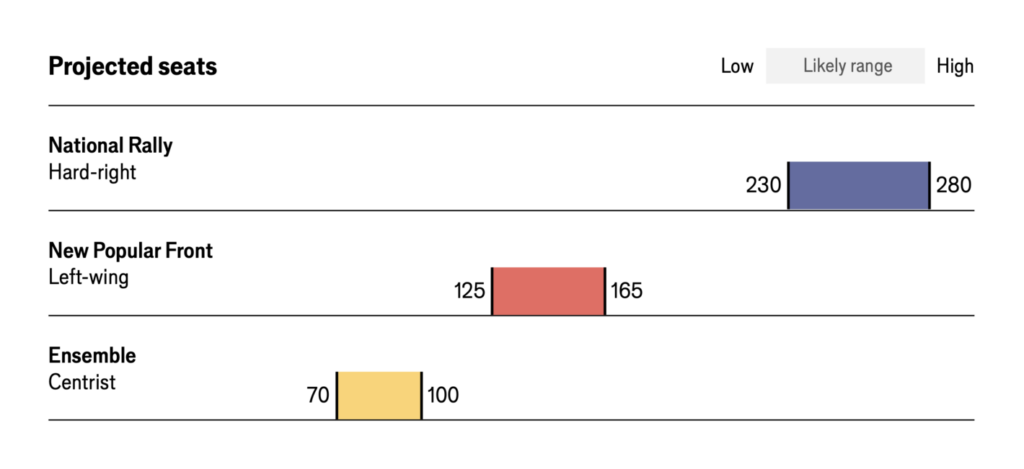
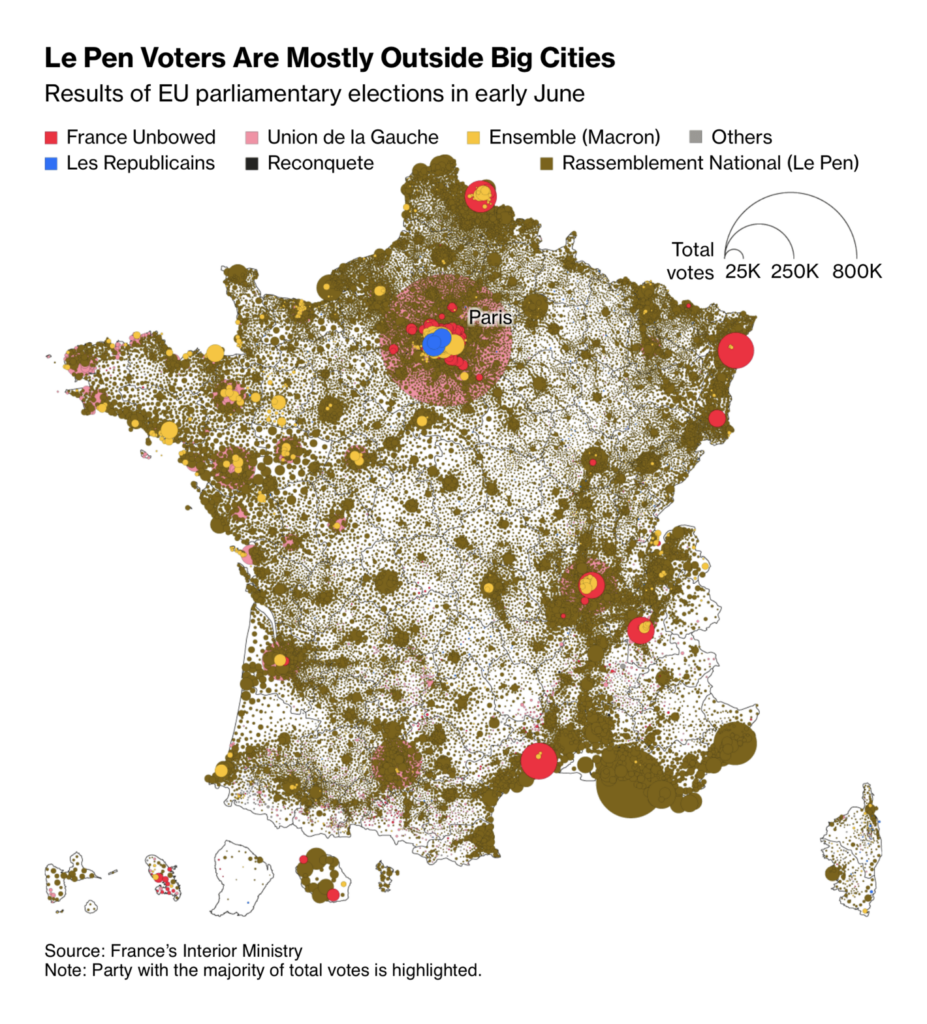
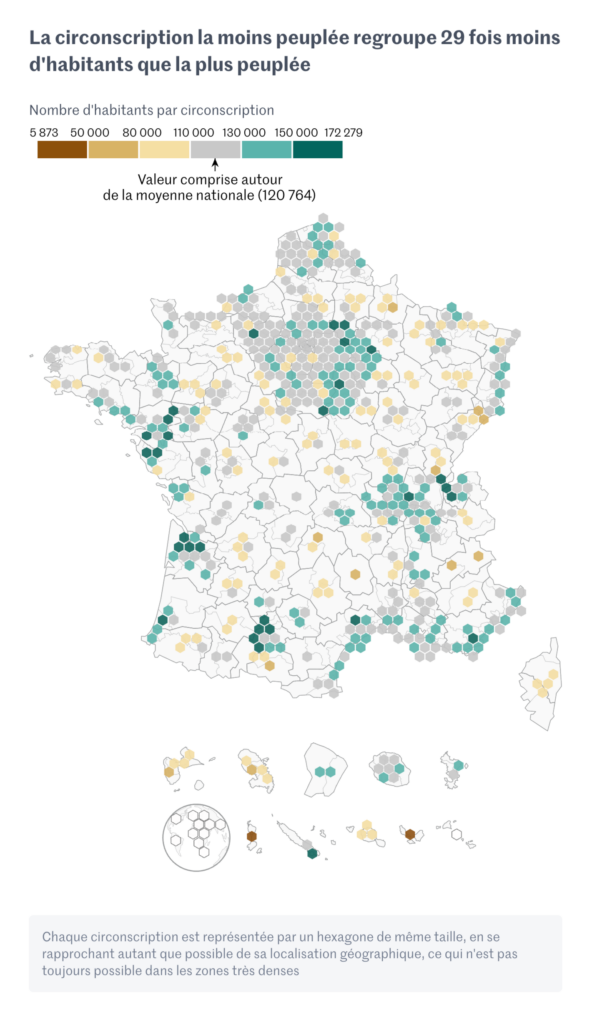
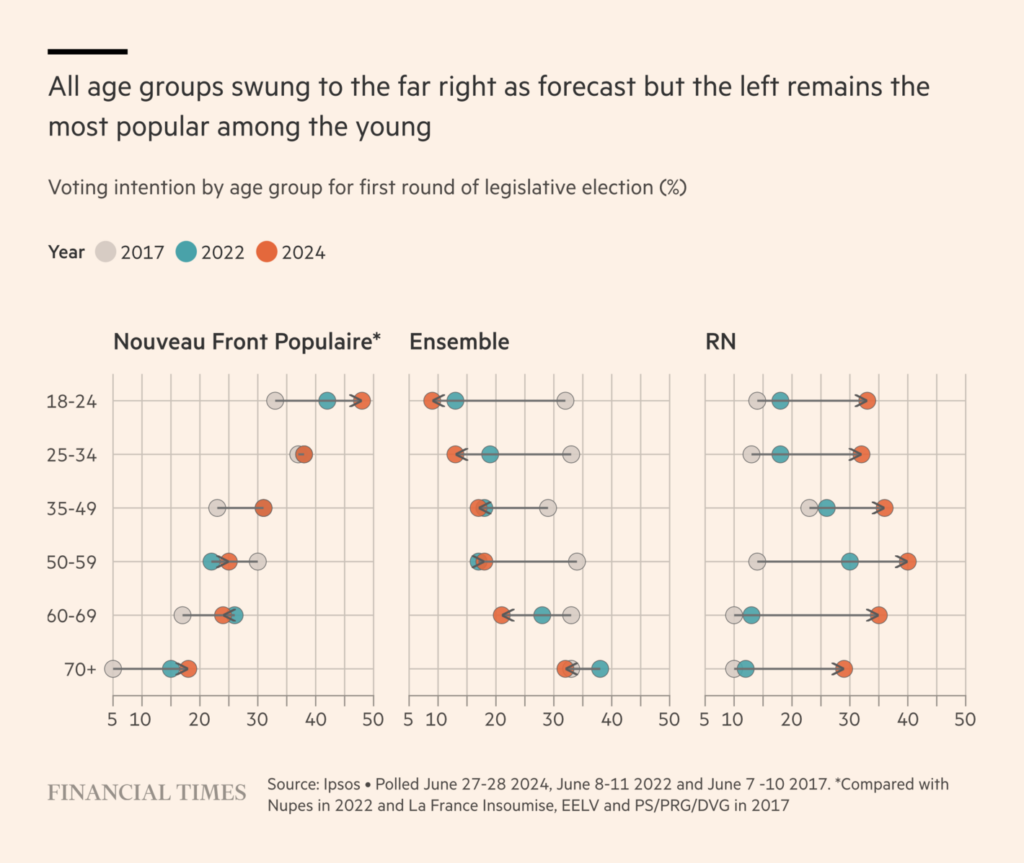
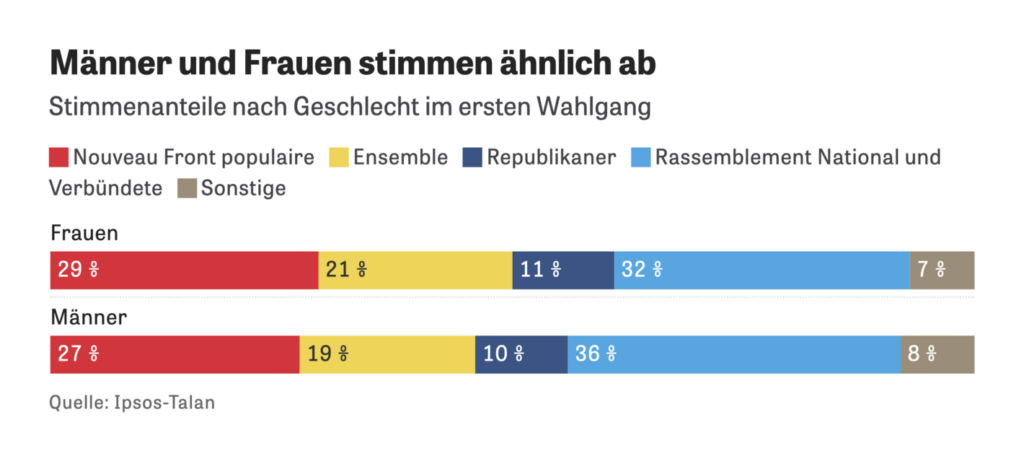
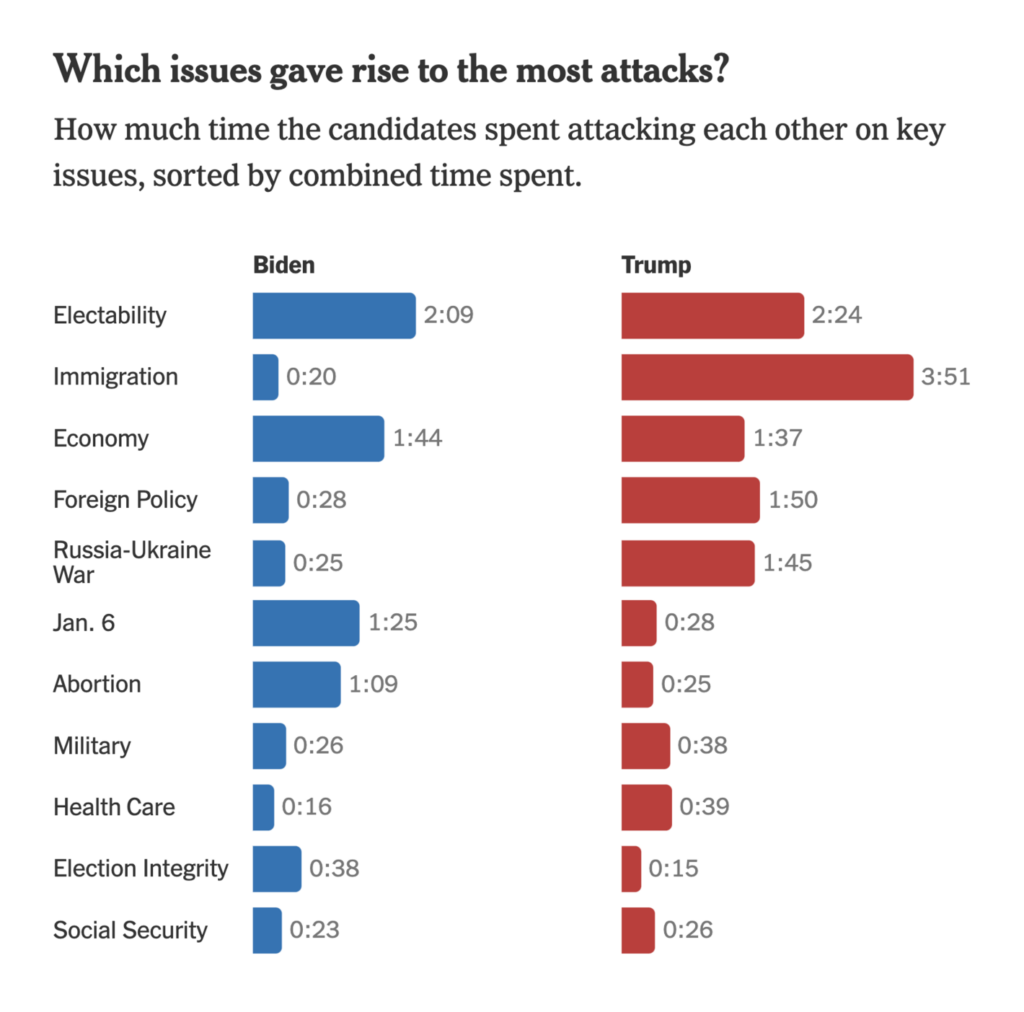
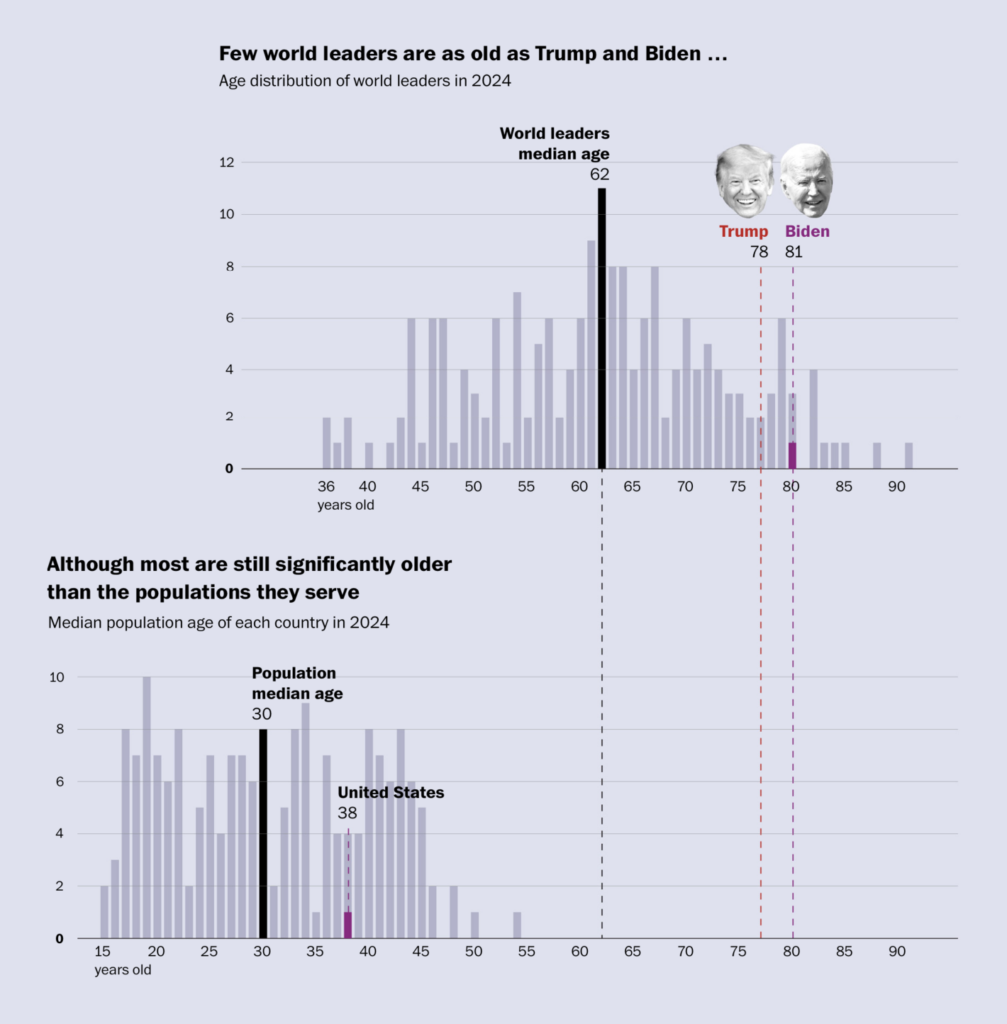
2024 election madness continues! This week was France’s (first) turn:
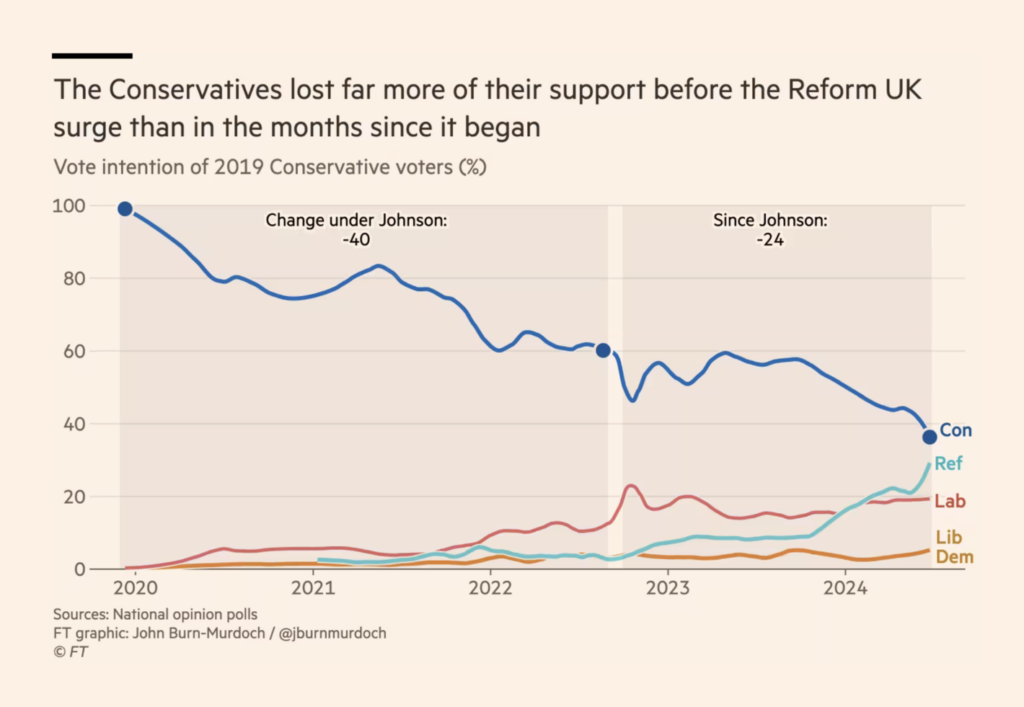
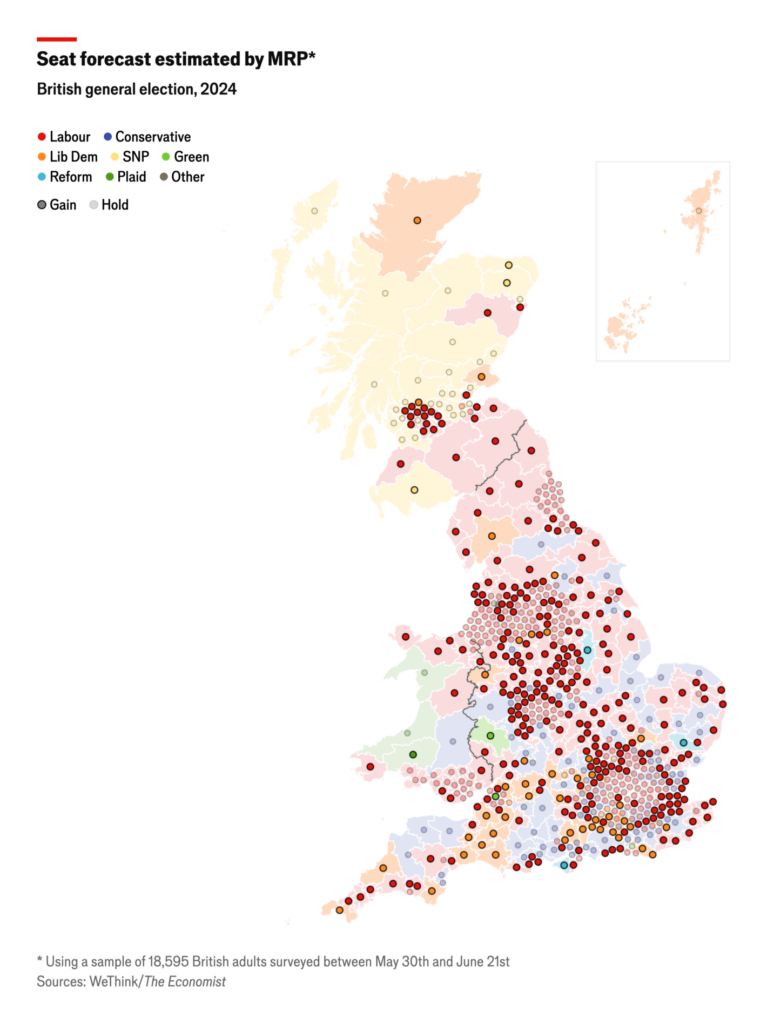
France’s runoffs are only five days away, but that still doesn’t make them the next major national elections! In the U.K.,Conservatives are scheduled for a resounding defeat on Thursday:
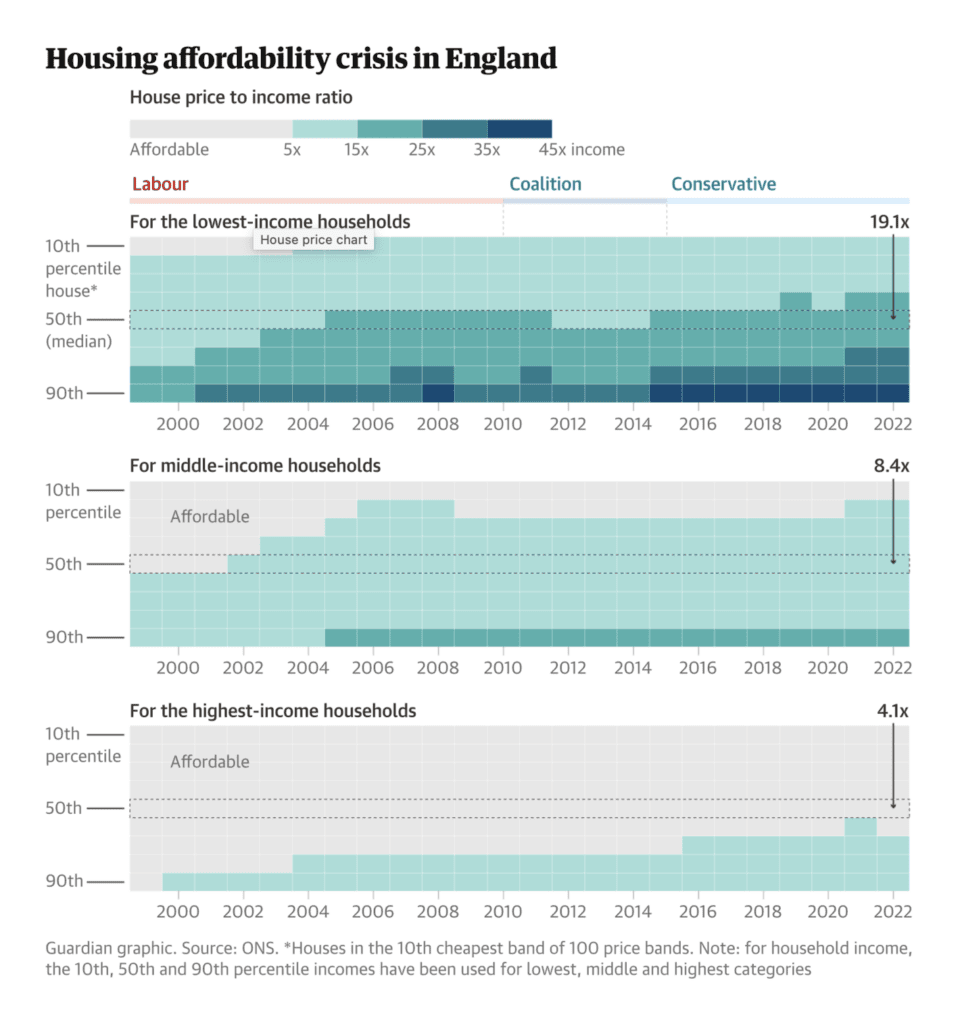
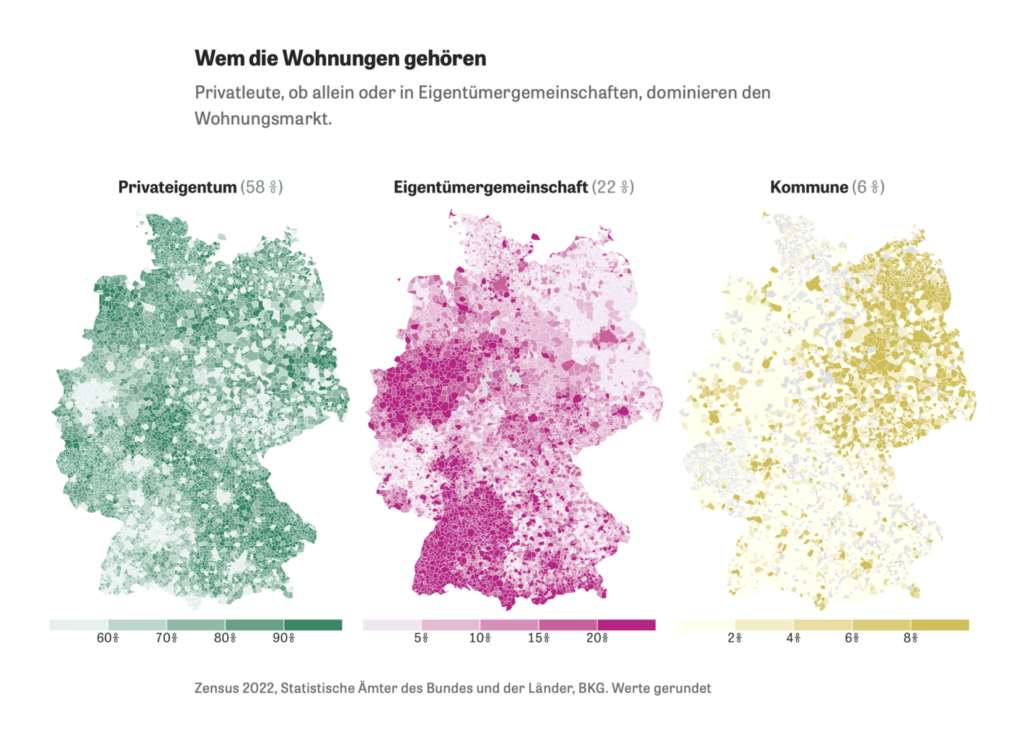
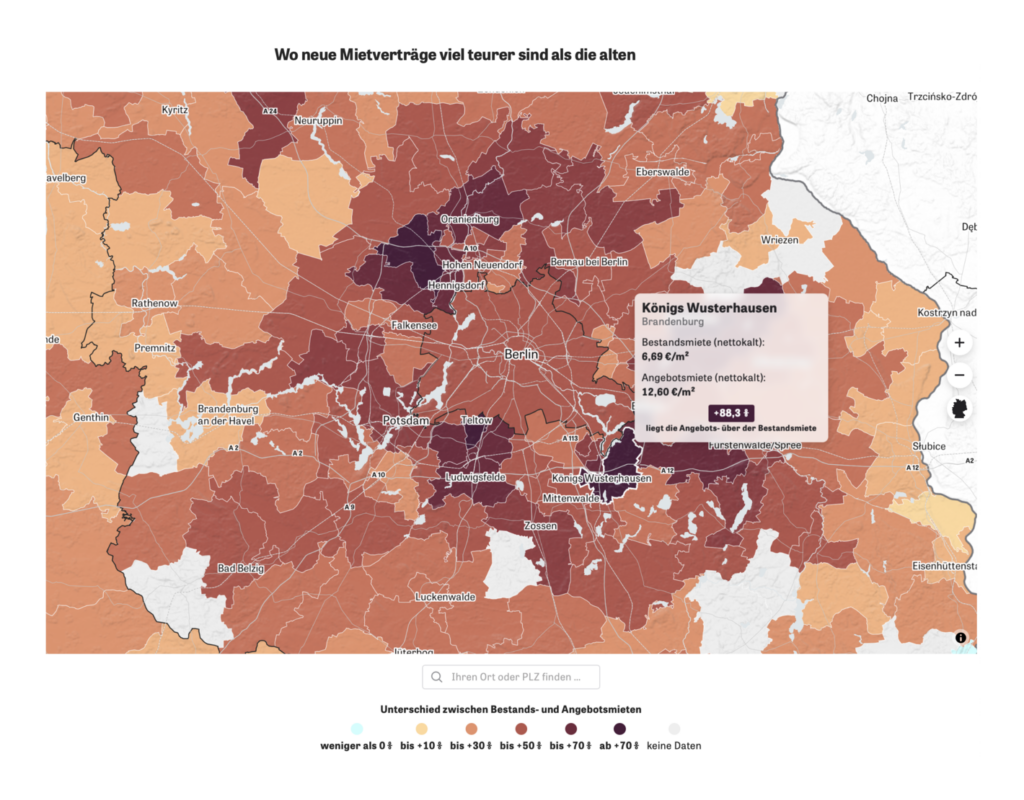
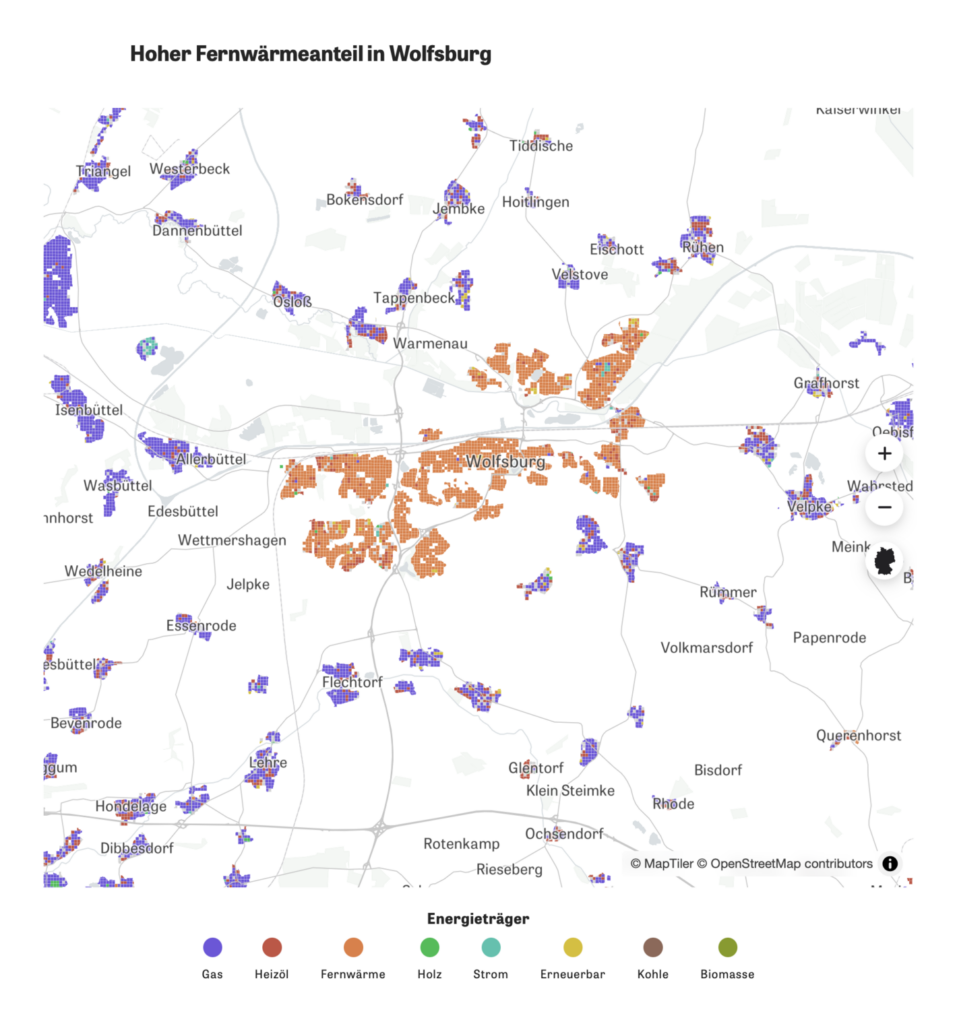
I guess you’ll see election news in every Dispatch this year. What you won’t get every time — three beautiful maps from Zeit Online on housing issues in Germany:
Help us make this dispatch better! We’d love to hear which newsletters, blogs, or social media accounts we need to follow to learn about interesting projects, especially from less-covered parts of the world (Asia, South America, Africa). Write us at hello@datawrapper.de or leave a comment below.
(she/her, @rosemintzers) is a data vis writer on Datawrapper's communications team. She likes words, numbers, pictures, and all possible combinations of the same. Rose lives in Berlin.


Comments