Data Vis Dispatch, July 25

The best of last week’s big and small data visualizations

Welcome back to the 103rd edition of Data Vis Dispatch! Every week, we’ll be publishing a collection of the best small and large data visualizations we find, especially from news organizations — to celebrate data journalism, data visualization, simple charts, elaborate maps, and their creators.

Recurring topics this week include college admissions, “Barbenheimer,” and the Spanish elections.

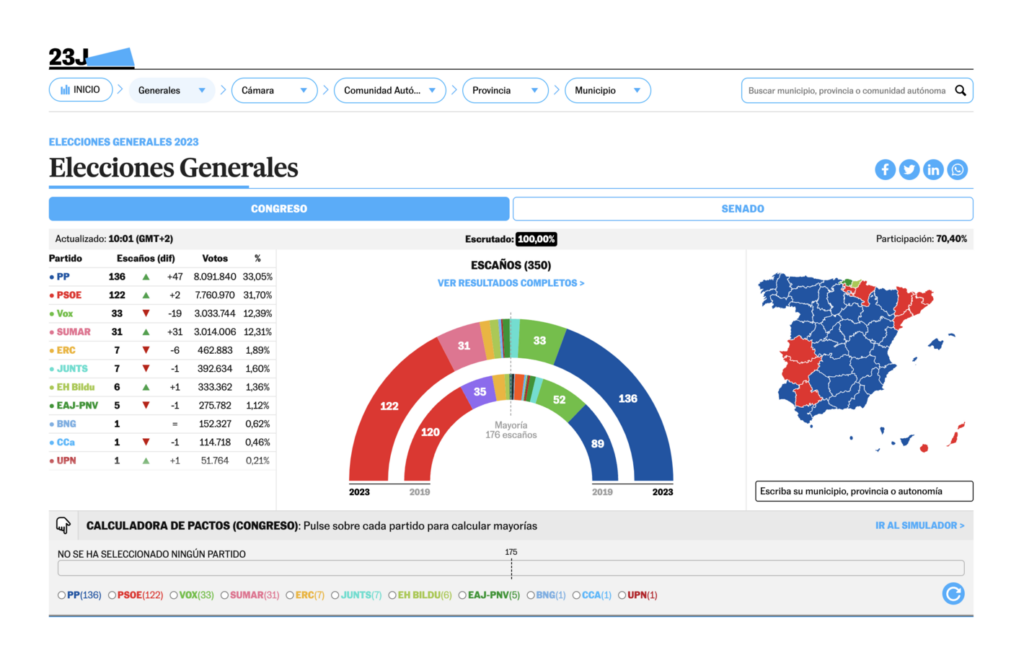
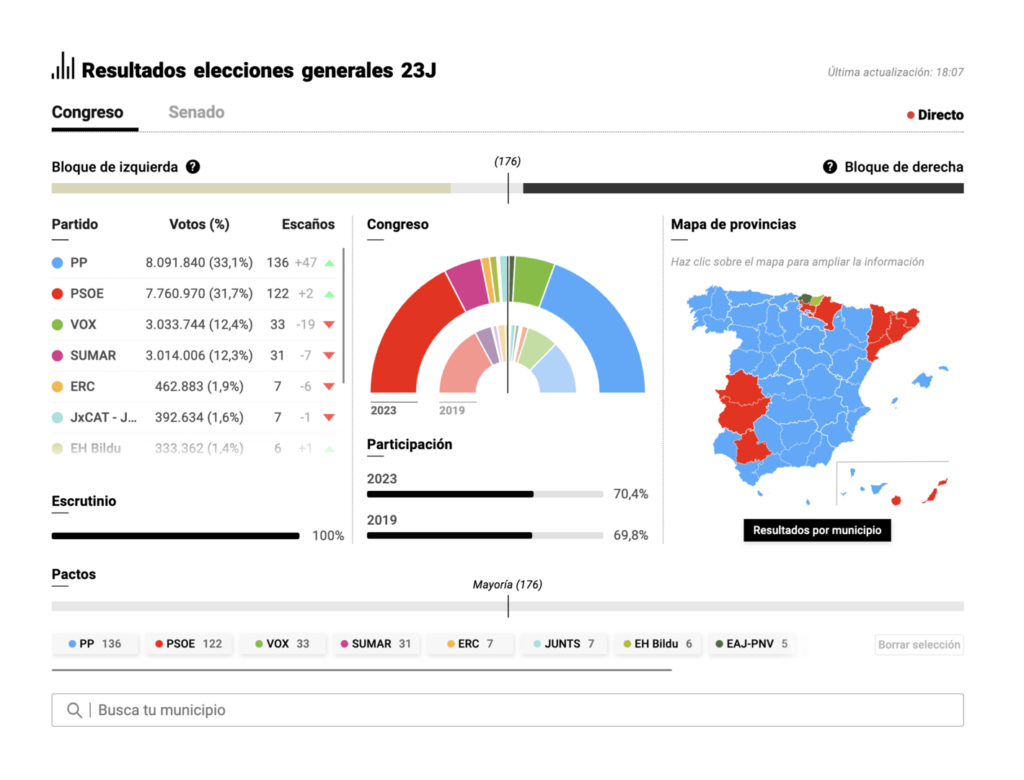
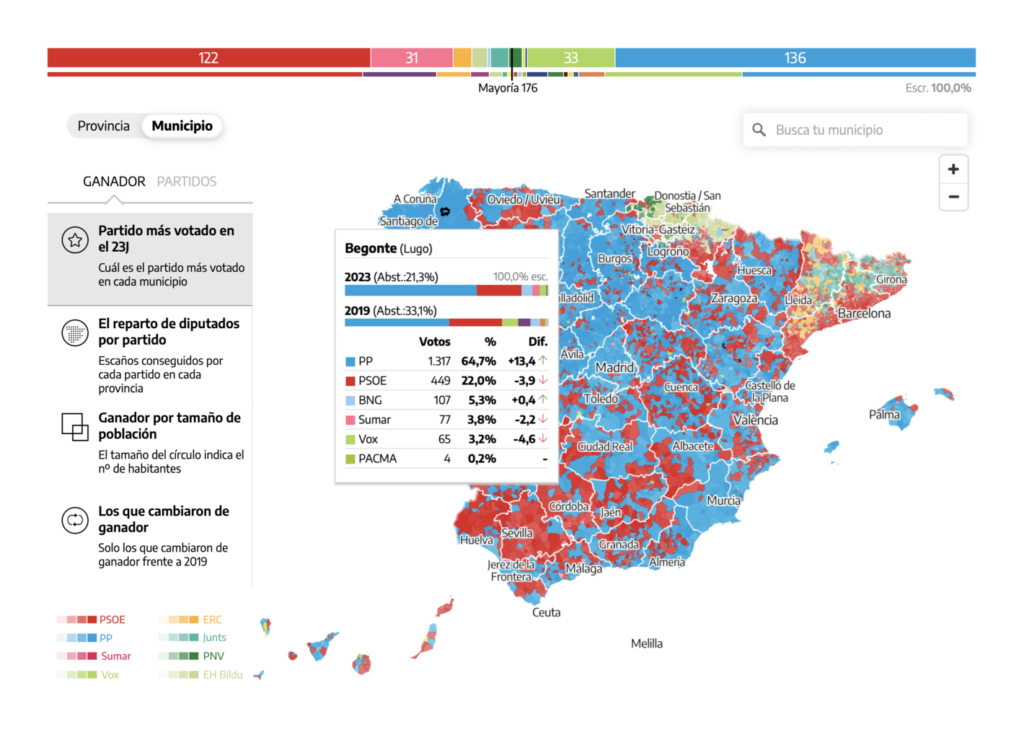
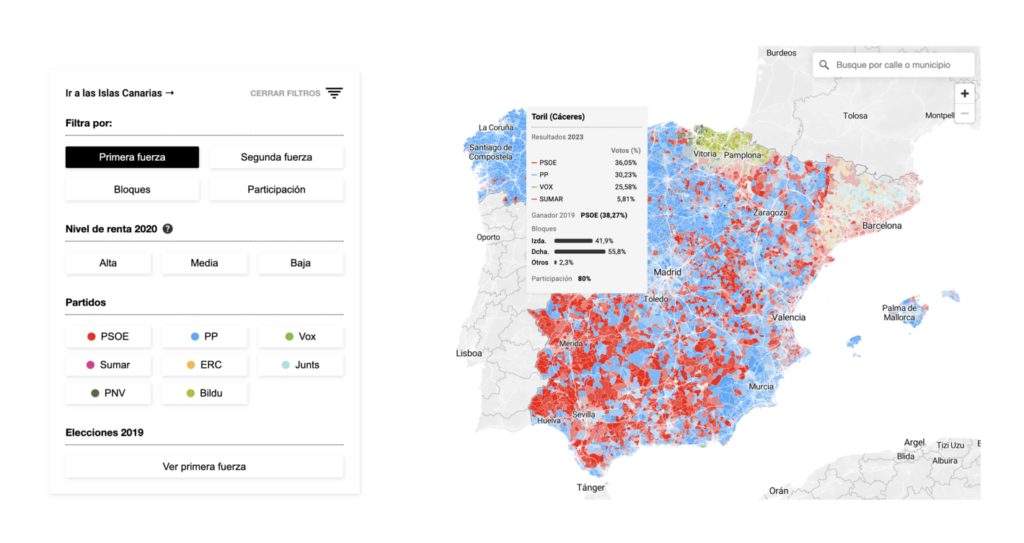
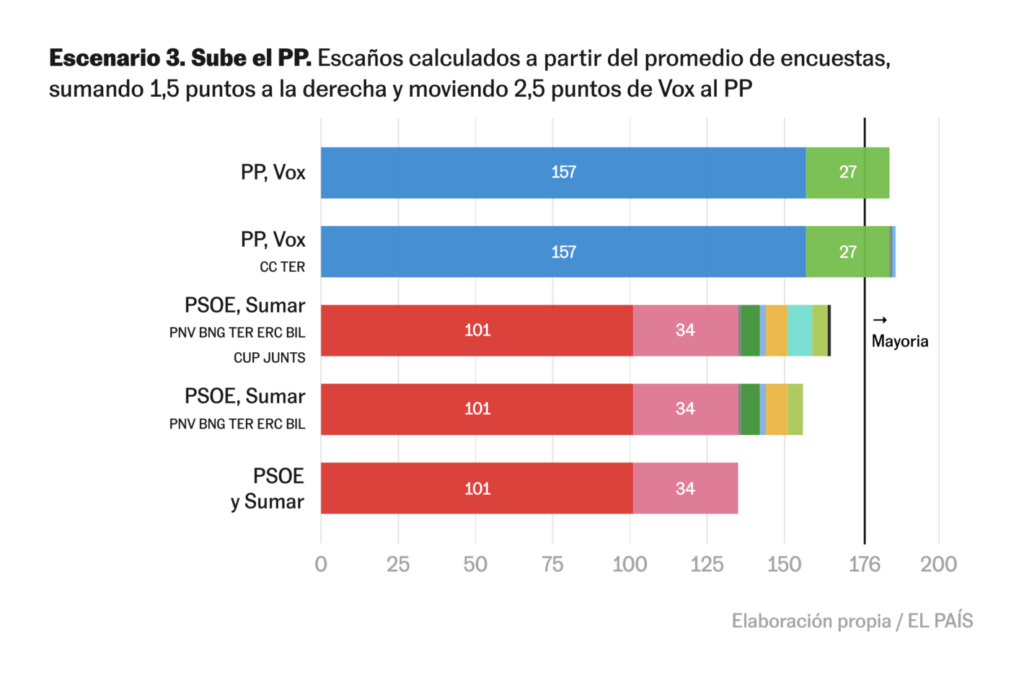
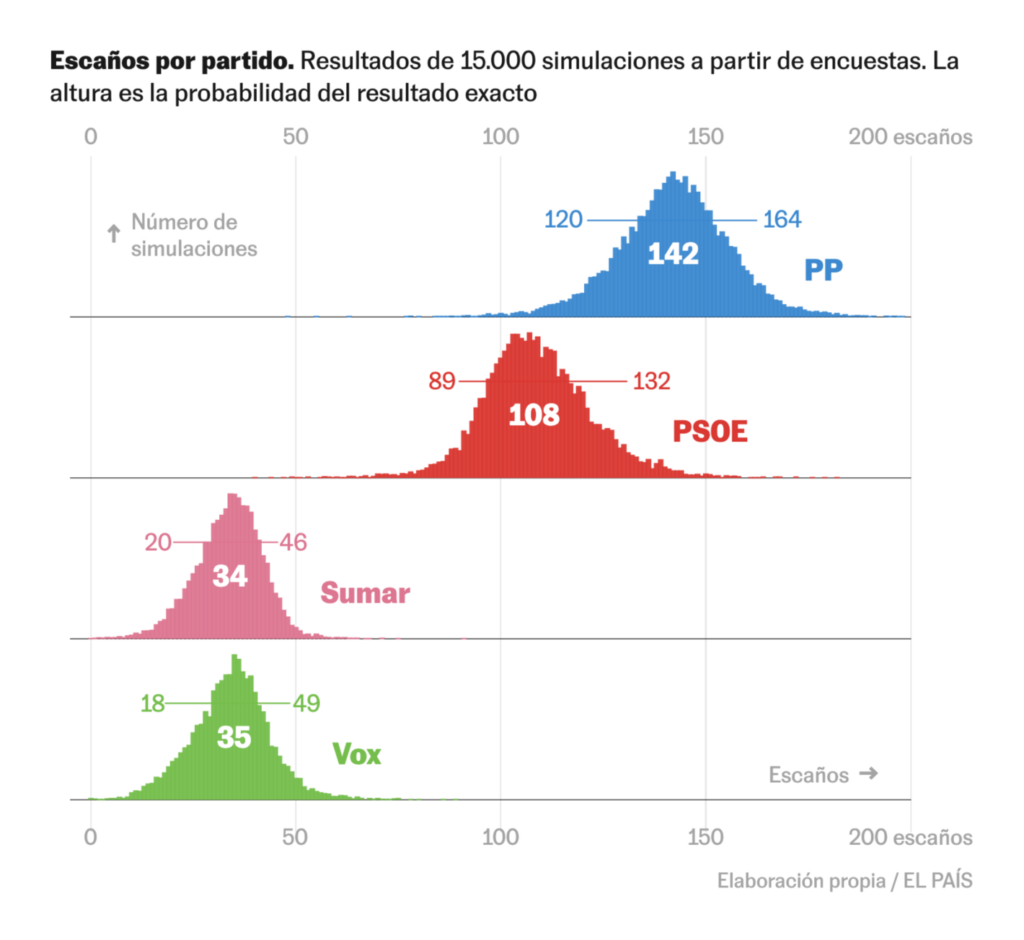
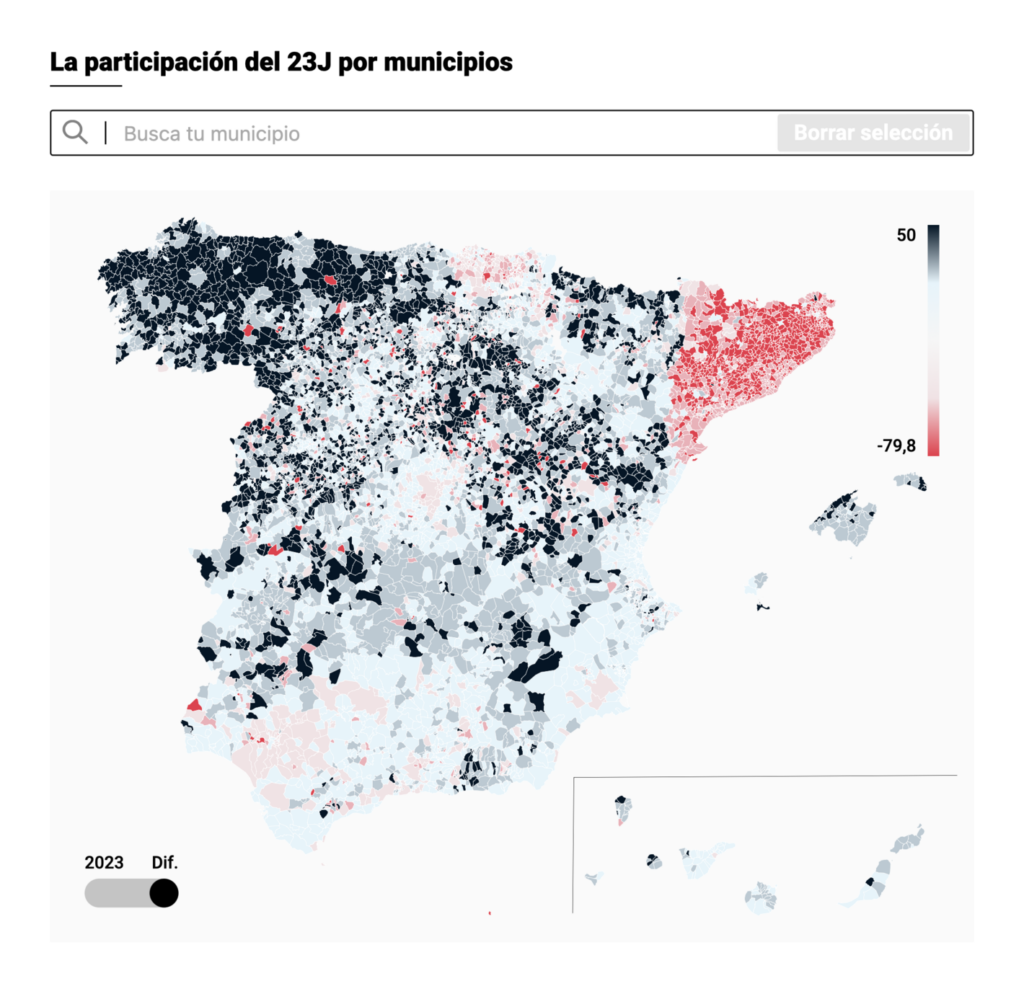
Get ready for a long Dispatch this week — Sunday was a general election in Spain! There were trackers and maps of the overall results:

El País: Elecciones Generales 2023, July 20
El Confidencial: Resultados elecciones generales 23J, July 24
The New York Times: Resultados de las elecciones generales de España, July 23
elDiario: Los resultados de las elecciones generales del 23J, municipio a municipio, July 23
El Confidencial: Los resultados de las elecciones generales en España, calle a calle, July 24

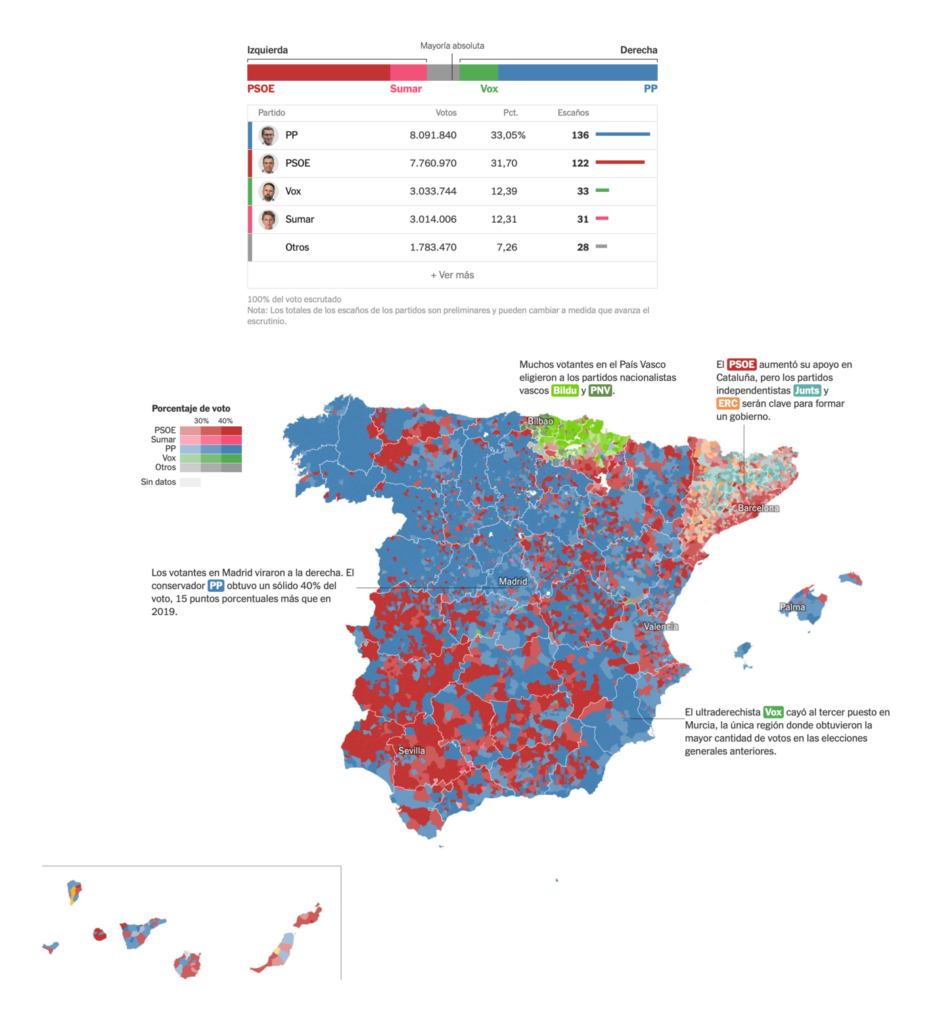
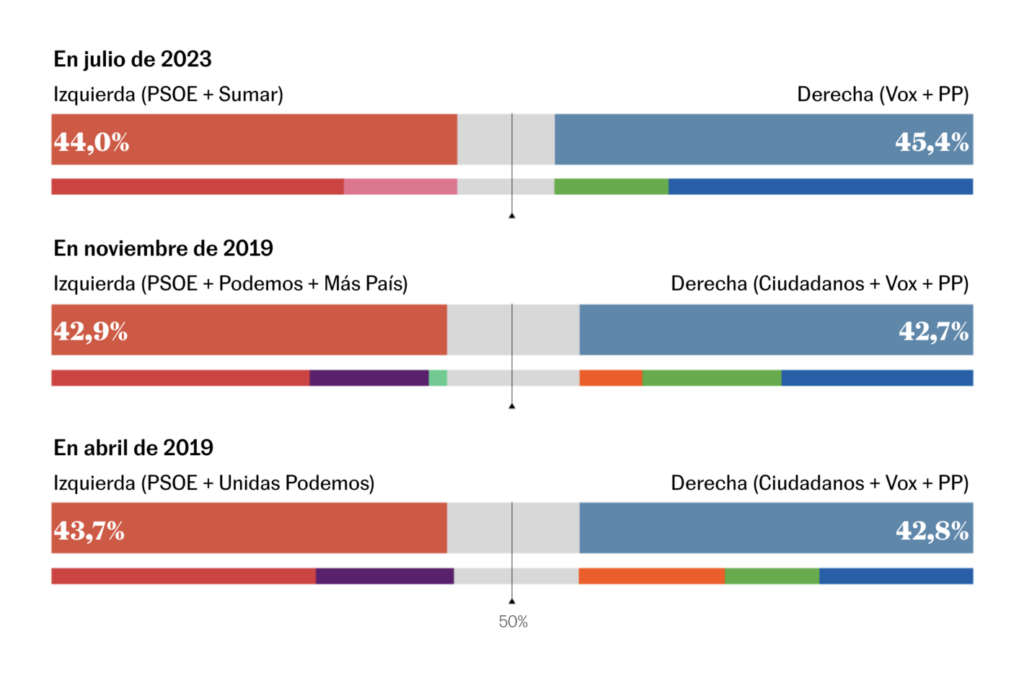
There was the question of overall ideological swing:

El País: Datos y gráficos para entender el 23-J: Cataluña, el voto exterior y una vuelta a 2019, July 25
elDiario: De izquierda o derecha: los resultados del 23J por bloques ideológicos, municipio a municipio, July 23
El País: ¿Quién va a ganar las elecciones? Esto dicen las encuestas, July 19

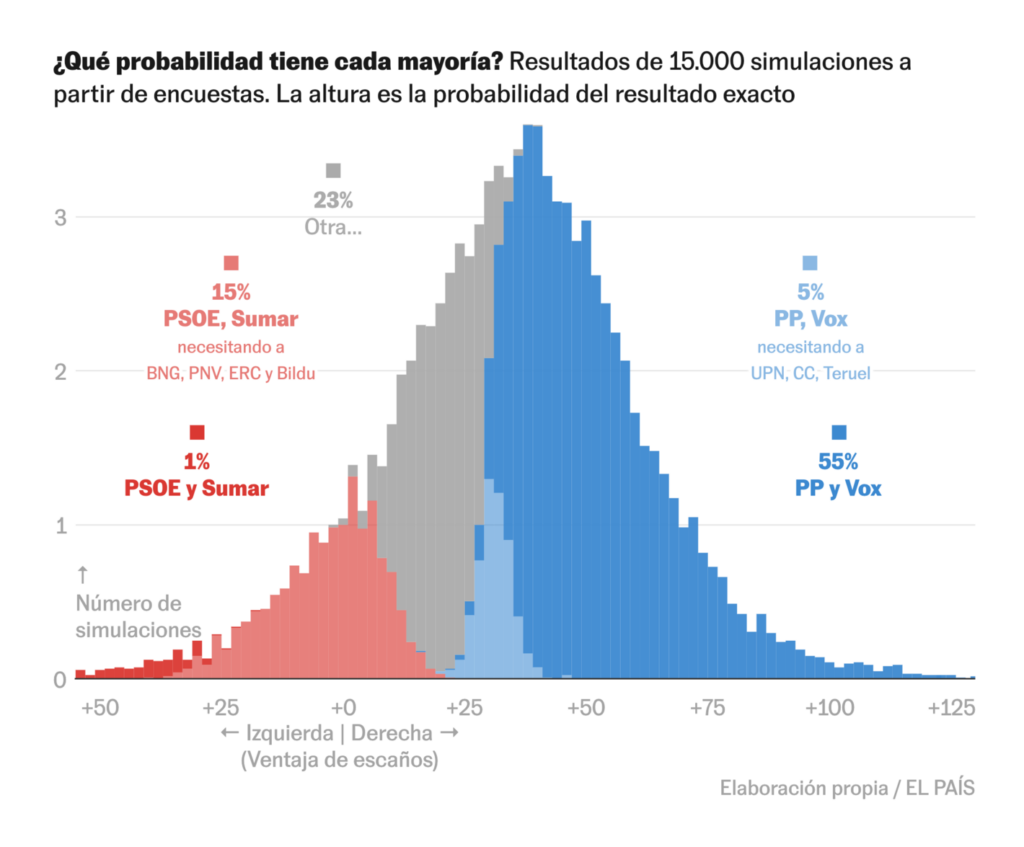
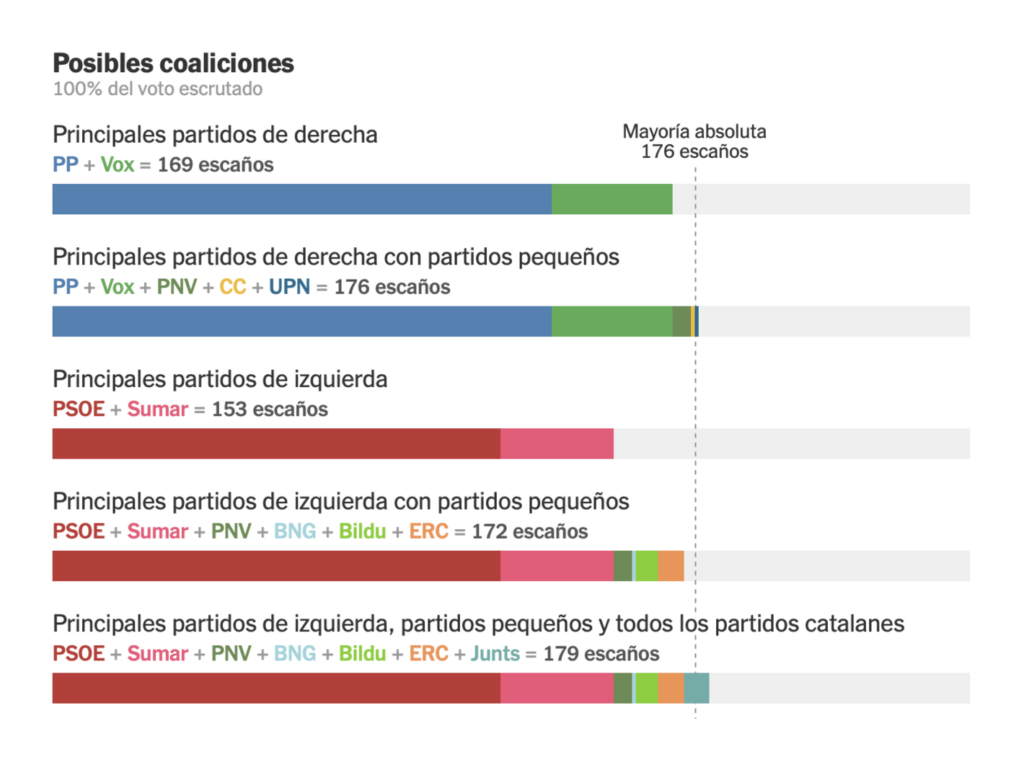
There were predictions, and later analyses, of viable coalition outcomes:

El País: La victoria de la izquierda y otras sorpresas posibles, según las encuestas, July 22
The New York Times: Resultados de las elecciones generales de España, July 23

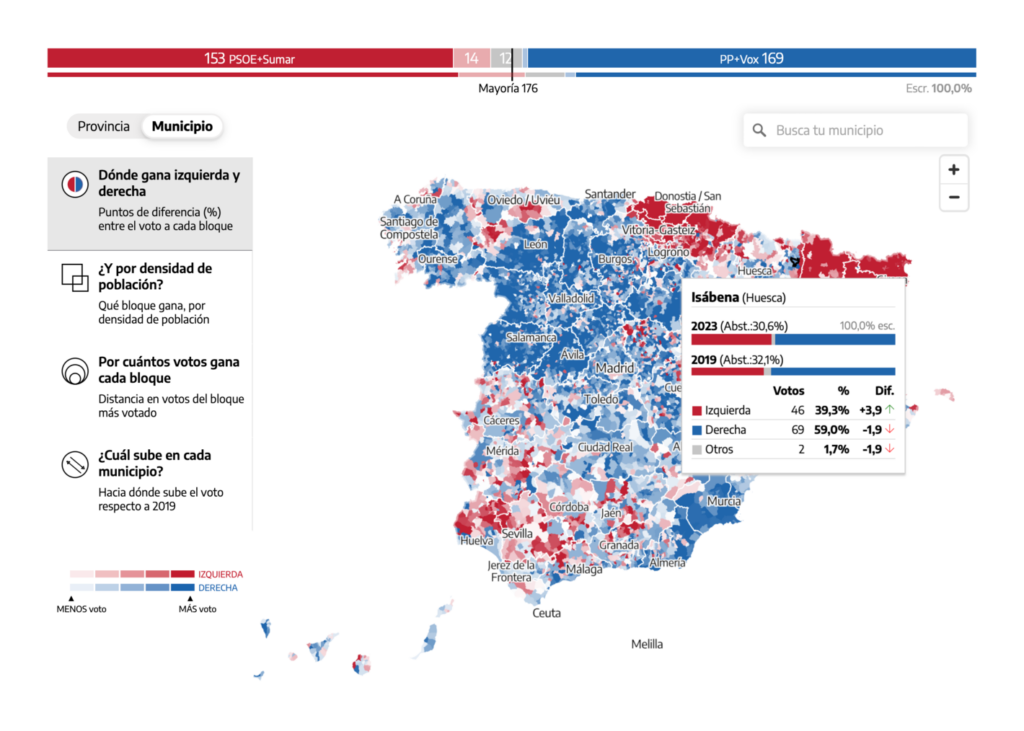
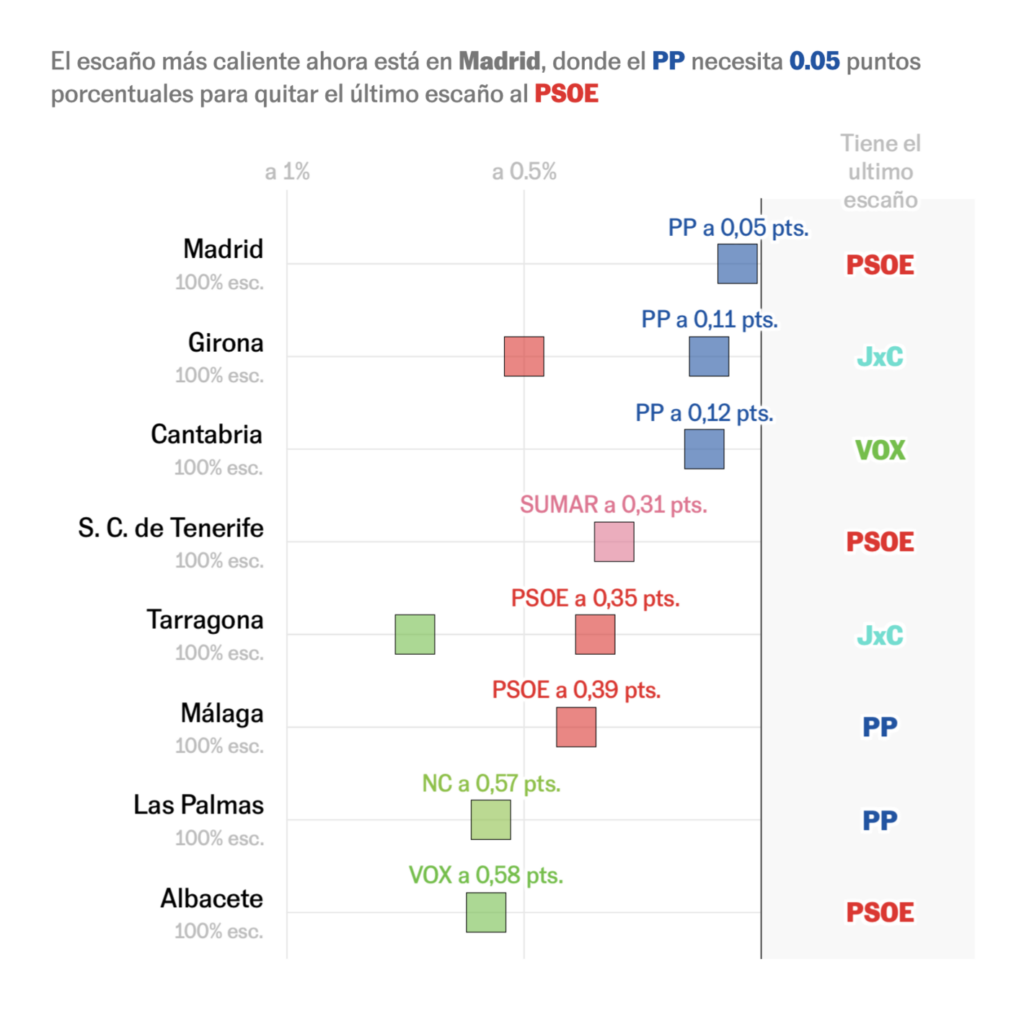
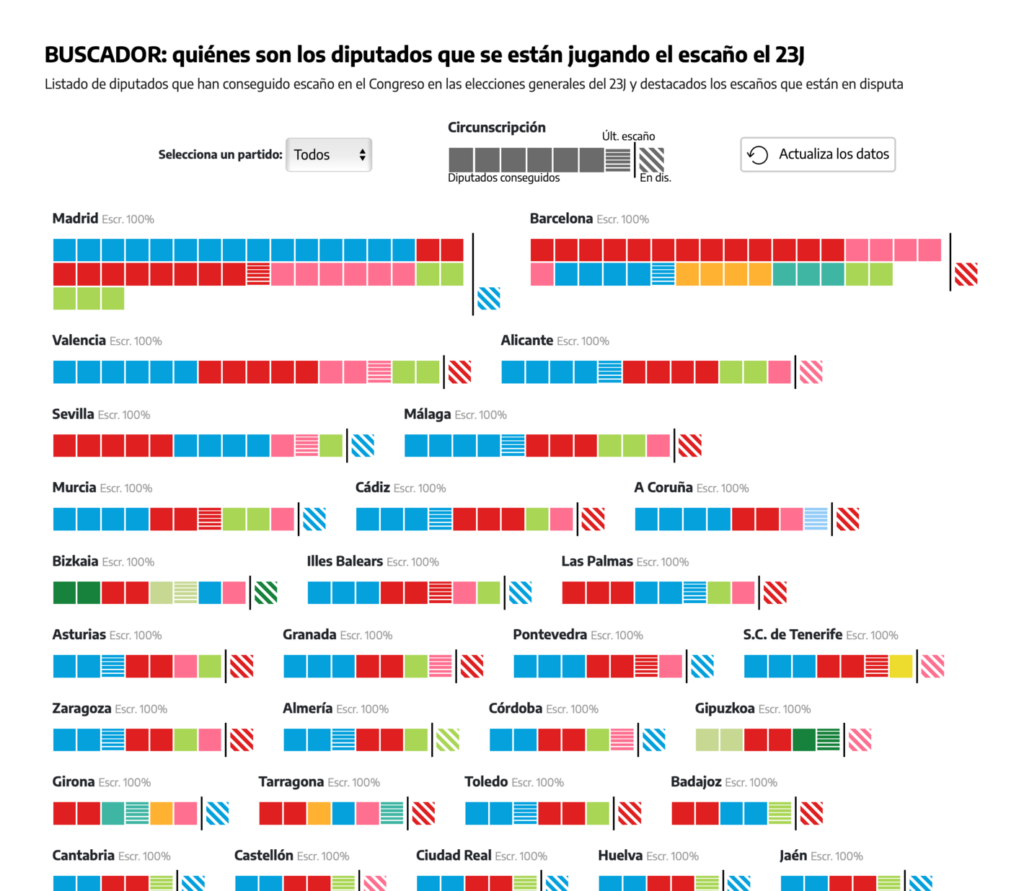
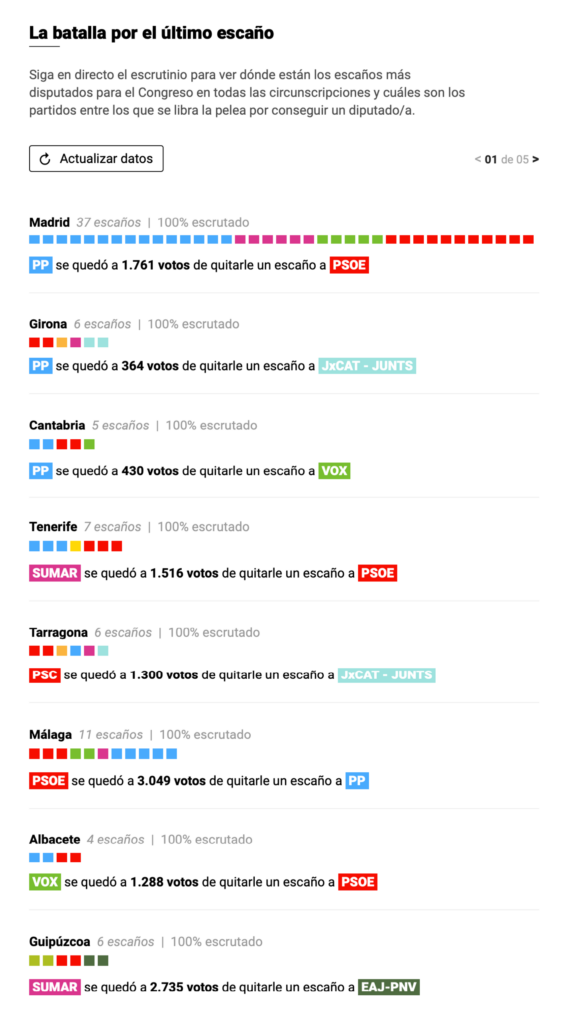
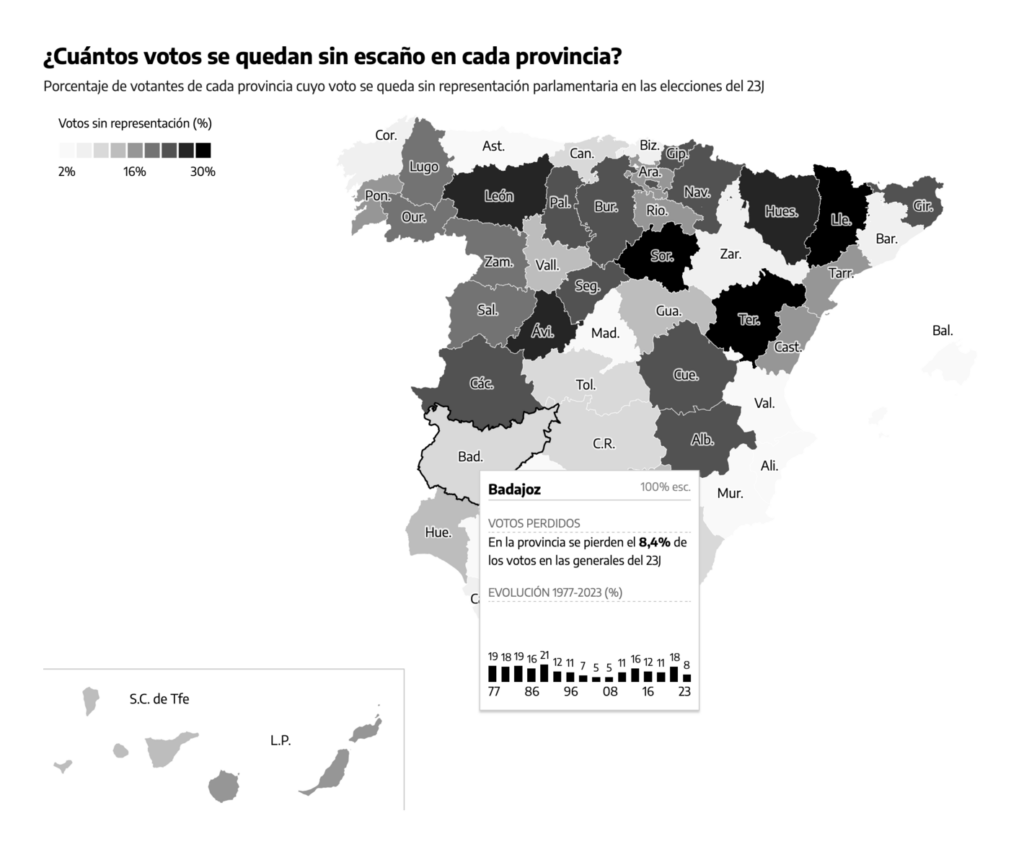
Spanish voters belong to geographical constituencies, which brings up the issue of strategic and “wasted” votes:

El País: Los escaños más disputados y en juego en cada provincia, July 23
elDiario: La batalla por el último escaño de cada provincia, en directo: quién puede ganar un diputado y quién lo pierde, July 23
El Confidencial: La batalla por el último escaño: el escrutinio, en directo, July 23
El País: ¿Voto estratégico? Los escaños en juego en cada provincia según las encuestas, July 21
elDiario: Los votos perdidos: Sumar es el partido más perjudicado por el sistema electoral con 600.000 votos sin representación, July 23

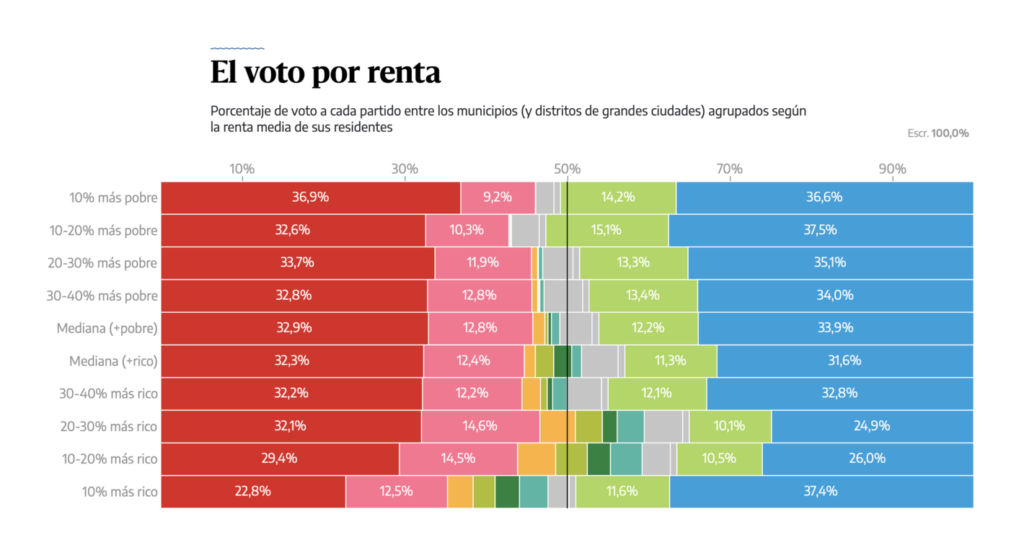
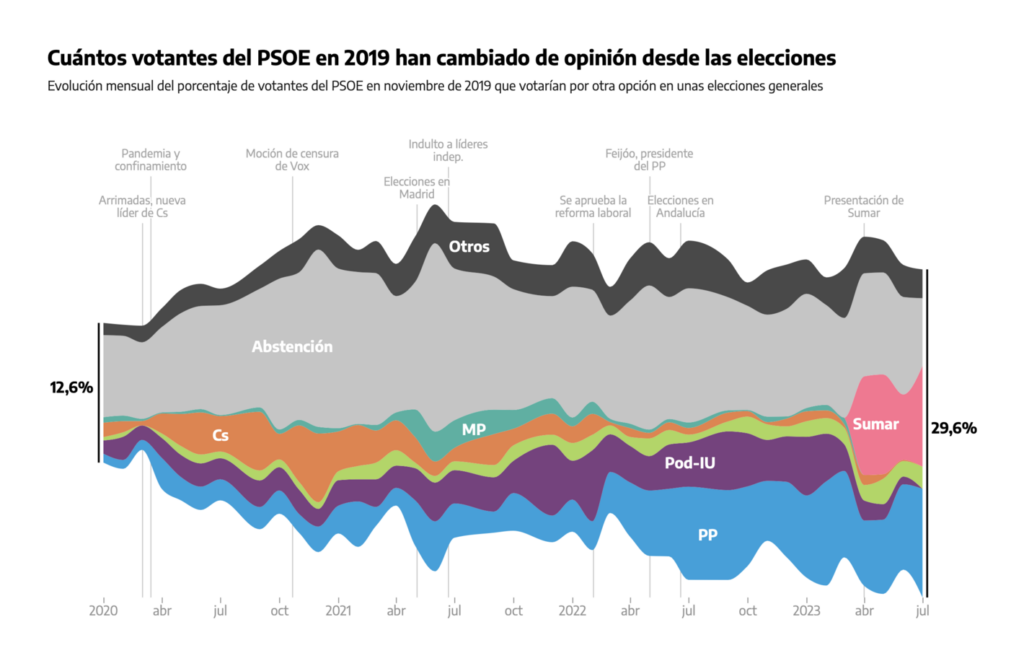
And we already saw some early analyses of voting behavior:

elDiario: La demografía del 23J: así vota cada grupo social en las elecciones generales, July 23
El Confidencial: La participación en cada municipio: consulta si ha subido o bajado en tu ciudad, July 23
elDiario: Votantes infieles: cómo han cambiado de partido quienes apoyaron a PSOE, PP, Unidas Podemos, Vox y Cs en 2019, July 20

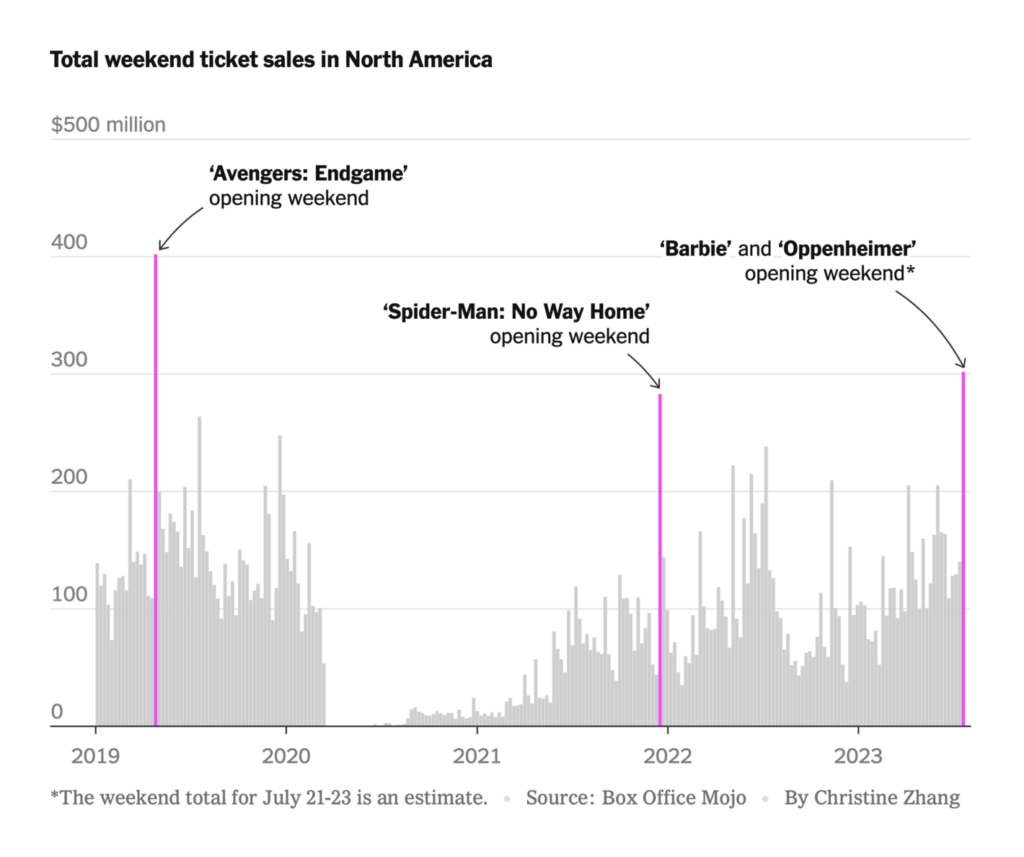
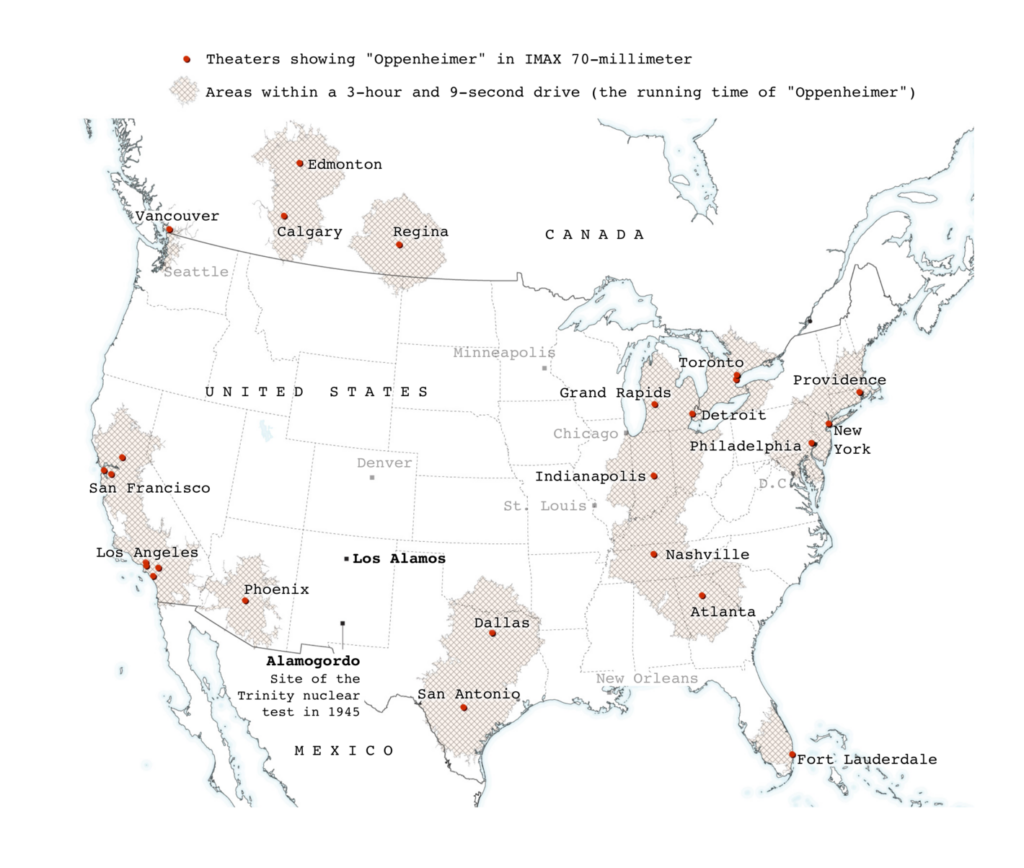
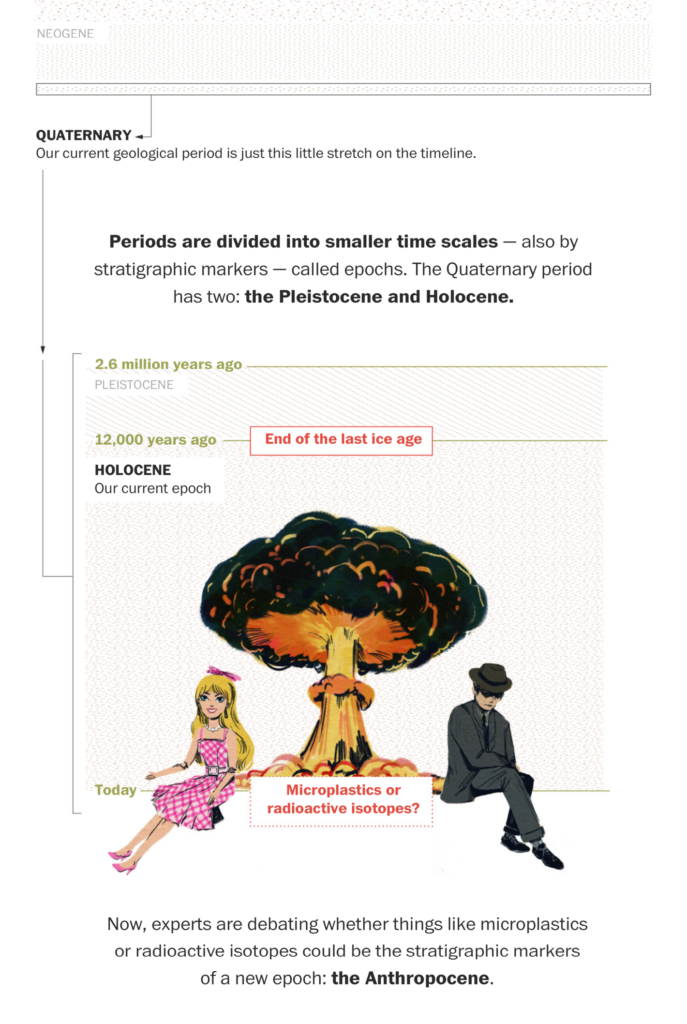
In slightly less important news, “Barbie.” Also “Oppenheimer“:

The New York Times: ‘Barbie’ Box Office to the World: The Pandemic Is Officially Over, July 23
The Washington Post: What Barbie’s many careers say about feminism and American girlhood, July 20
The Washington Post: Only 19 U.S. theaters will show ‘Oppenheimer’ in 70mm Imax. It’s epic, July 20
The Washington Post: ‘Barbie’ and ‘Oppenheimer’ tell the same terrifying story, July 19

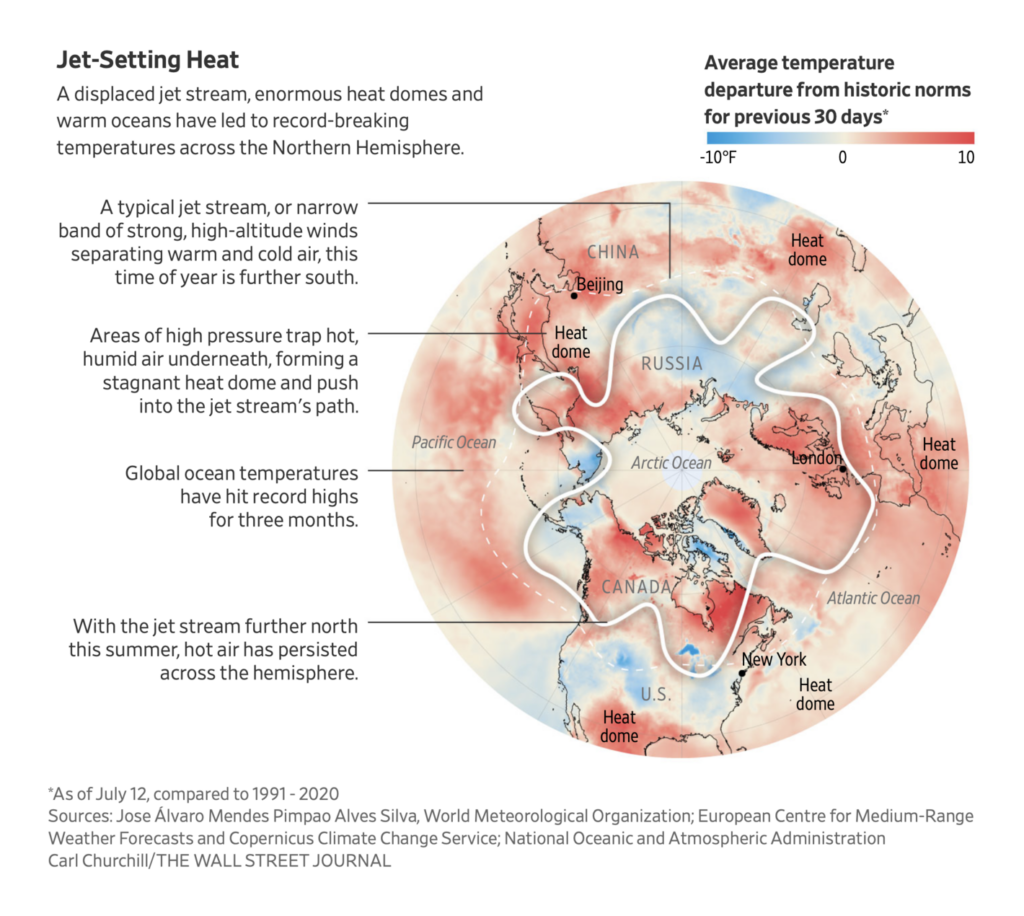
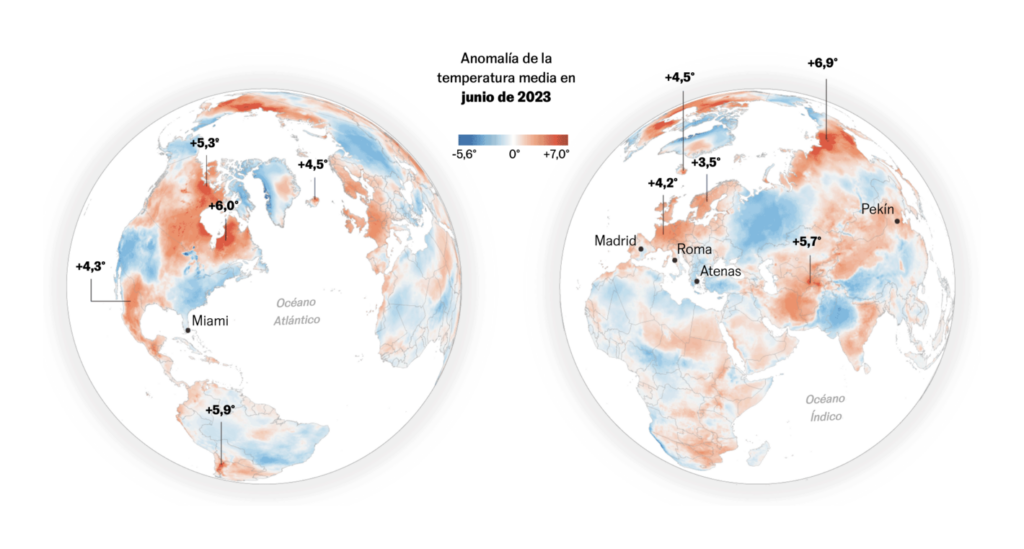
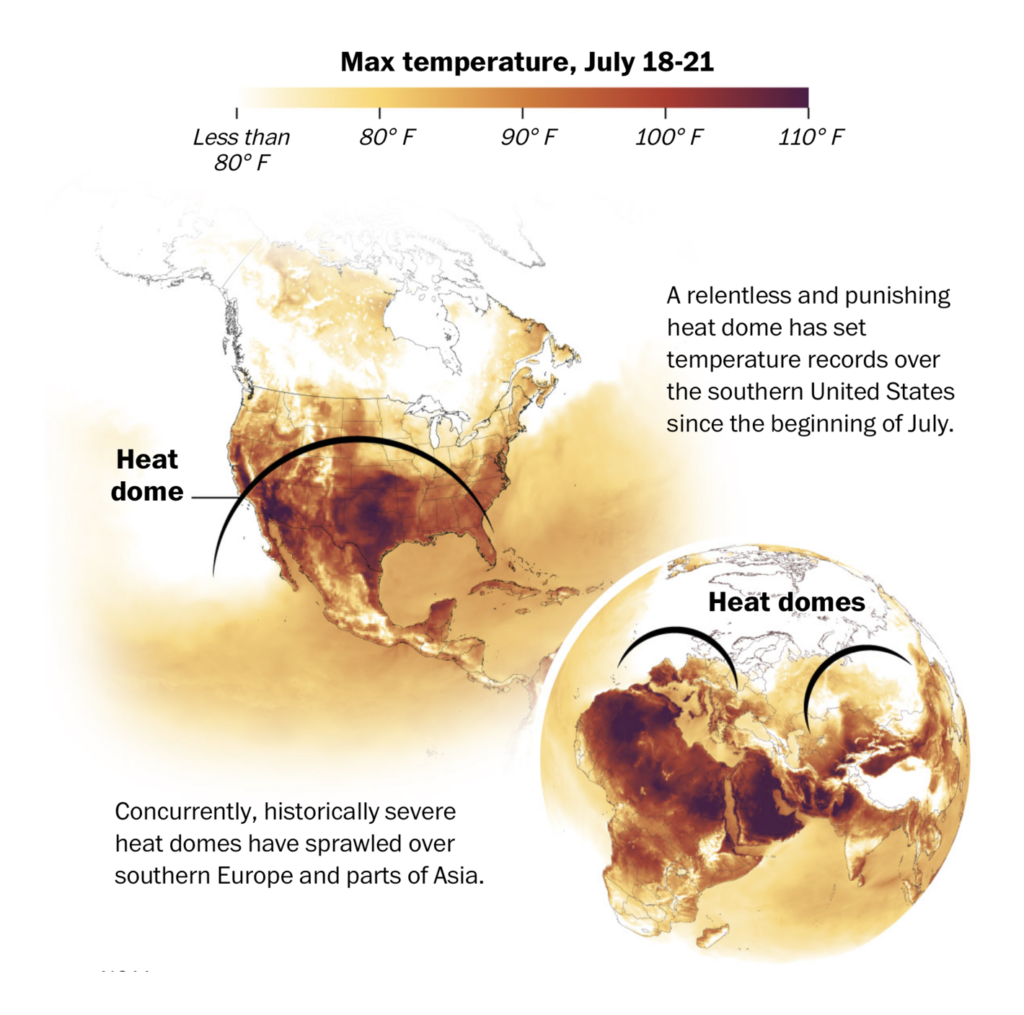
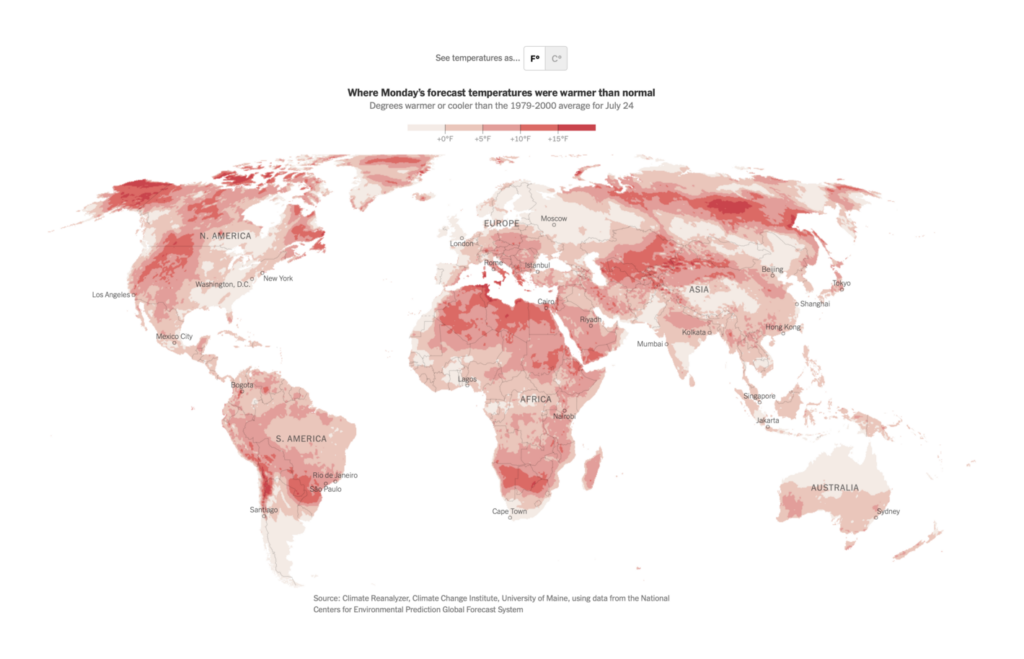
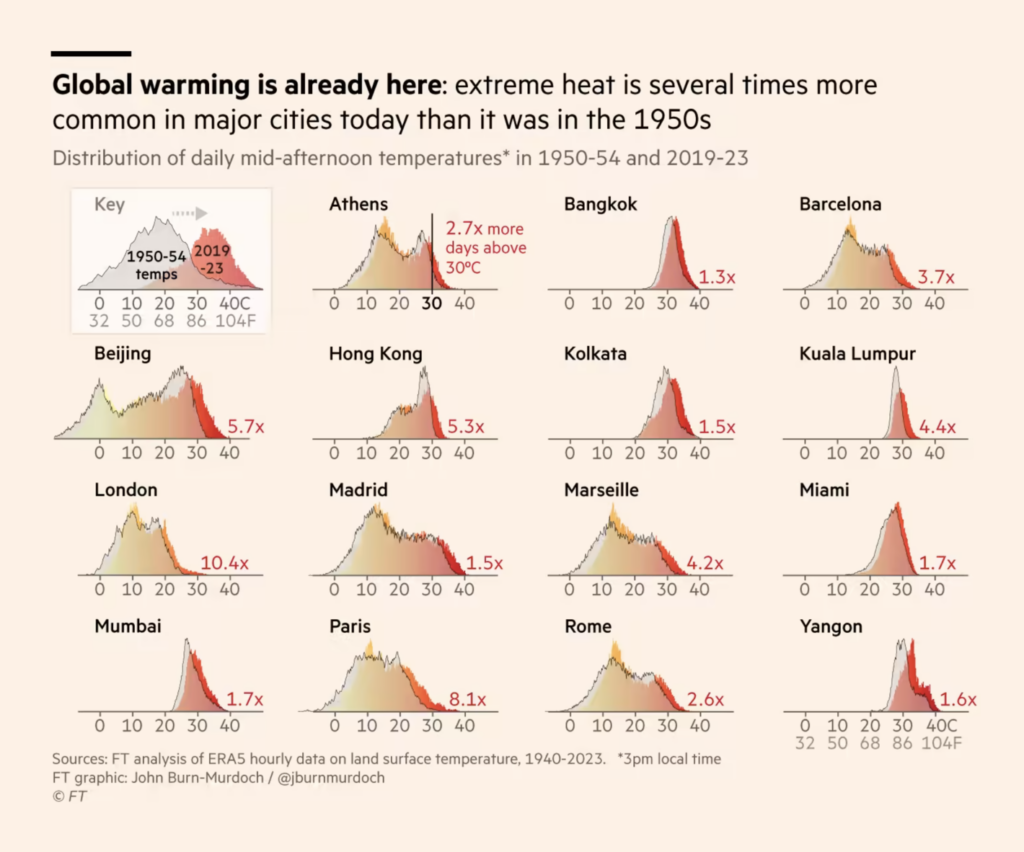
Meanwhile — it’s hot. We saw several great maps tackle the problem of showing a heat crisis that’s happening almost all around the world at once:

The Wall Street Journal: The World Bakes Under Extreme Heat, July 19
El País: Calor extremo y global: crónica de los días más tórridos del planeta, July 22
The Washington Post: Inside the most extreme heat wave the Southern U.S. has faced, July 21
Steven Bernard / Financial Times: “NEW: This week’s climate graphic focuses on the extreme heat over the US, southern Europe and China, caused by the ‘wavenumber 5’ jet stream pattern and heat domes. First time combining two data sets in one animation Read @CamillaHodgson’s report,” July 20 (Tweet, Article)
The New York Times: Tracking Heat Across the World, July 19
Financial Times: What we get wrong when we talk about global warming, July 21
CBC News: How hot and humid will your city be in the future?, July 18
Financial Times: How will global warming affect the crops that we grow?, July 20

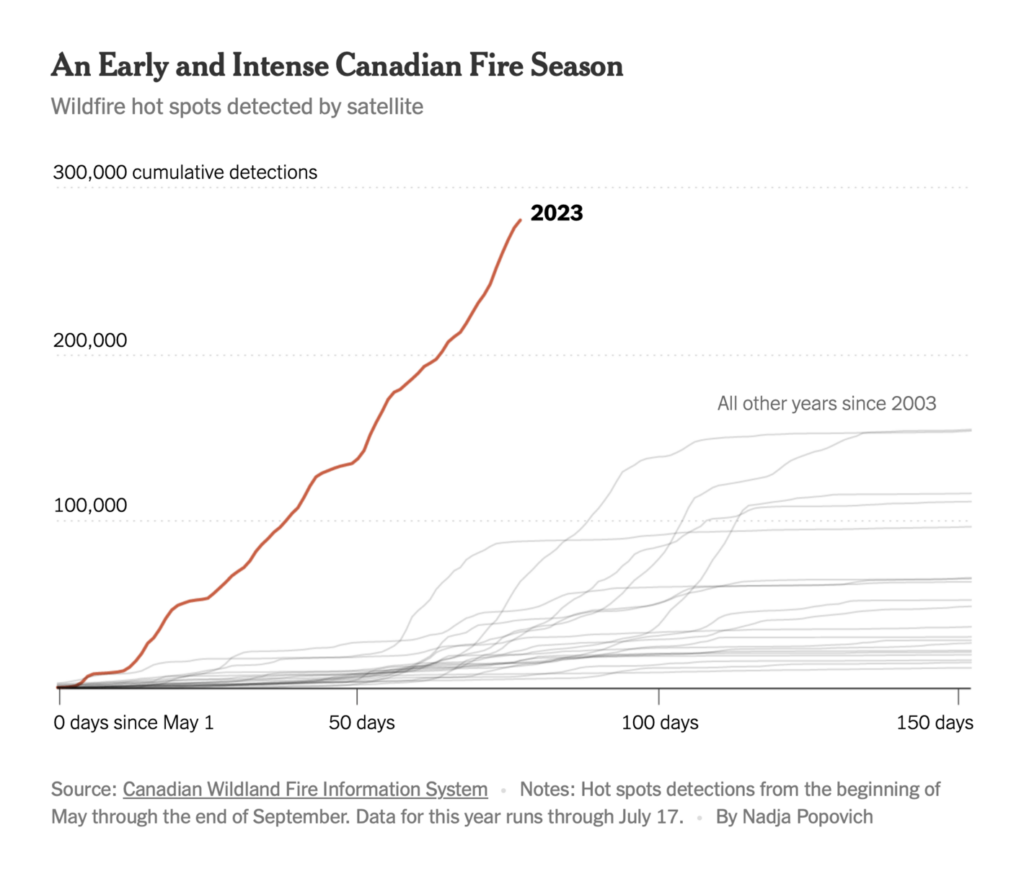
Lots of places are dangerously hot; only some of them are actually on fire:

Reuters: Canadian wildfires burning land at record pace, July 24
The New York Times: How Canada’s Record Wildfires Got So Bad, So Fast, July 18

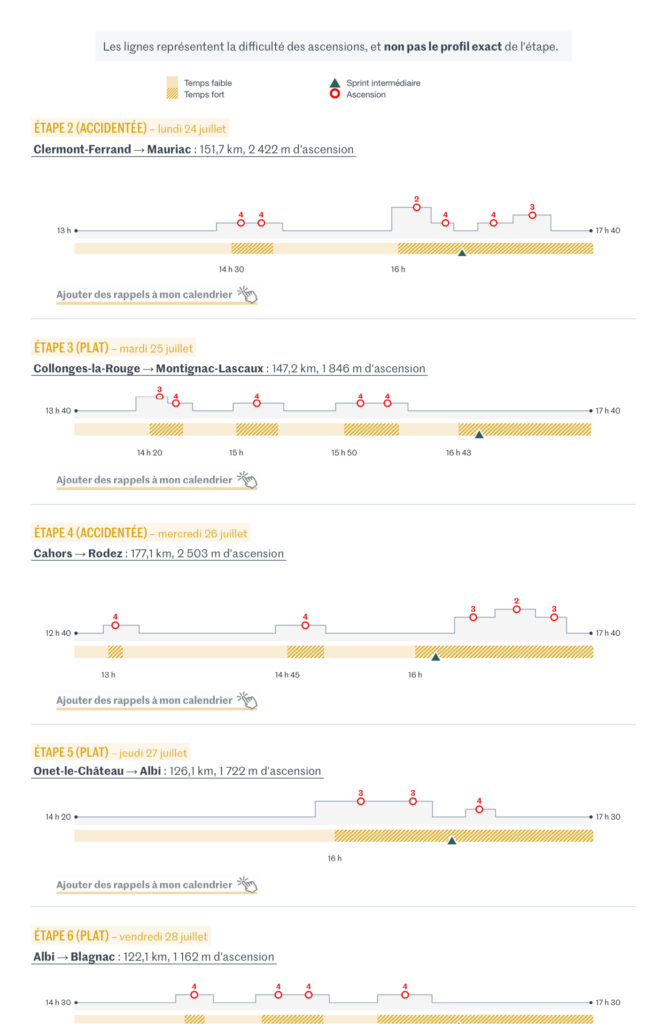
Ok, back to fun stuff. Sporting events this week included the Women’s World Cup, the Tour de France, and a multimodal, journalists-only race from Philadelphia to the Jersey Shore:

The New York Times: Why U.S. Players Will Get the Most Prize Money, Even if They Lose, July 21
Le Monde: Le Tour de France Femmes 2023 commence ce dimanche, voici les moments forts à ne pas rater, July 24
The New York Times: Watch Amateurs Race Against the Tour de France’s Top Climbers (Sort Of), July 23
The Philadelphia Inquirer: The Race to the Shore, July 18

College admissions in America remain a hot topic:

The New York Times: Study of Elite College Admissions Data Suggests Being Very Rich Is Its Own Qualification, July 24
The San Francisco Chronicle: These charts show which Californians go to the most selective colleges, July 21

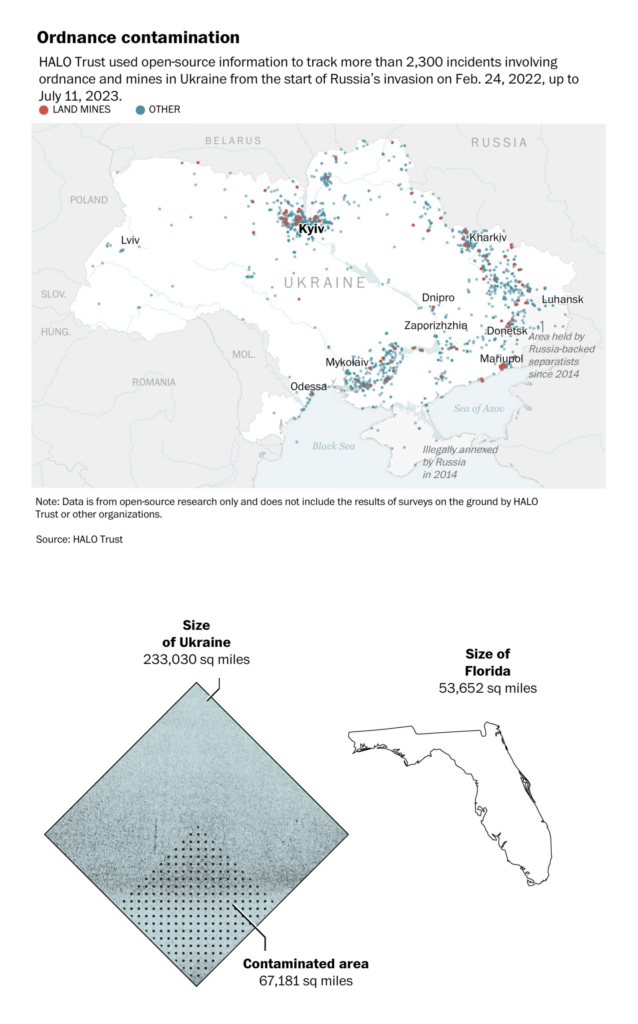
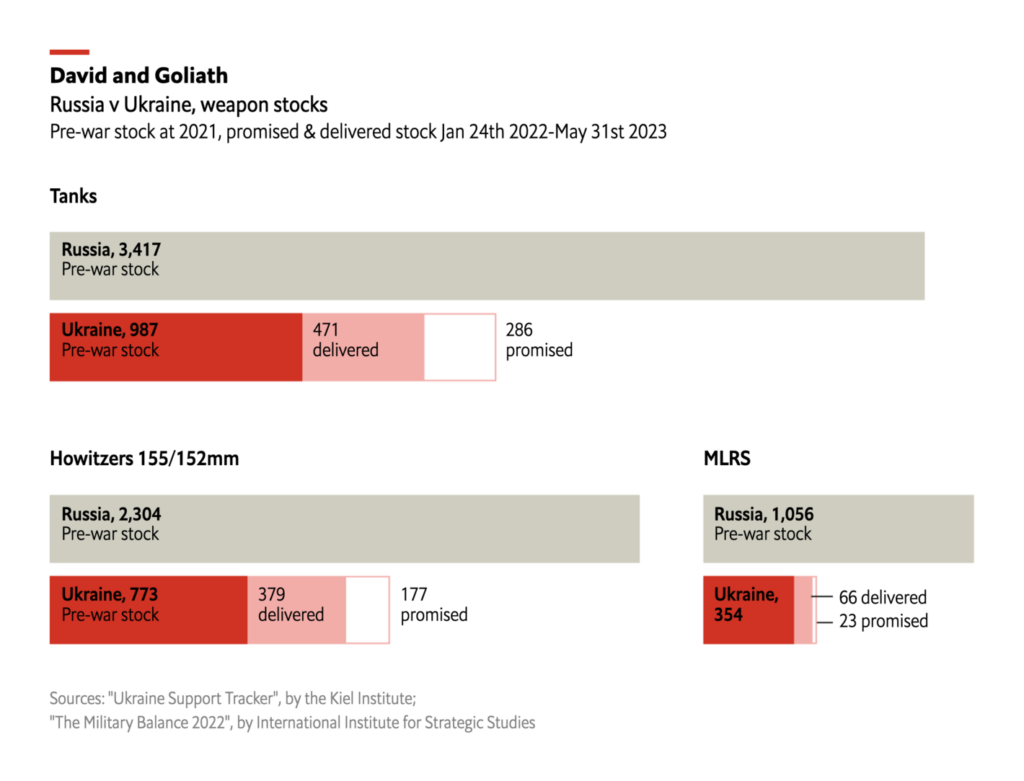
And this week’s data news from Ukraine focused on land mines and weapon stocks:

The Washington Post: Ukraine is now the most mined country. It will take decades to make safe, July 22
The Economist: Could Ukraine’s allies be sending it more weapons?, July 20

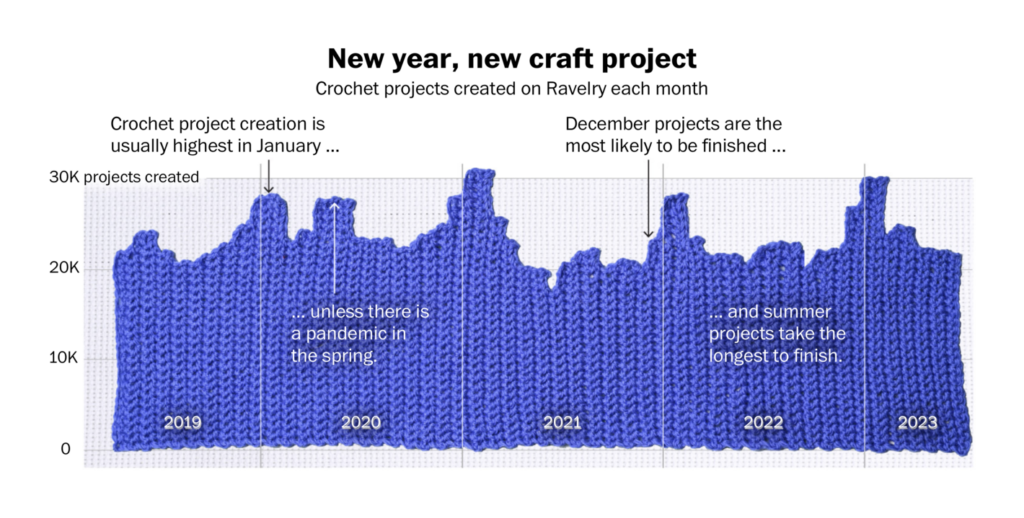
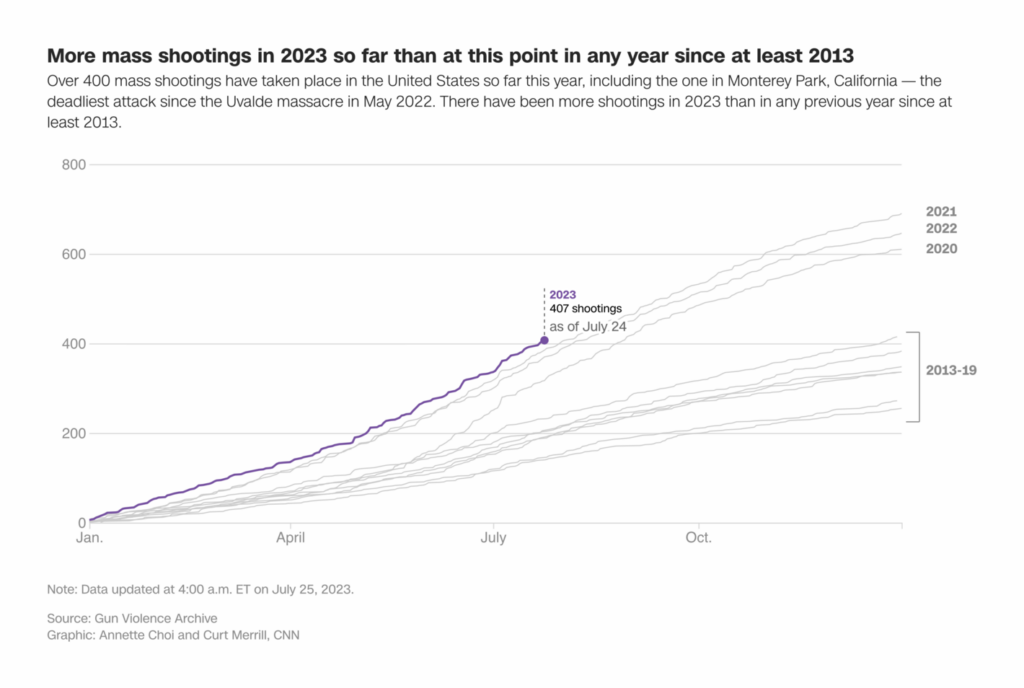
Purple was this week’s color for charts:

The Washington Post: The yarn crafts most likely to fail by season and type, July 20
CNN: United States tops 400 mass shootings in 2023, July 24
Frankfurter Allgemeine: Deutschlands Wohnungsnot, July 24
The Pudding: Women are superstars on stage, but still rarely get to write, July 20

And other maps covered everything from the danger of an oil spill in the Red Sea to broken promises in New York real estate:

The Wall Street Journal: The Race to Avert an Oil Spill That Could Cost $20 Billion to Fix, July 23
Folha de S.Paulo: Veja as taxas dos principais registros de crimes em seu estado, July 20
The New York Times: New Yorkers Got Broken Promises. Developers Got 20 Million Sq. Ft., July 21

What else we found interesting

South China Morning Post: The 24 terms in the solar calendar, July 22

Applications are open for…


Help us make this dispatch better! We’d love to hear which newsletters, blogs, or social media accounts we need to follow to learn about interesting projects, especially from less-covered parts of the world (Asia, South America, Africa). Write us at hello@datawrapper.de or leave a comment below.

Want the Dispatch in your inbox every Tuesday? Sign up for our Blog Update newsletter!

Comments