This article is brought to you by Datawrapper, a data visualization tool for creating charts, maps, and tables. Learn more.
Data Vis Dispatch, June 14
The best of last week’s big and small data visualizations

Welcome back to the 49th edition of Data Vis Dispatch! Every week, we’ll be publishing a collection of the best small and large data visualizations we find, especially from news organizations — to celebrate data journalism, data visualization, simple charts, elaborate maps, and their creators.
Recurring topics this week include pollution, inflation, and legislative elections in France.
This week’s miscellaneous section was too good to leave for last:

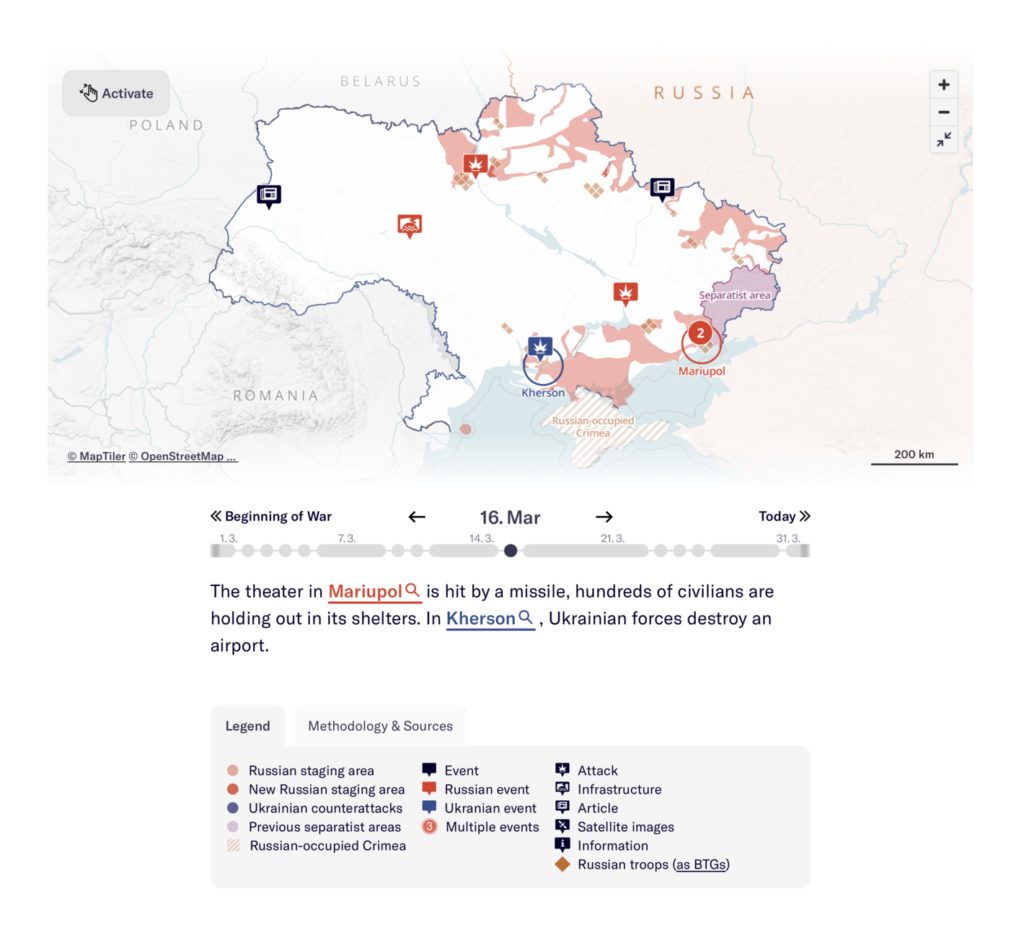
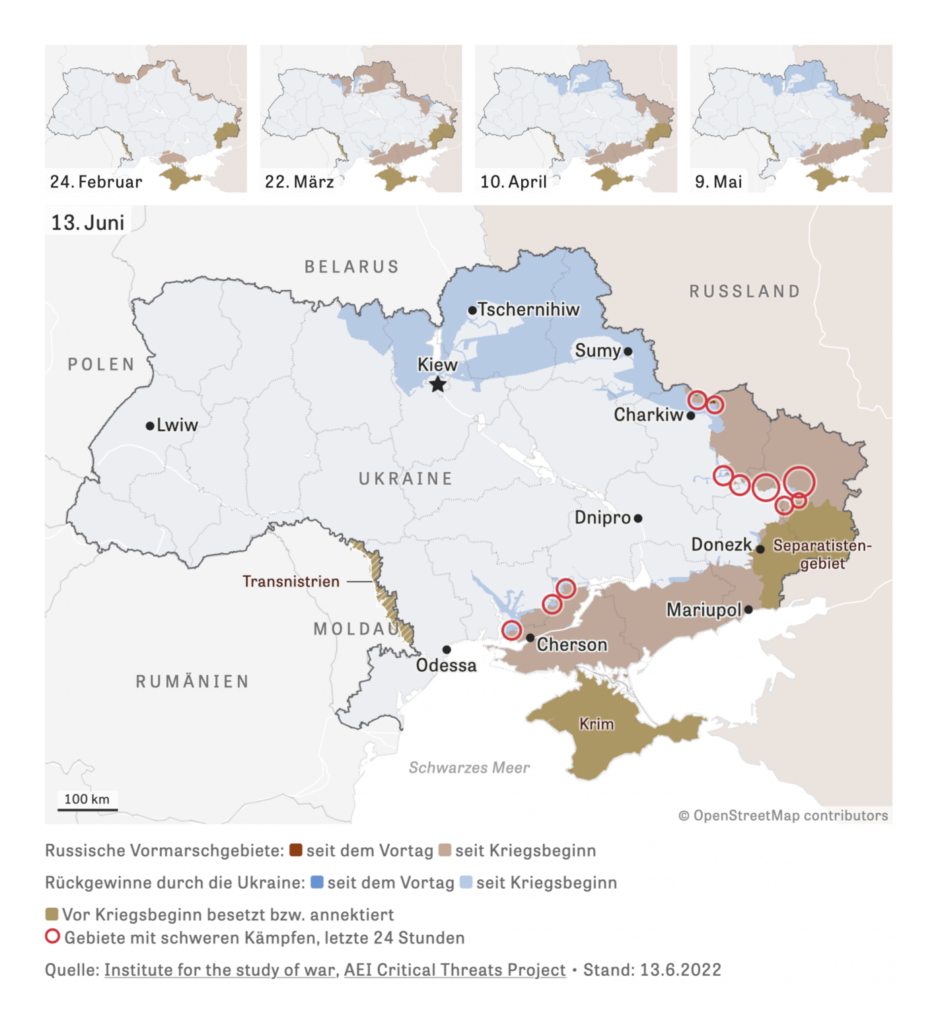
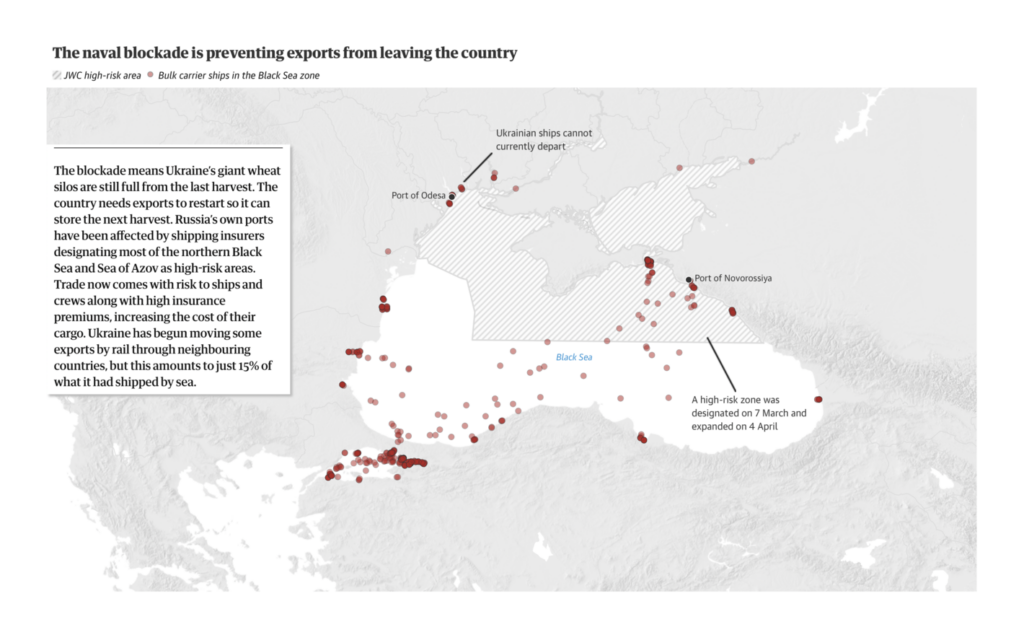
Russia continues its attack on Ukraine:


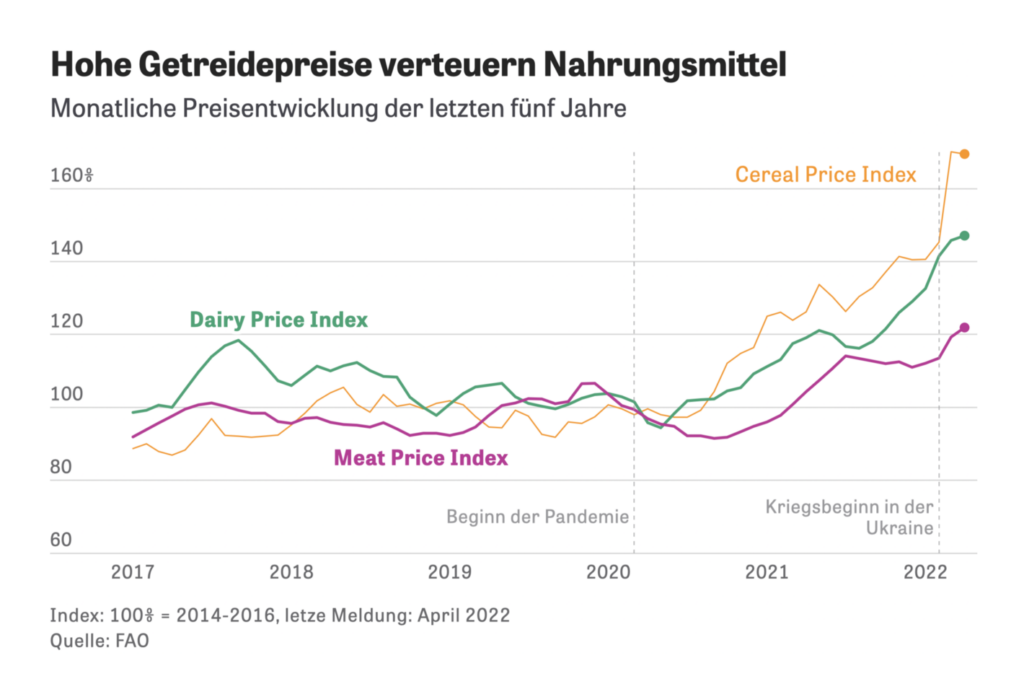
In blockading Ukraine’s ports on the Black Sea, Russia also risks provoking a global food crisis:

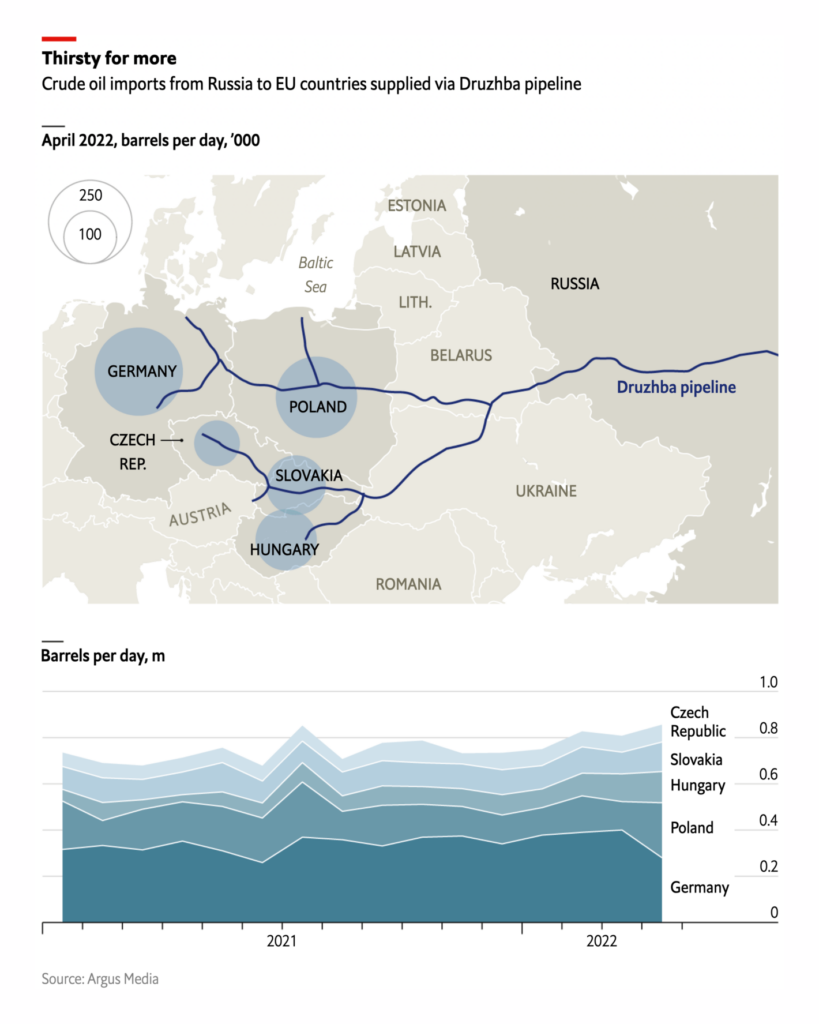
While at the same time, oil exports from Russia to the EU are up since the beginning of this year:
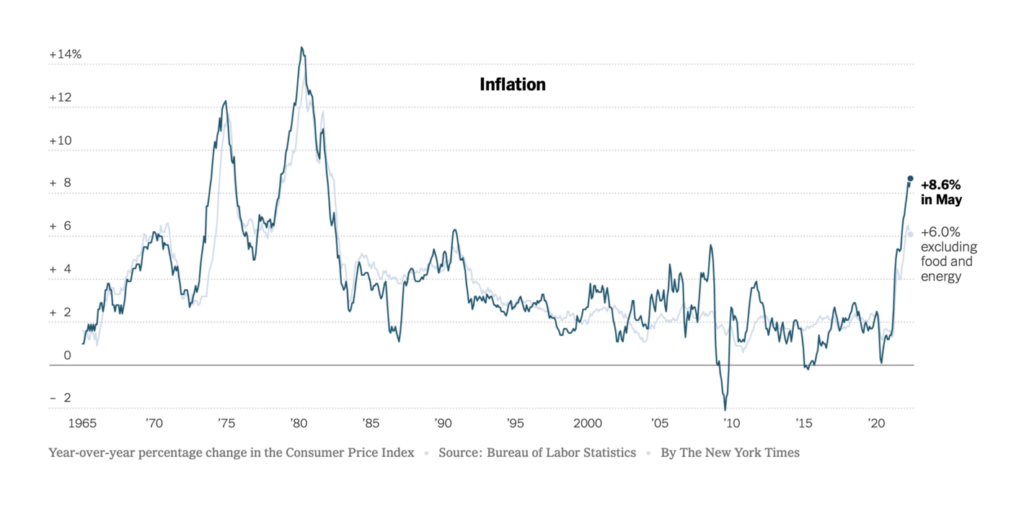
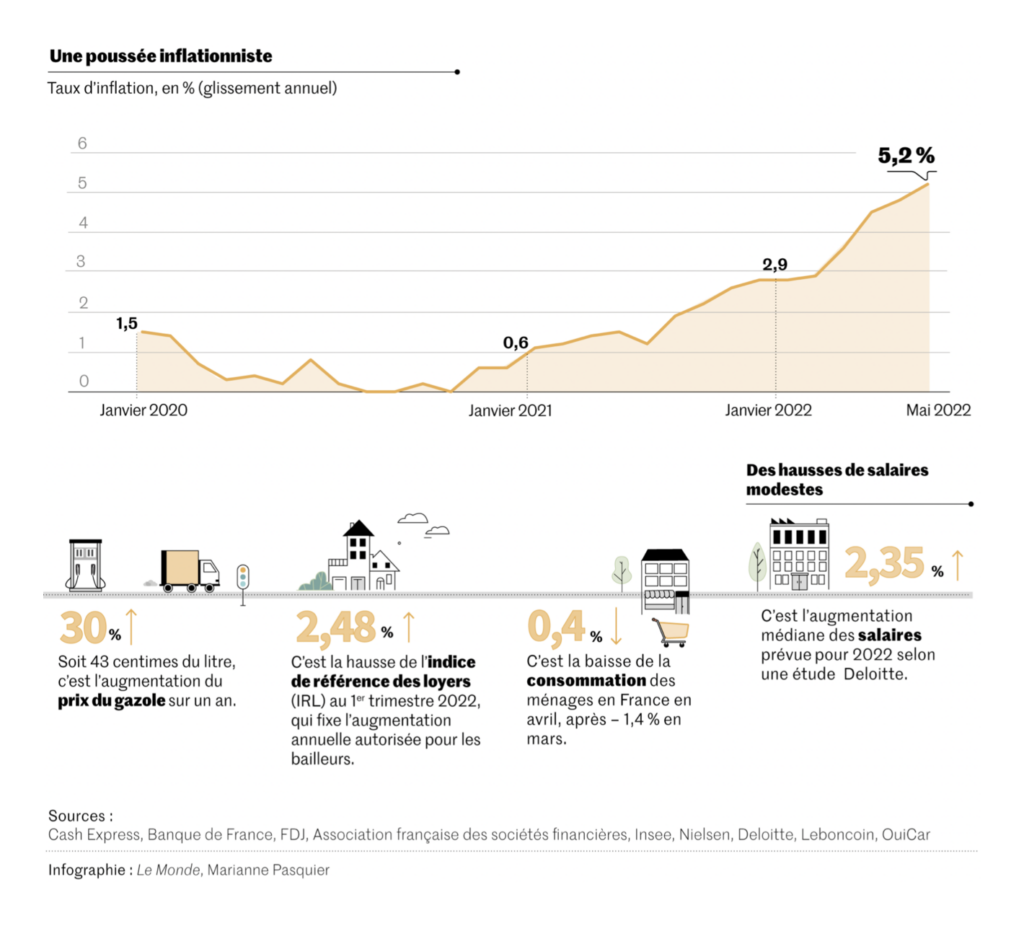
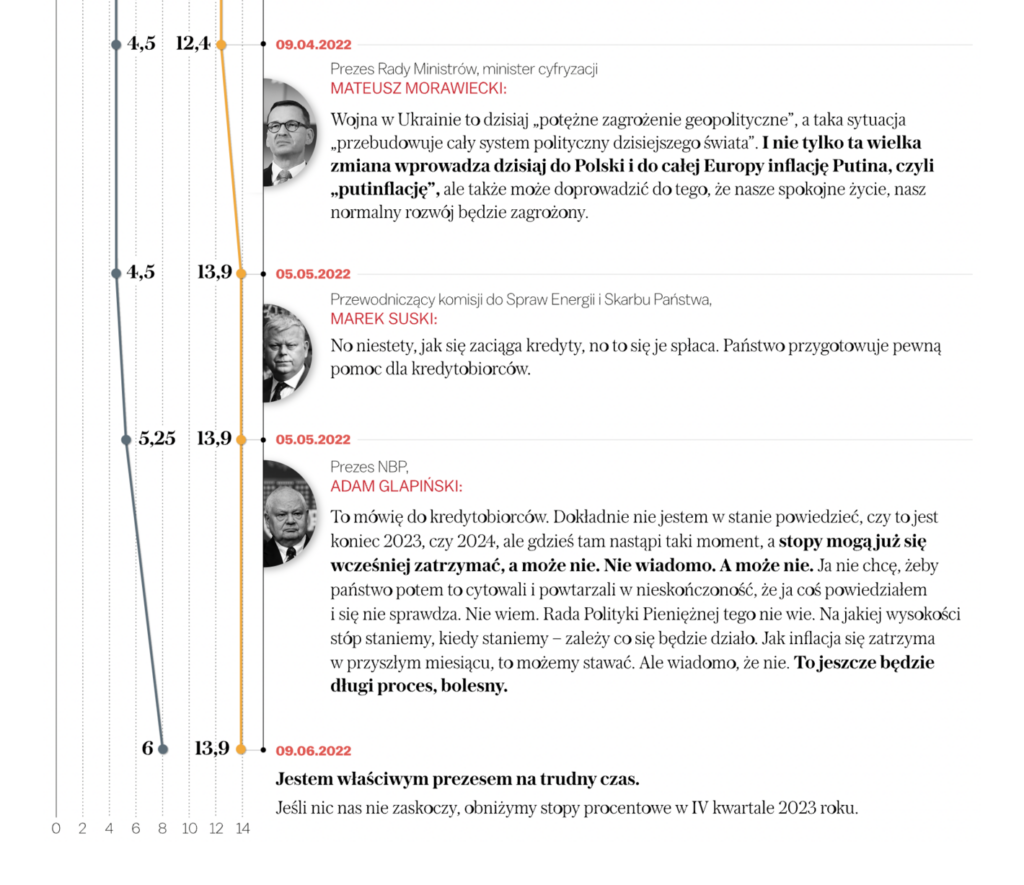
The war is one factor behind rising inflation around the world. We saw charts with the latest numbers from the United States, Russia, France, Poland, and Germany:

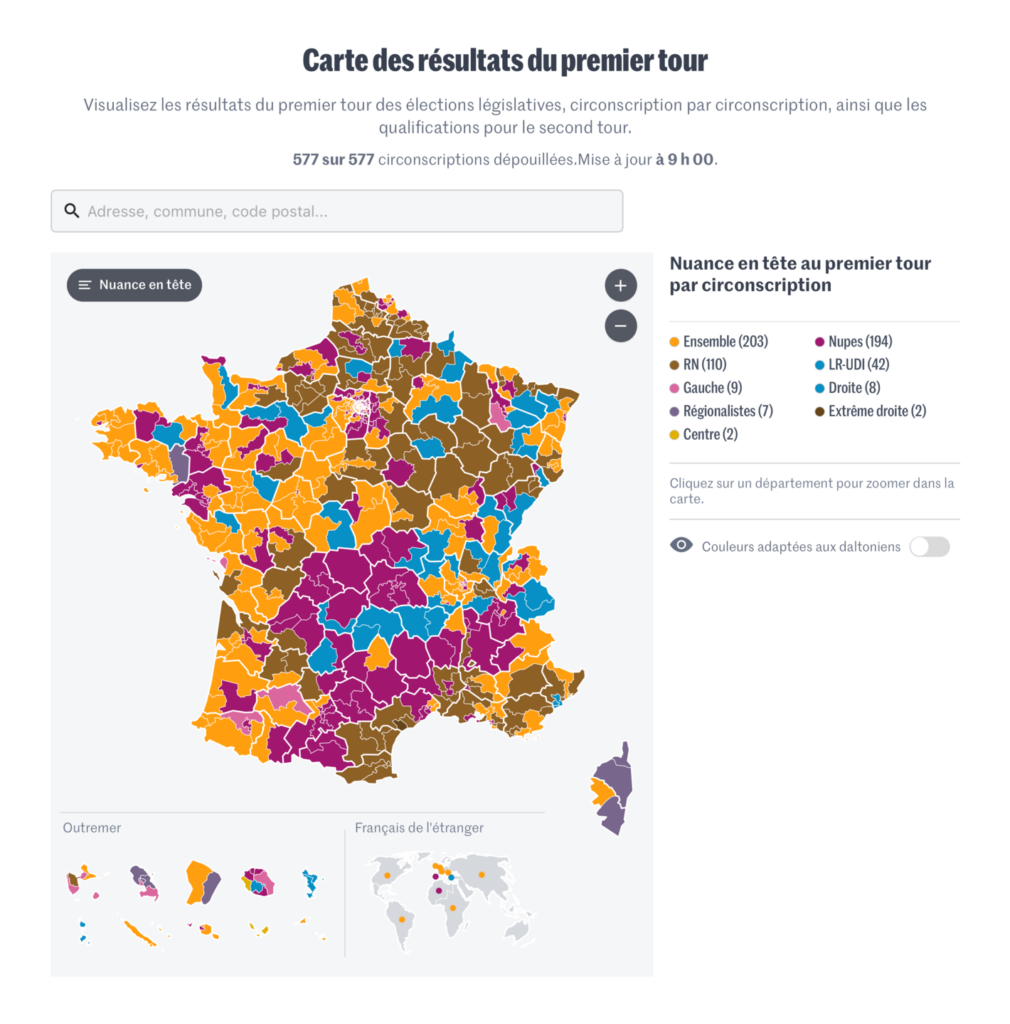
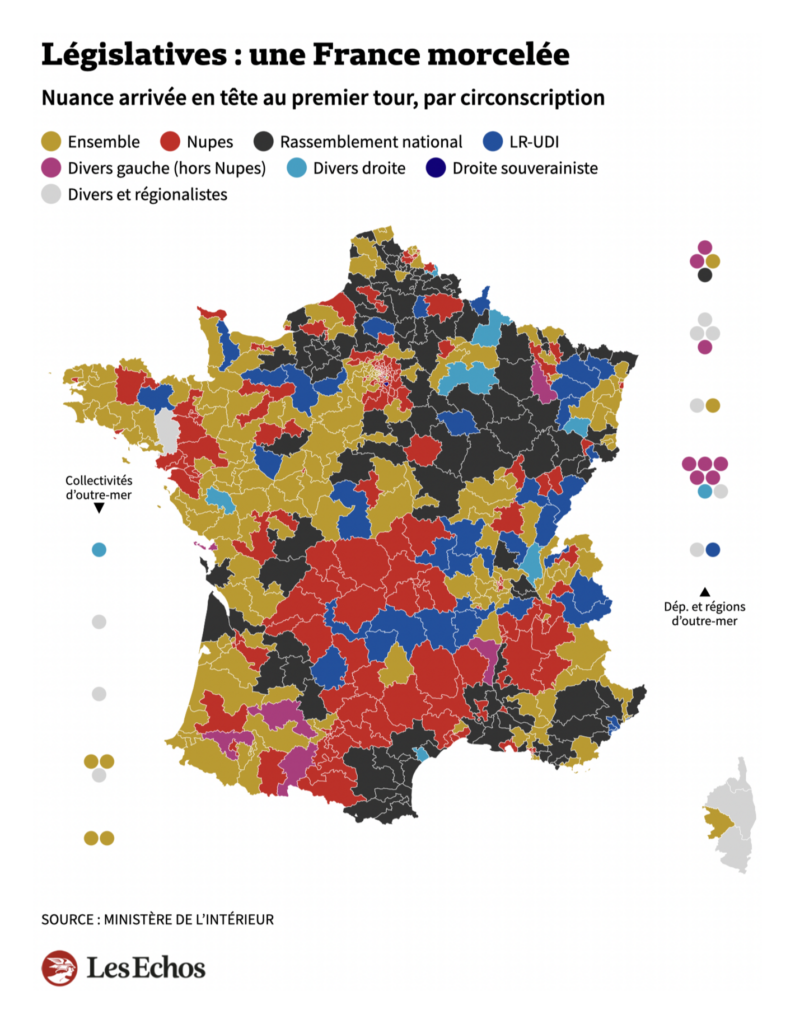
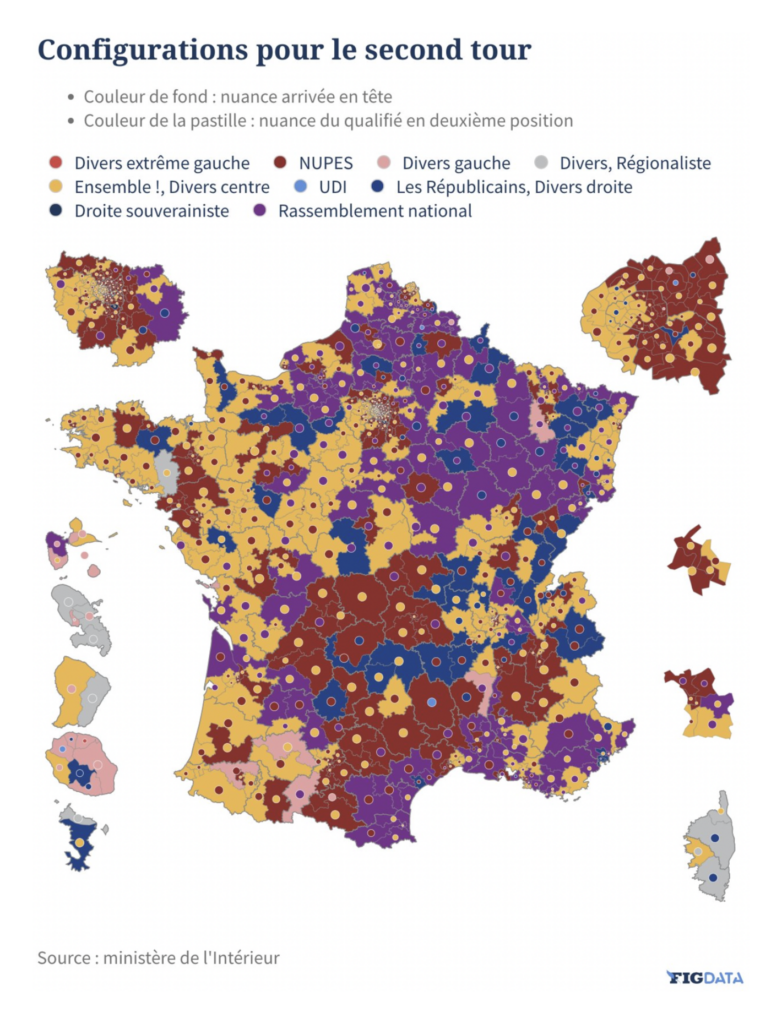
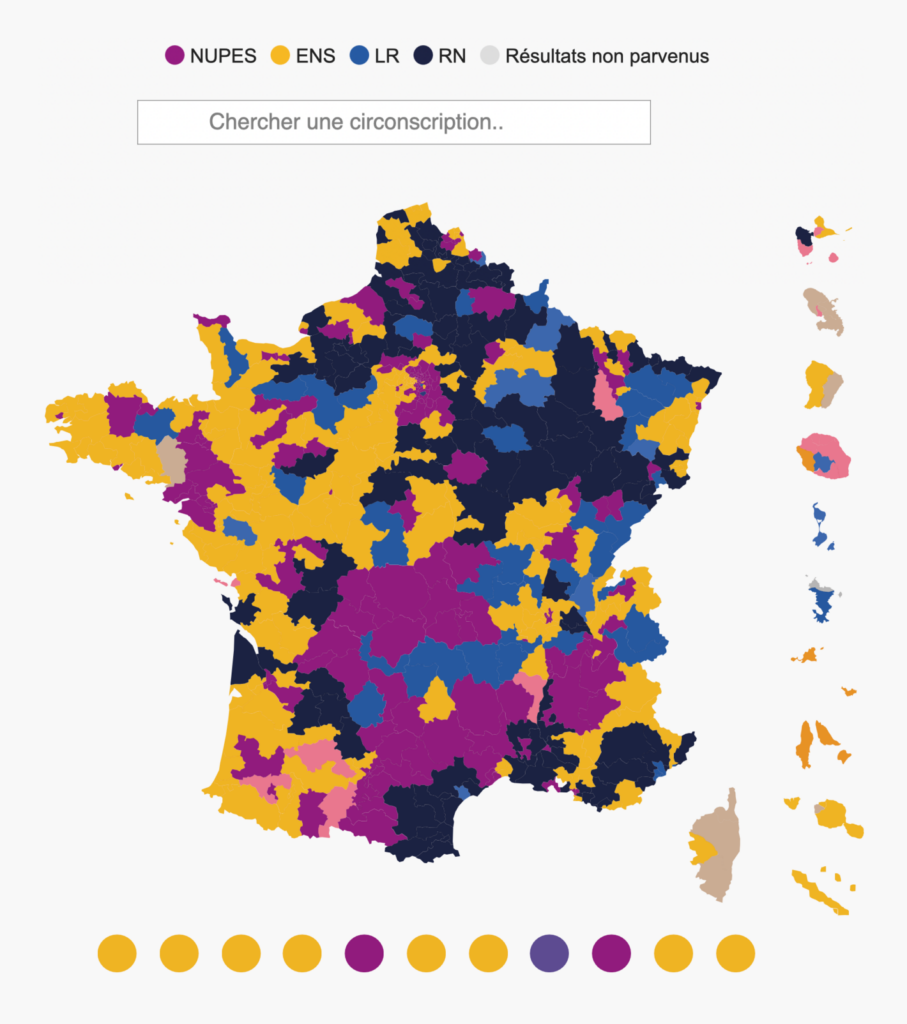
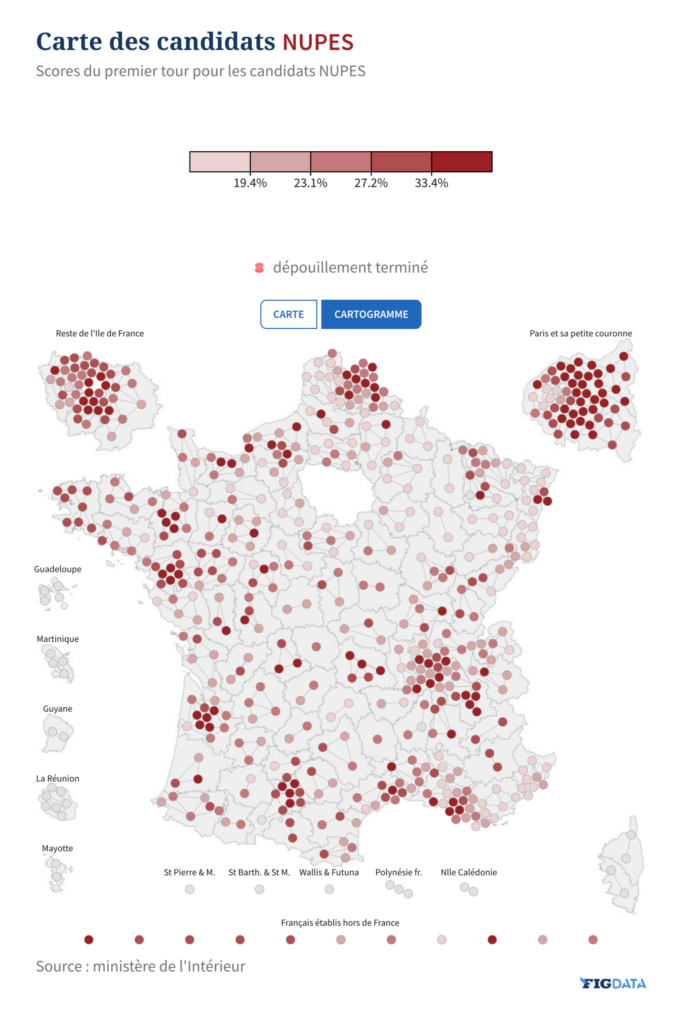
First-round legislative elections were held this Sunday in France:
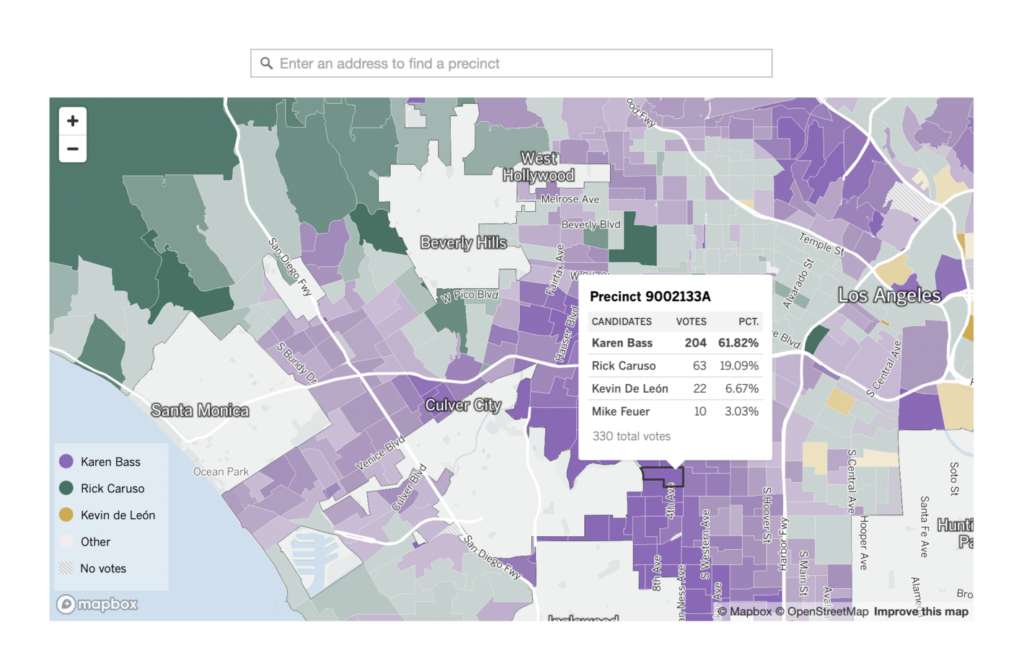
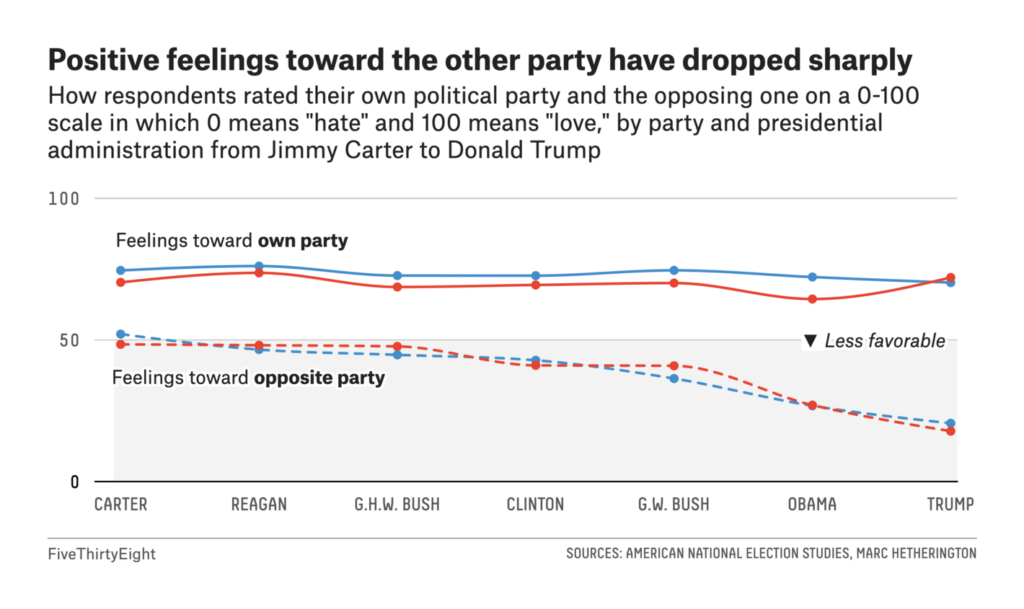
U.S political charts covered primary elections in Los Angeles and partisan sentiment over the past 45 years:
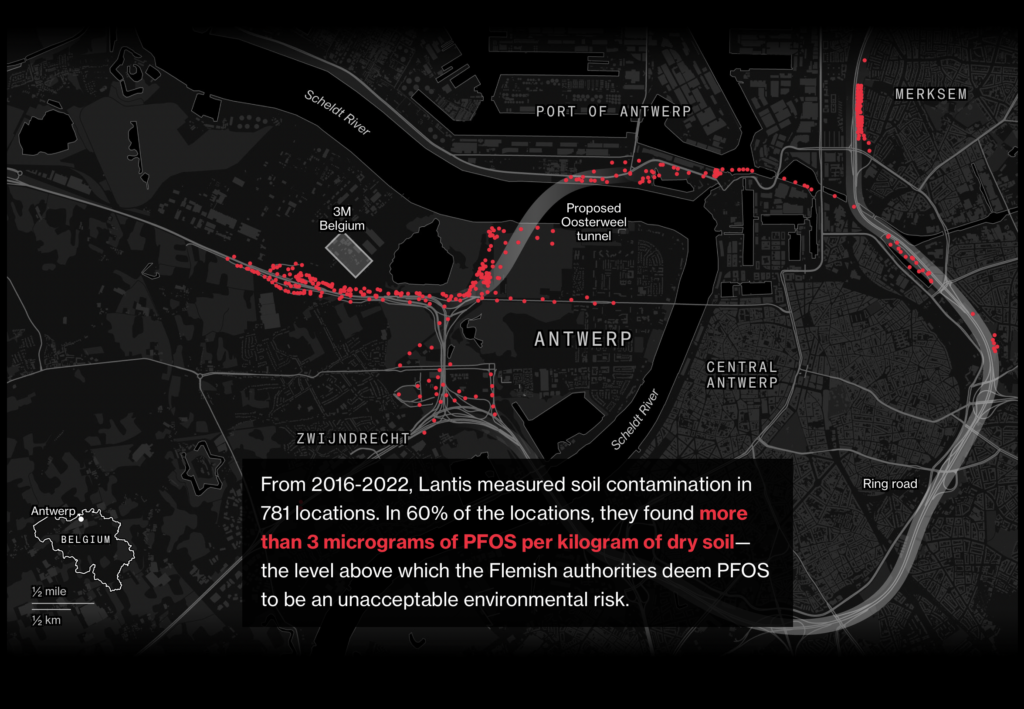
Finally, environmental topics included everything from industrial pollution in Antwerp to the dangers of litter in space:


What else we found interesting


Applications are open for…
- A data product owner at Der Spiegel
- A news applications developer at The City
- A news designer at The Washington Post
- A data vis writer and a data vis evangelist at Datawrapper!
Help us make this dispatch better! We’d love to hear which newsletters, blogs, or social media accounts we need to follow to learn about interesting projects, especially from less-covered parts of the world (Asia, South America, Africa). Write us at hello@datawrapper.de or leave a comment below.
Want the Dispatch in your inbox every Tuesday? Sign up for our Blog Update newsletter!


Comments