This article is brought to you by Datawrapper, a data visualization tool for creating charts, maps, and tables. Learn more.
Data Vis Dispatch, June 22
The best of last week’s big and small data visualizations


Welcome to the very first edition of the Data Vis Dispatch! Starting today, we will publish a collection of the best small and large data visualizations (that we find) every week, especially — but not exclusively — from news organizations. We do so to celebrate data journalism, data visualization, simple charts, and elaborate maps. And we also do it to applaud their creators for putting in the extra effort to make their visualizations understandable, truthful, and beautiful.
Recurring themes in this week’s charts and maps include the Euro Cup, ranked-choice voting, extreme weather, and (of course) the changing phases of the pandemic. Let’s get started!
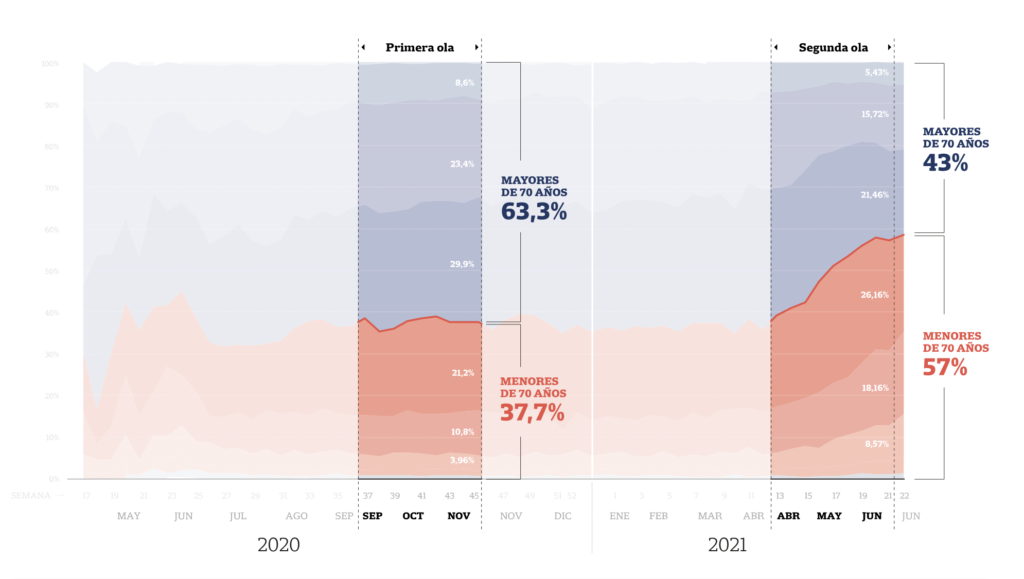
It wouldn’t be 2021 without a few COVID charts to start us off. The first two show cases shifting from the old to the young in both Argentina and Brazil:

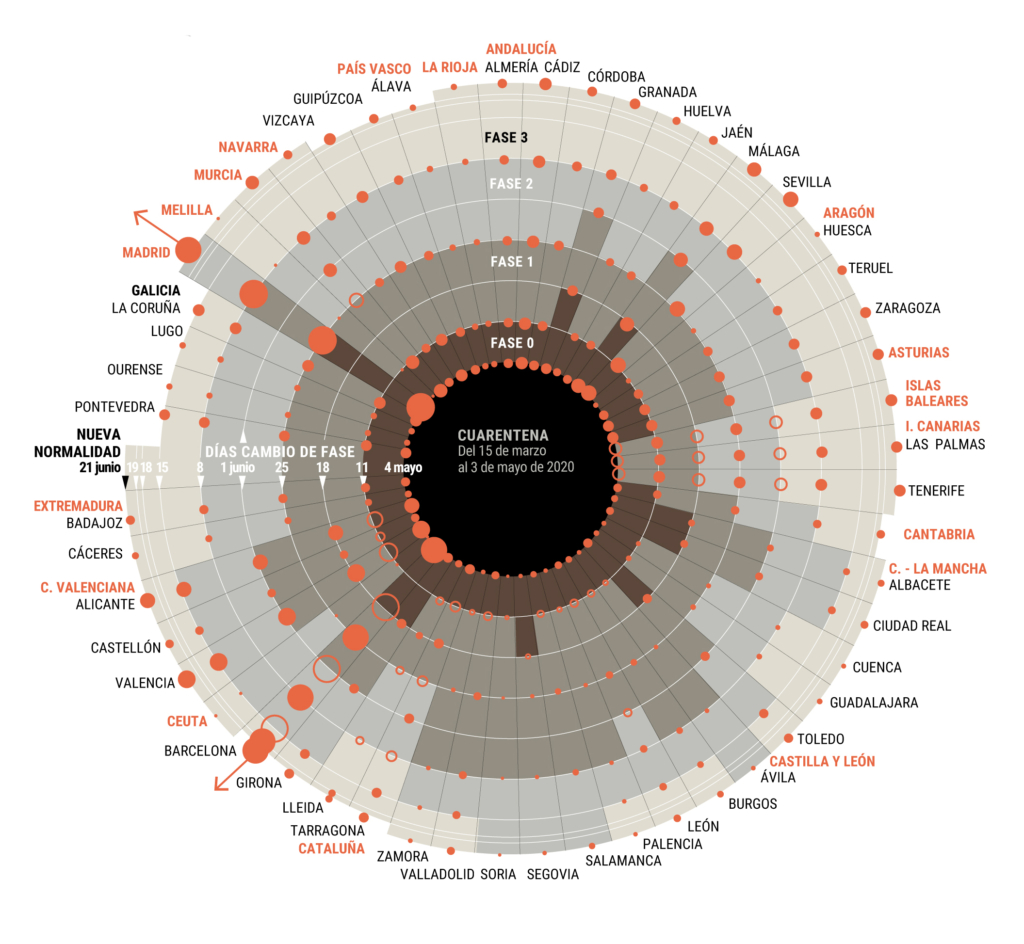
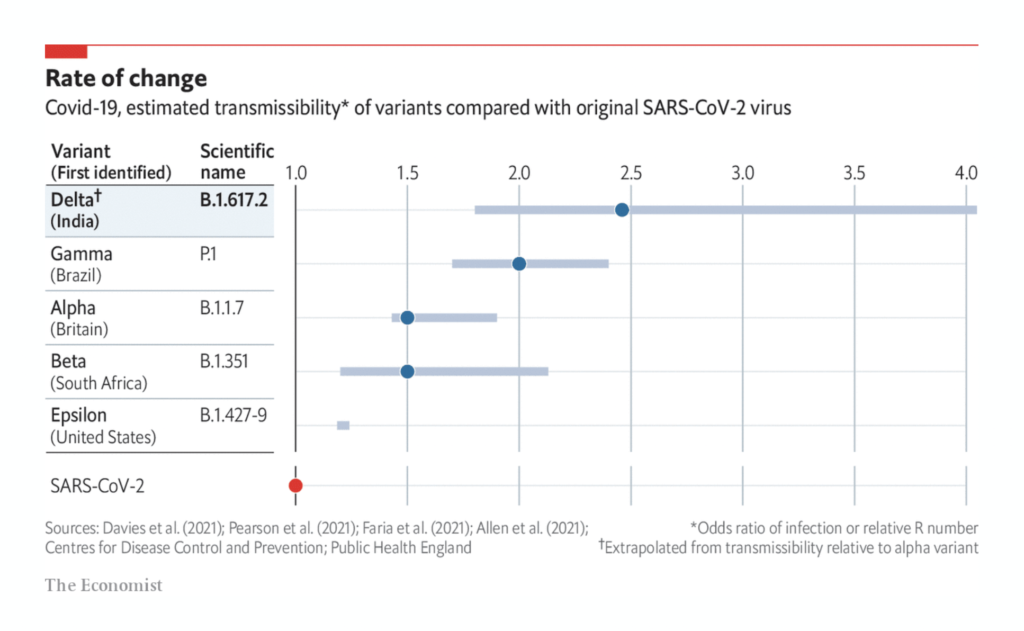
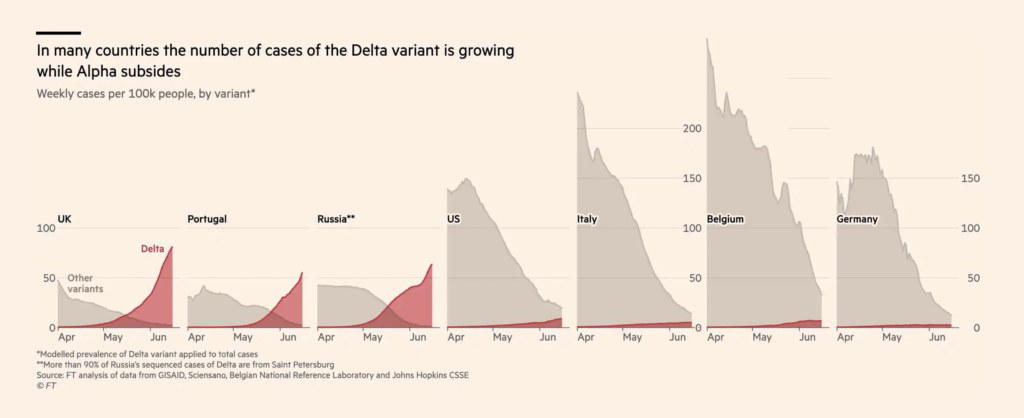
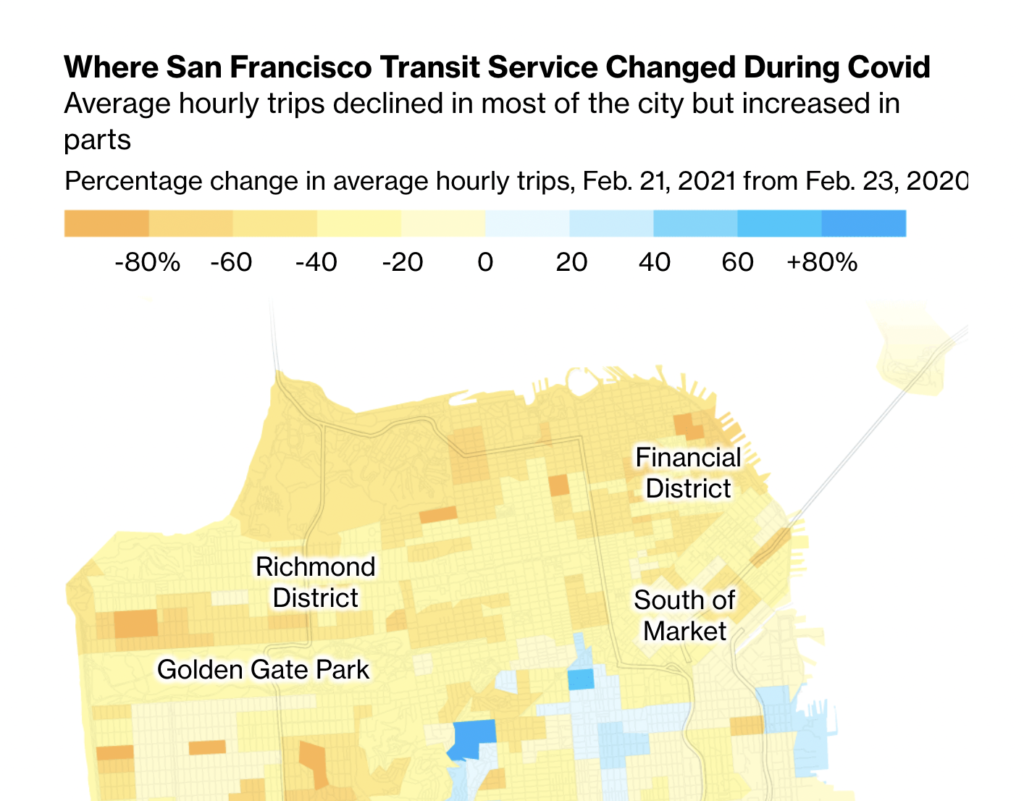
And lockdowns are ending all over the world even as new variants spread and pandemic-era service cuts continue:
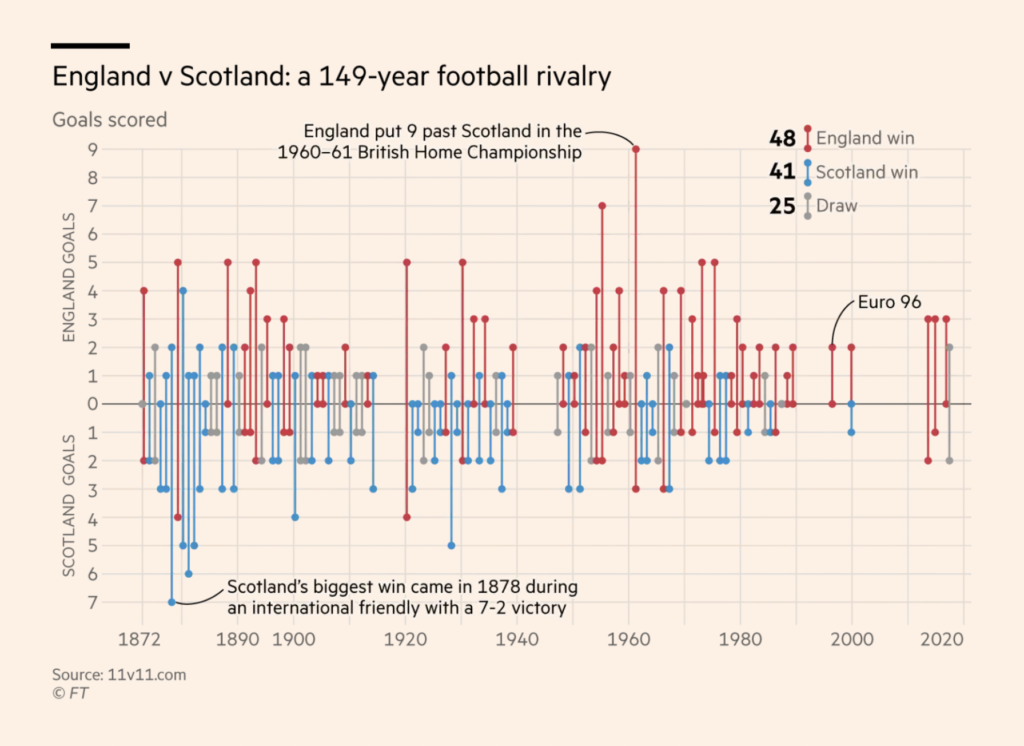
The Euro Cup is providing some lighter food for thought:

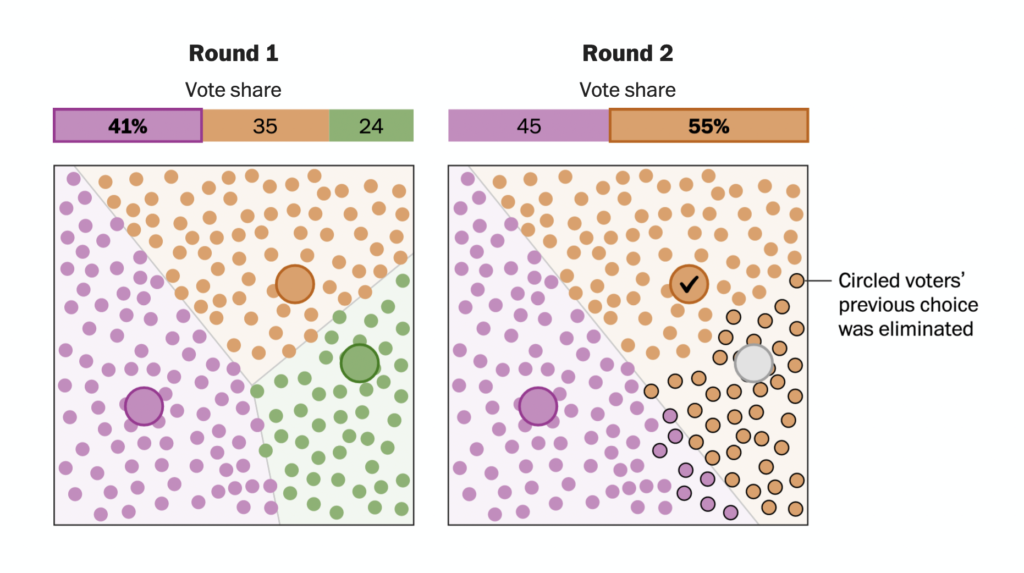
As New York City heads to the polls for its first elections using ranked-choice voting, these charts explain the process in theory and practice:

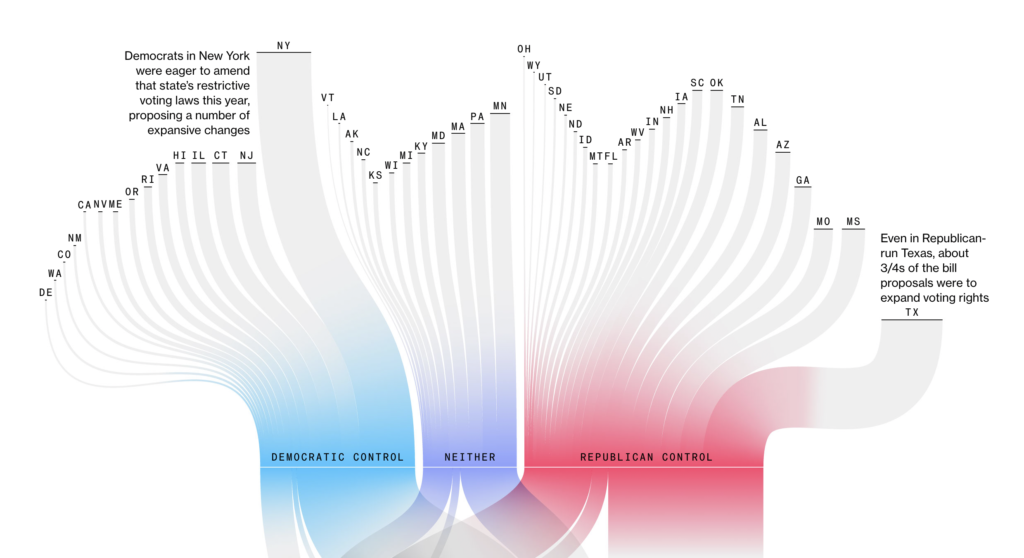
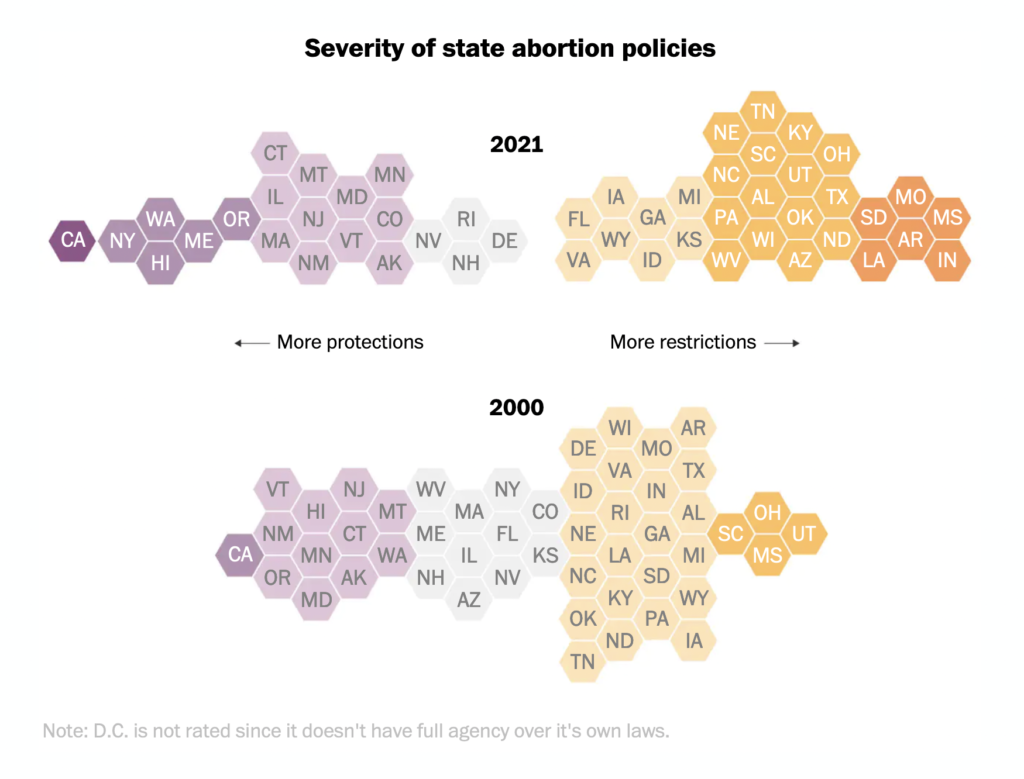
And plenty of other elections and political news were in the mix as well:
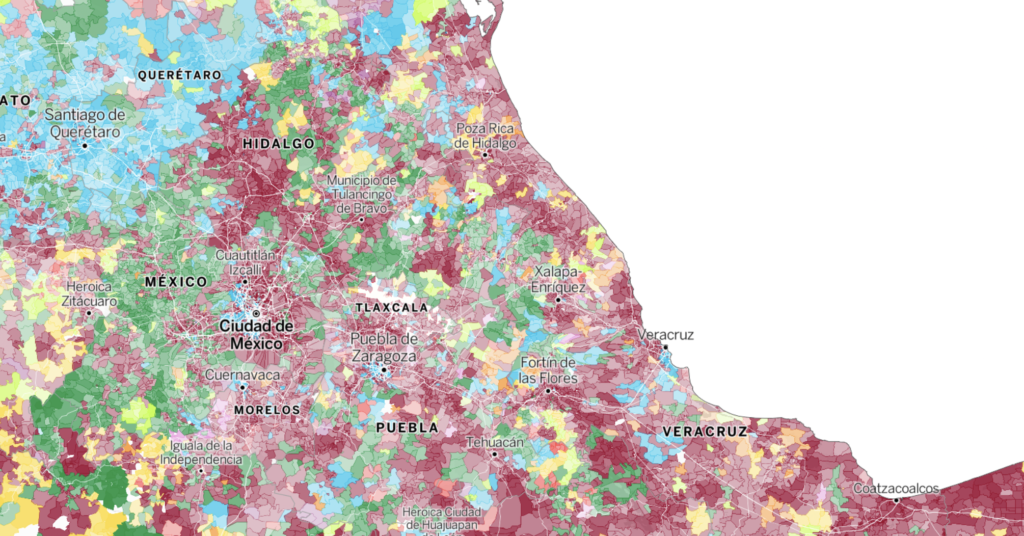
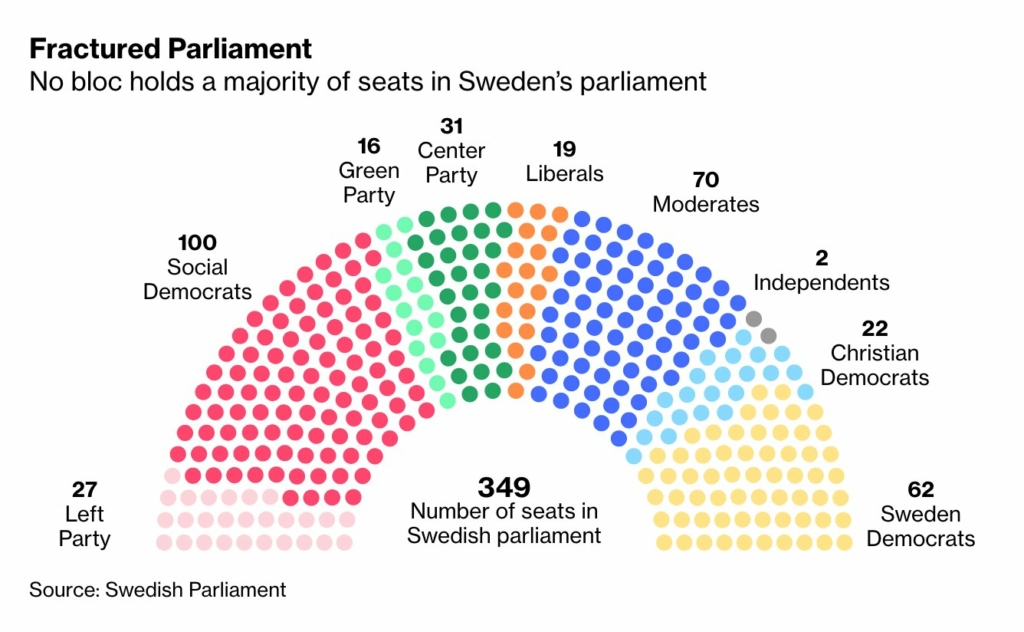
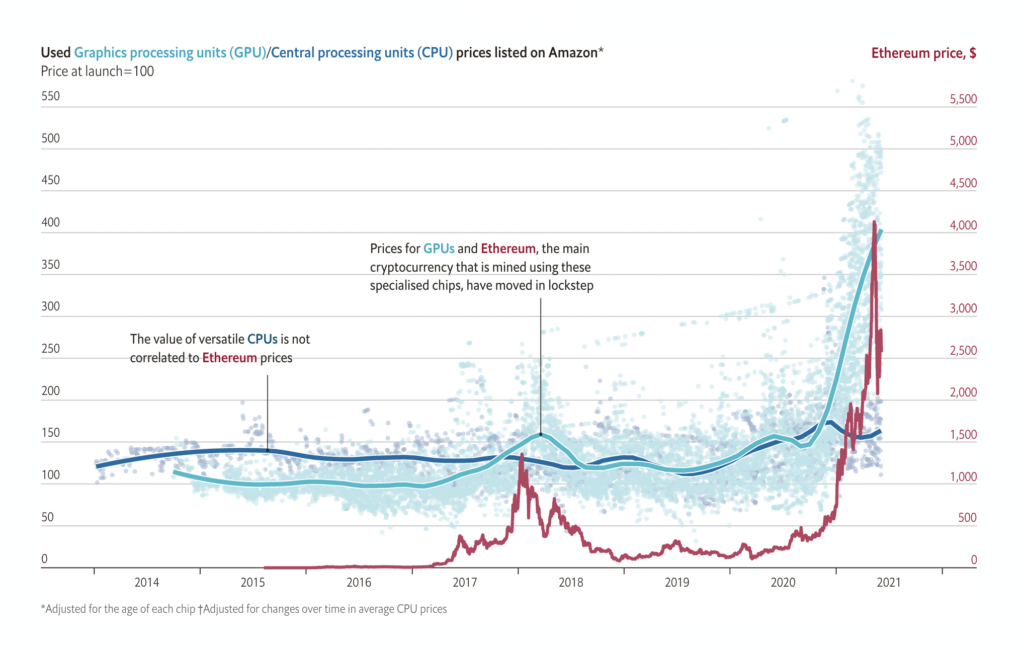
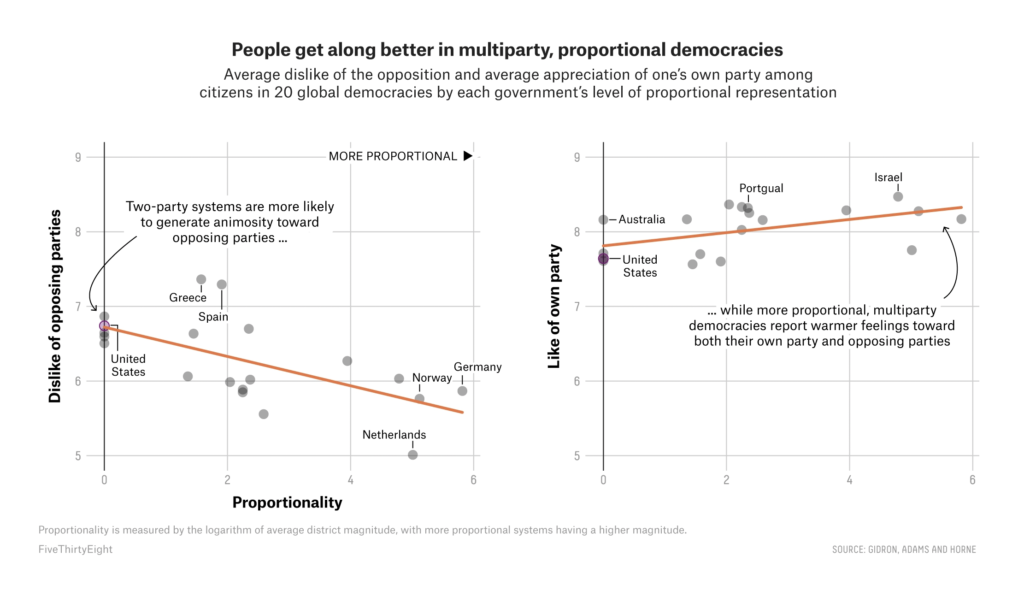
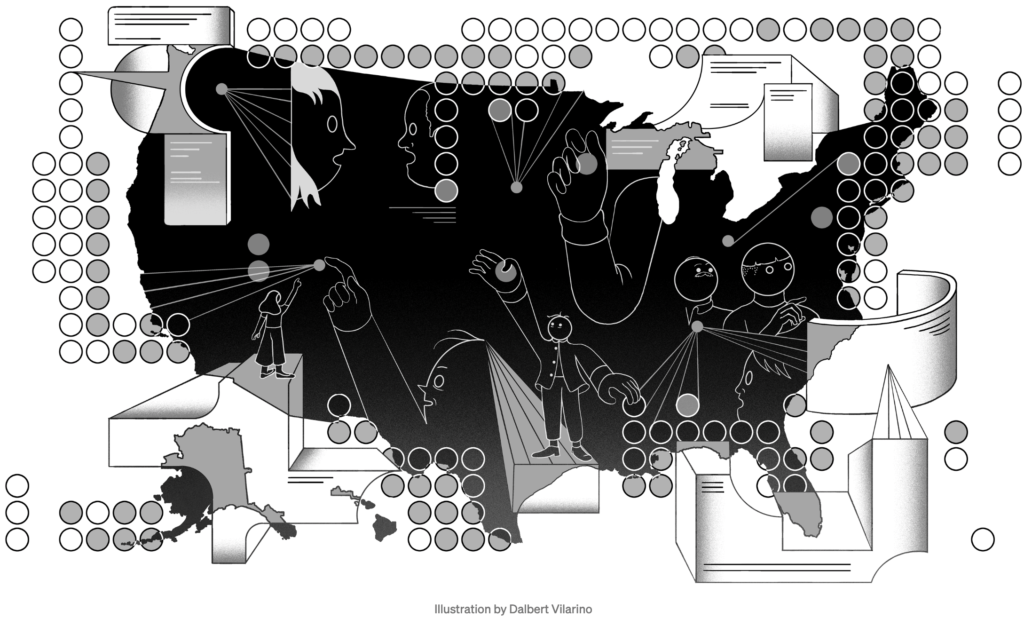
We saw big-picture trends in everything from motherhood to crypto-mining to multiparty democracy:

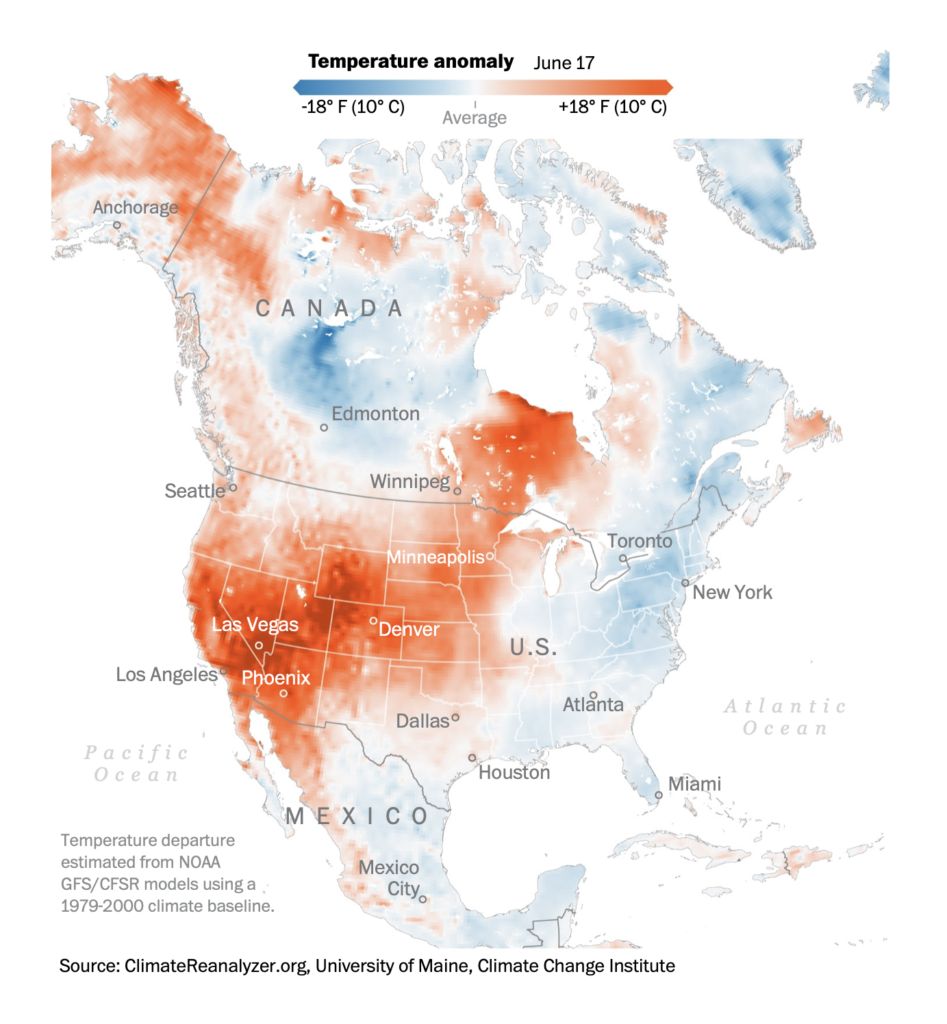
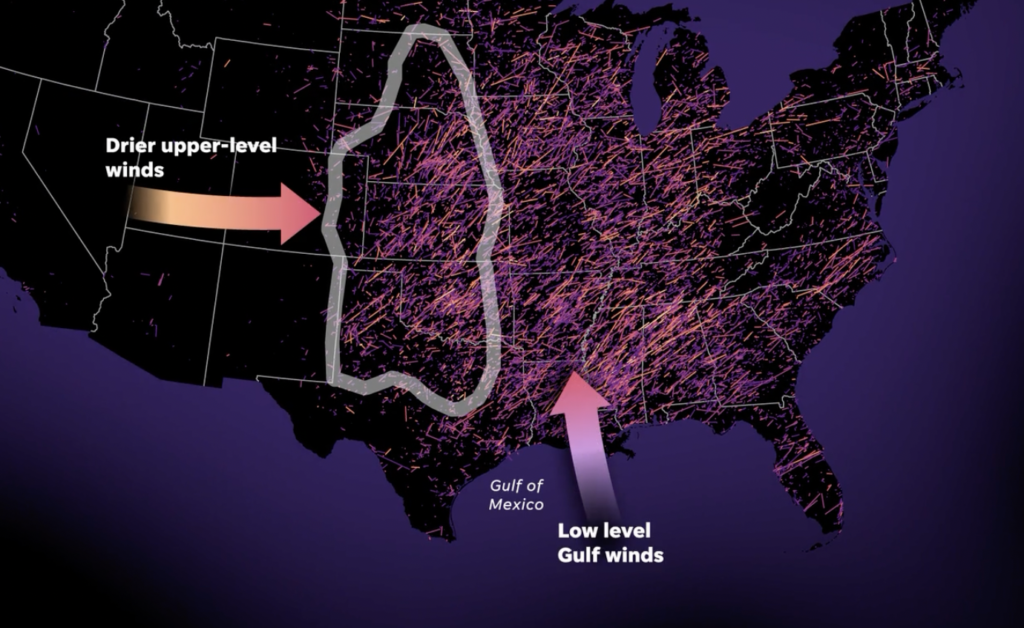
And finally, a heat wave in North America and tornados far from their usual territory:
What else we found interesting
If you want to get inspired by more data visualizations: In the past week, the winners of both the Malofiej Awards and the Sigma Awards were announced.
- Malofiej, organized by the Society for News Design Spain, awards the best infographics in newspapers and magazines around the globe. Learn about the winners on Twitter.
- The Sigma Awards were created by some data journalists last year and award the best of worldwide data journalism. Learn about the winners on Twitter or their website.
Help us make this dispatch better! We’d love to hear which newsletters, blogs, or social media accounts we need to follow to learn about interesting projects, especially from less-covered parts of the world (Asia, South America, Africa). Write us at hello@datawrapper.de or leave a comment below.


Comments