We want to enable everyone to create beautiful charts, maps, and tables. New to data visualization? Or do you have specific questions about us? You'll find all the answers here.
The best of last week’s big and small data visualizations
Lisa Charlotte Muth
Welcome back to the 148th edition of the Data Vis Dispatch! Every week, we publish a collection of the best small and large data visualizations we find, especially from news organizations — to celebrate data journalism, data visualization, simple charts, elaborate maps, and their creators.
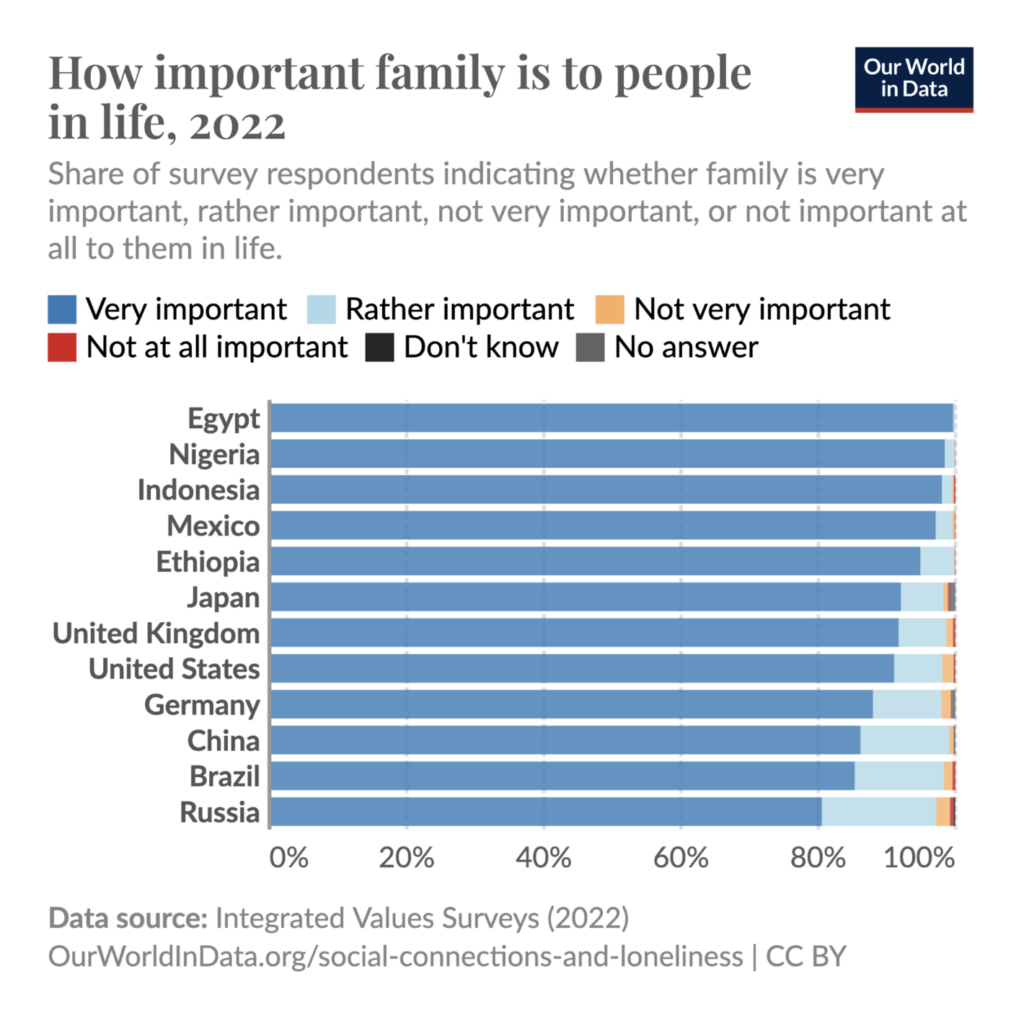
Recurring topics this week include family, football, and U.K. elections.
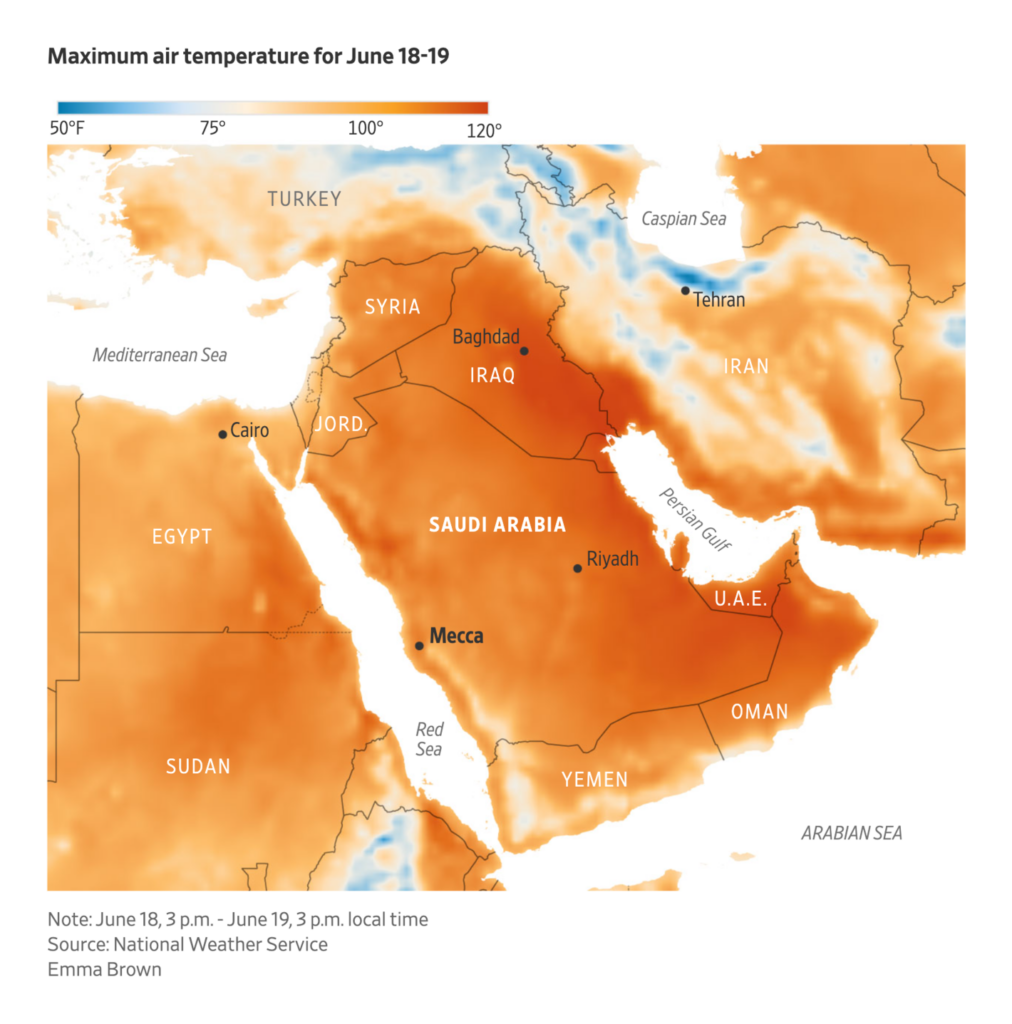
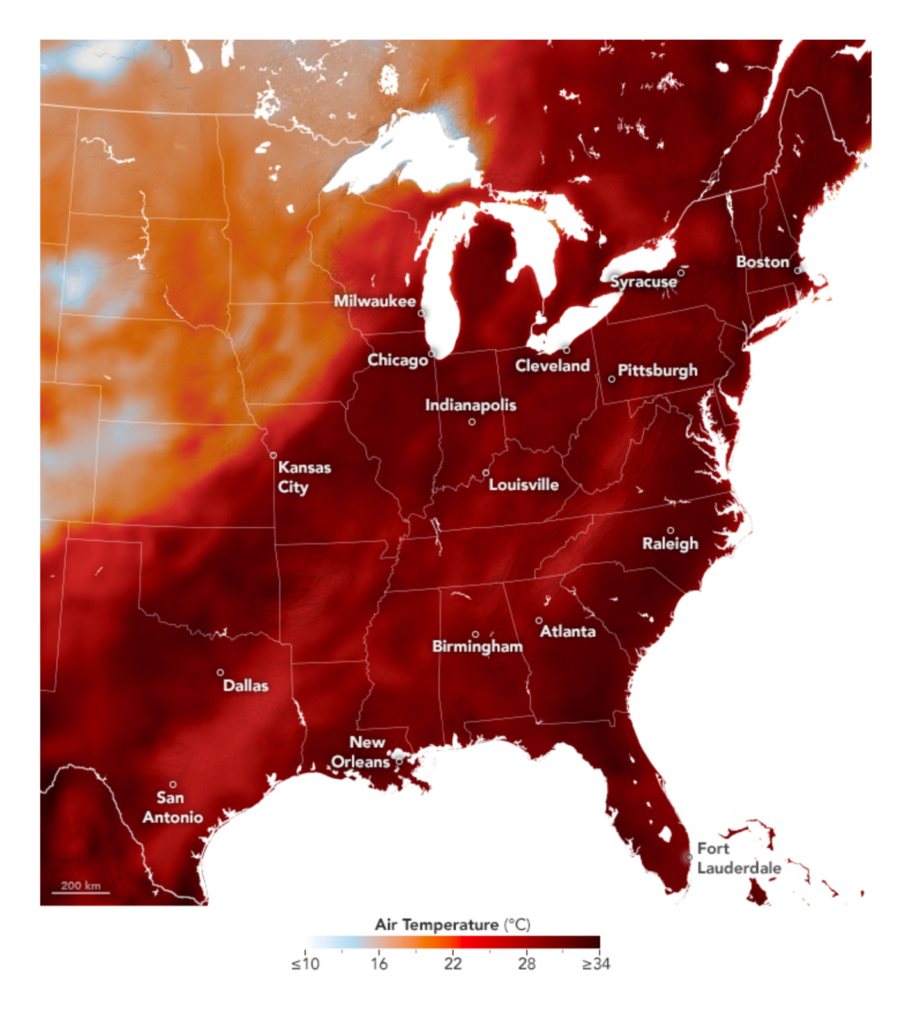
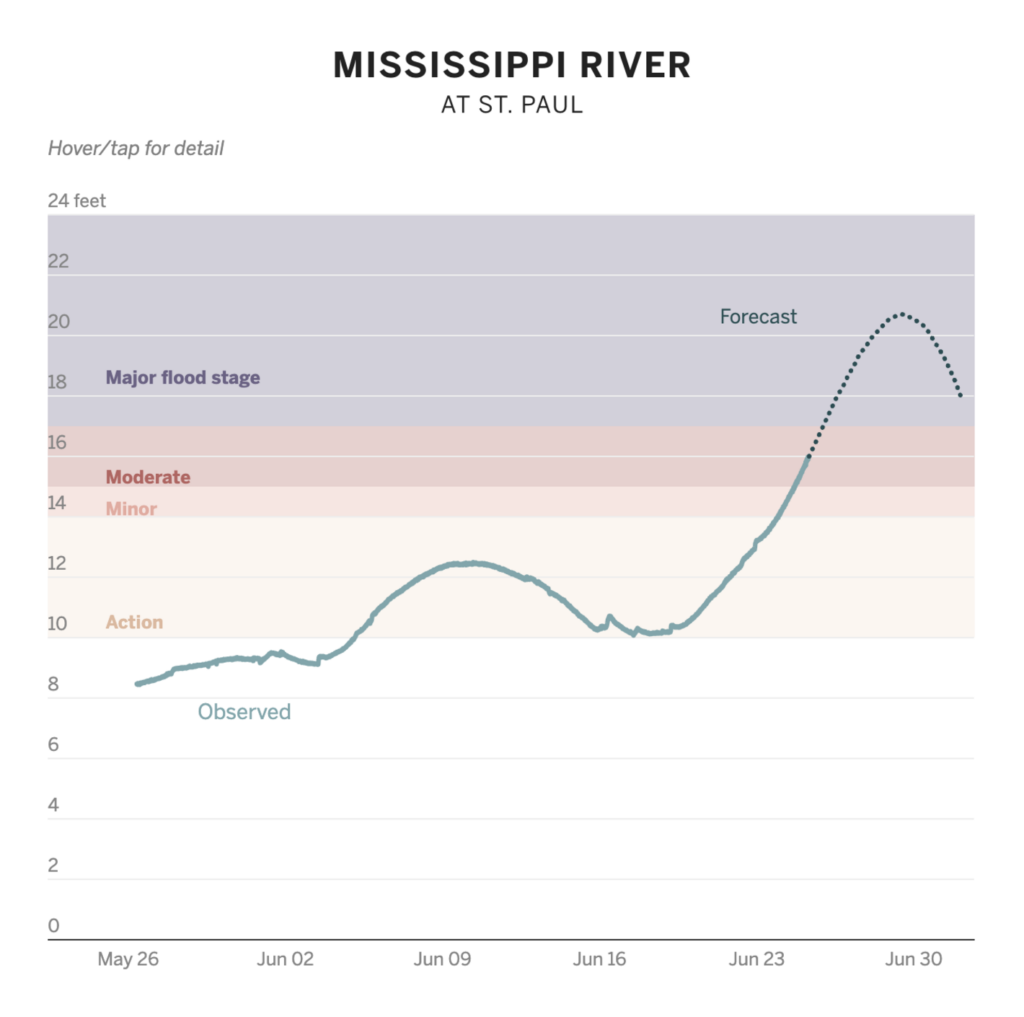
First, climate and the weather. This week saw its fair share of orange-to-red maps visualizing extreme and deadly temperatures:
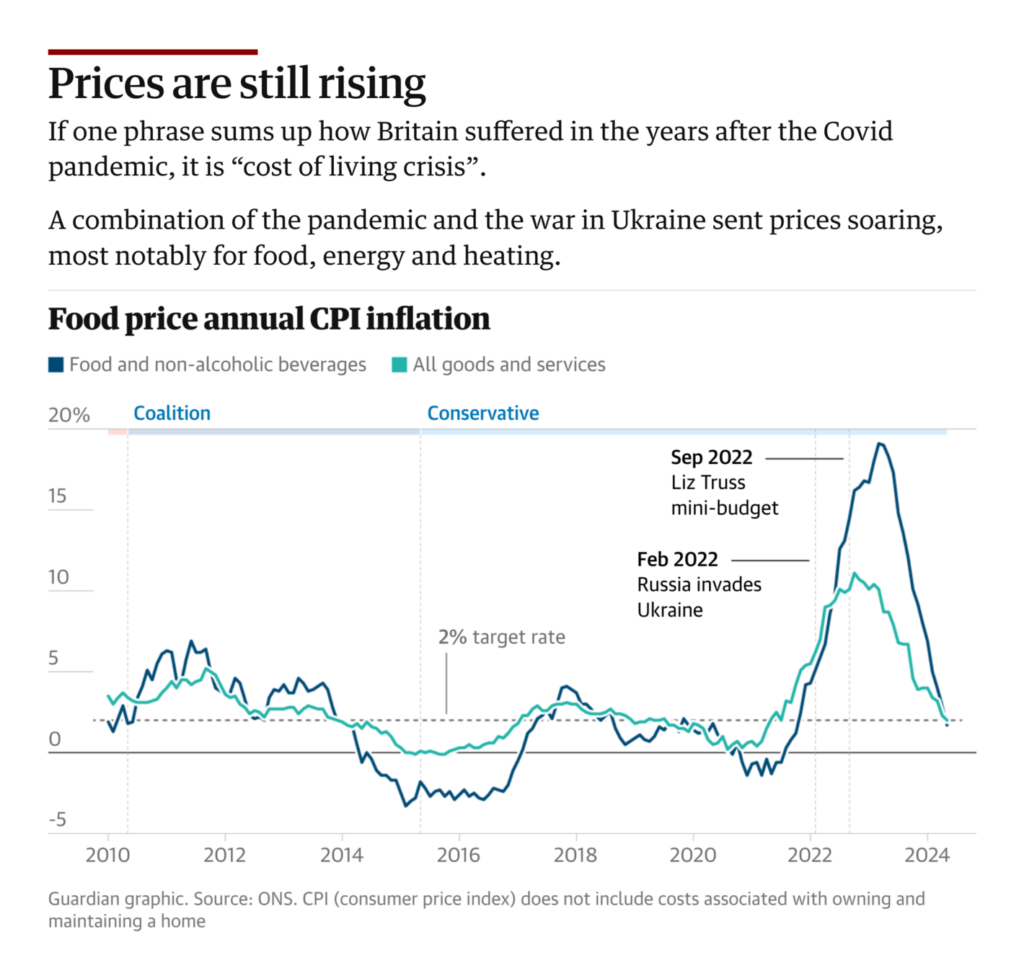
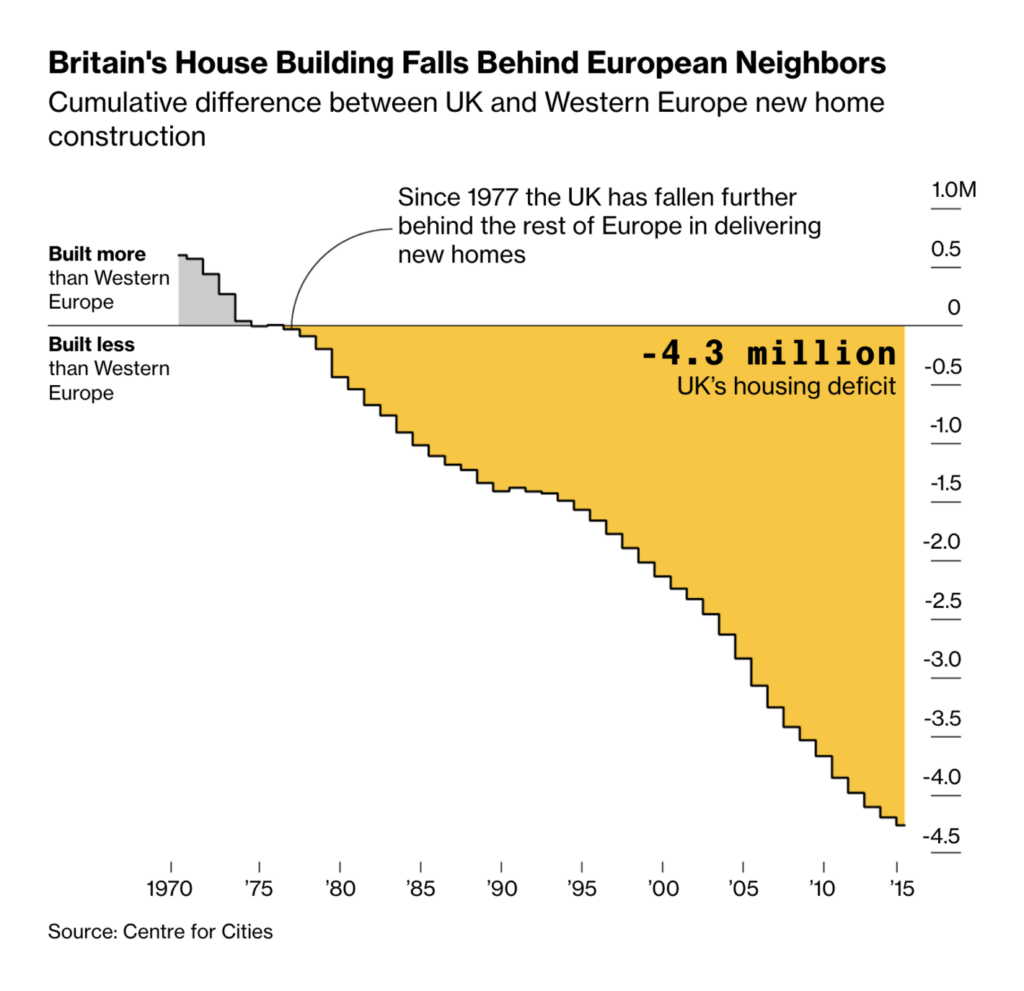
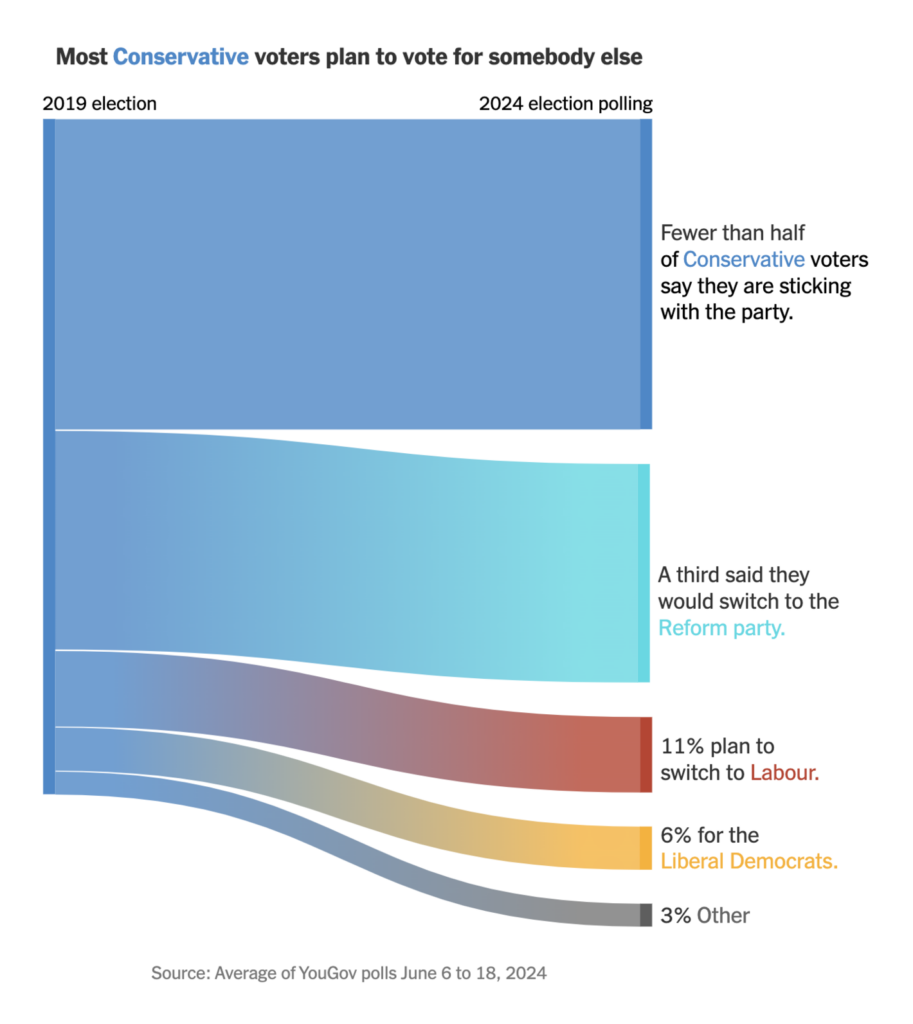
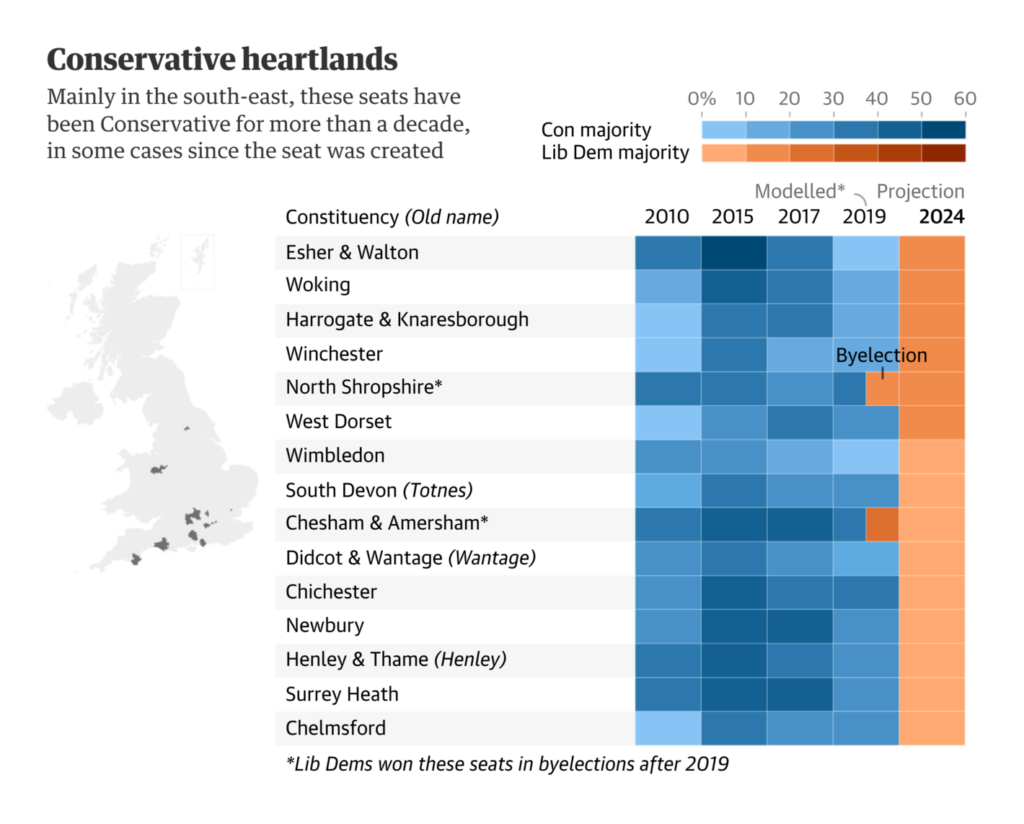
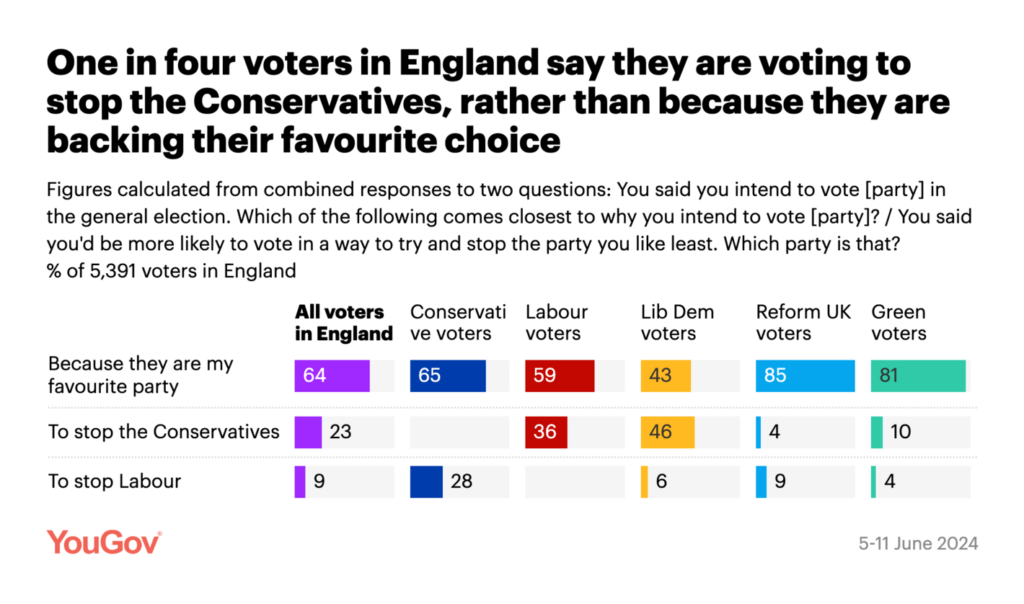
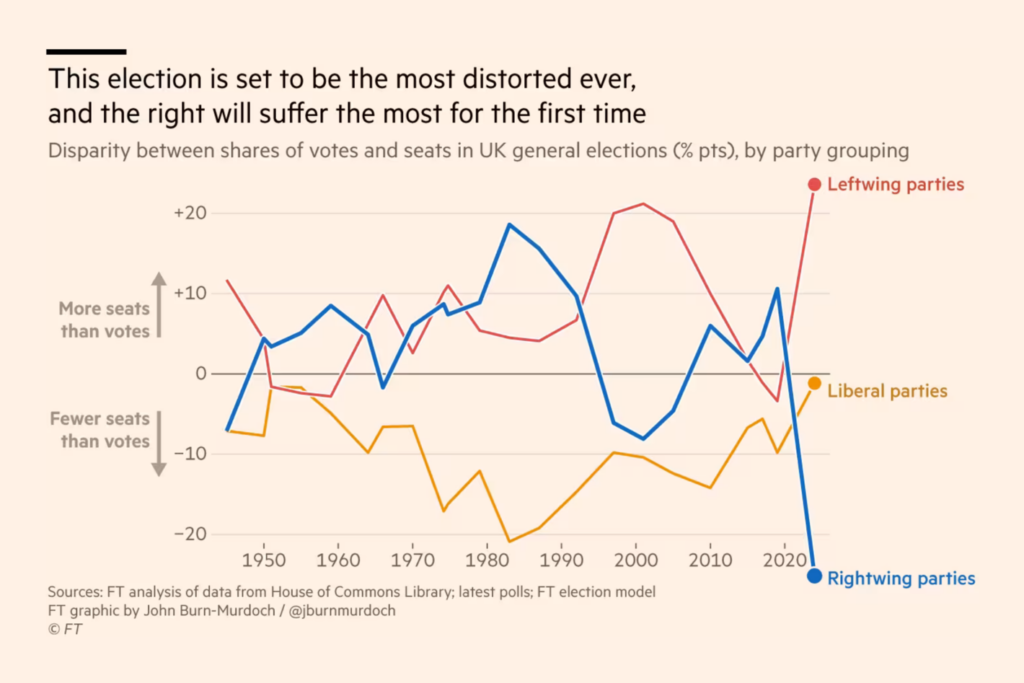
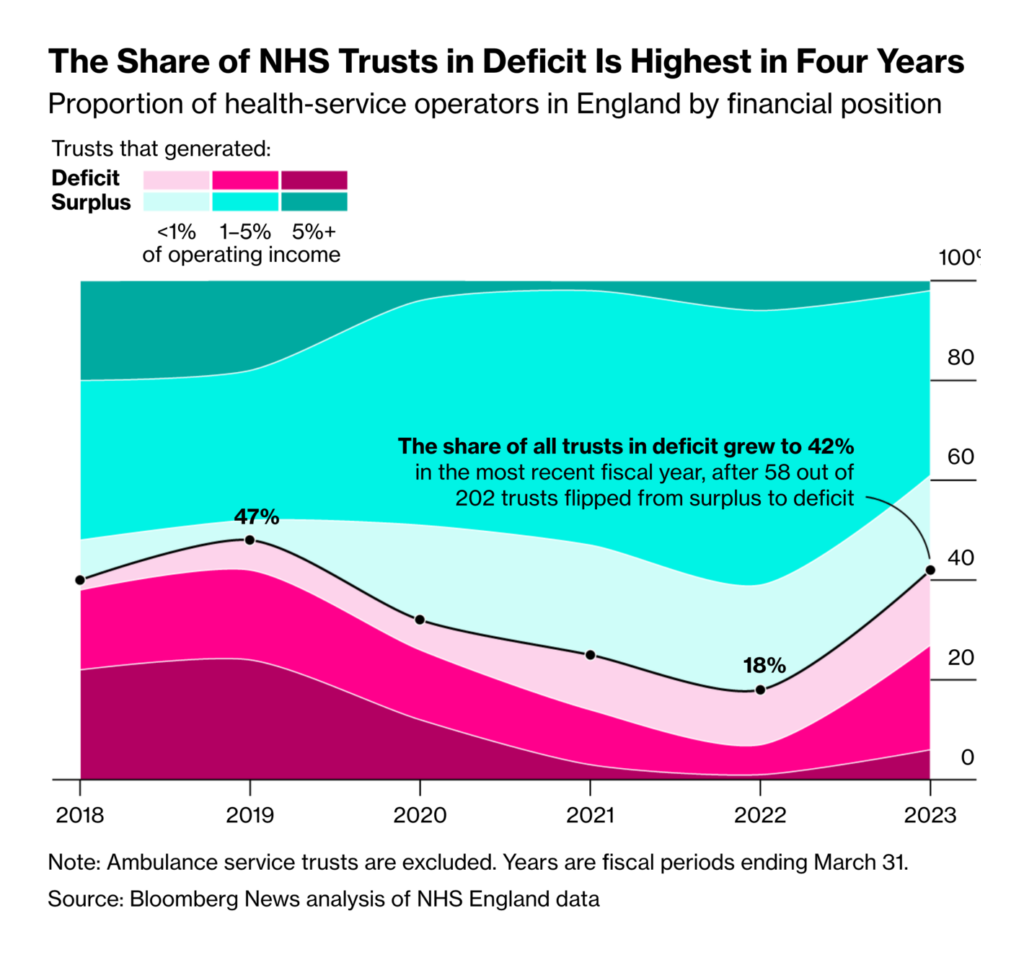
As you’re probably aware, the entire year of 2024 is election season. Next up is a general election in the U.K. on July 4. The media is busy charting out all the problems that the next government will hopefully fix:
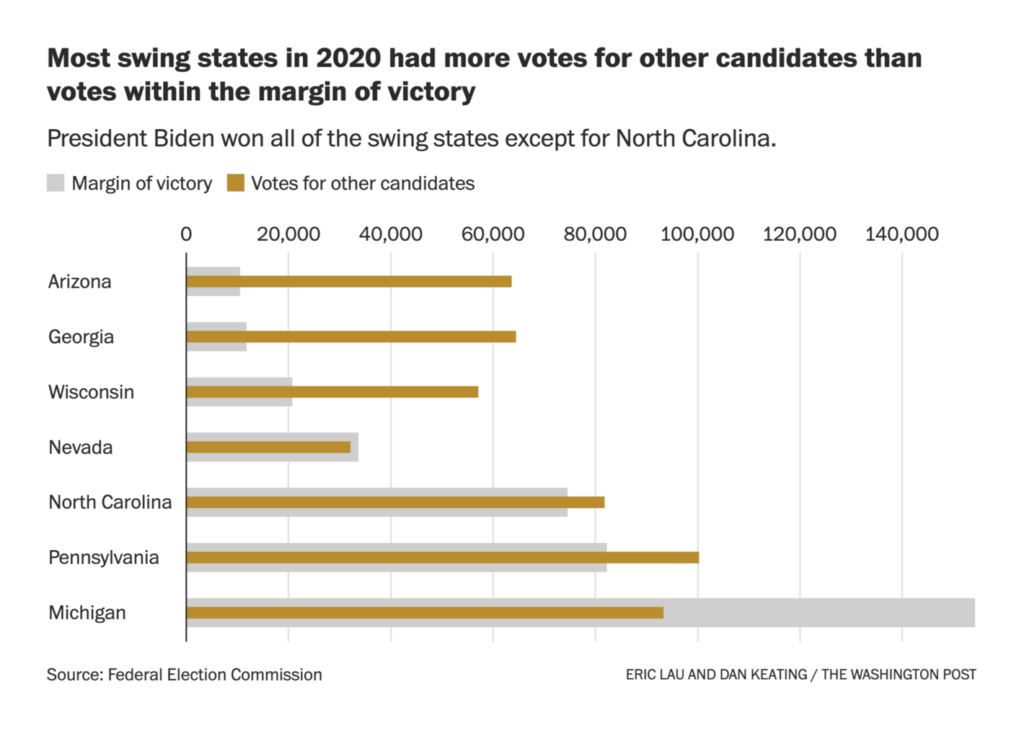
When it comes to the U.S. elections in November, people are not really happy with their options, either. The Washington Post calls it the “double hater” camp:
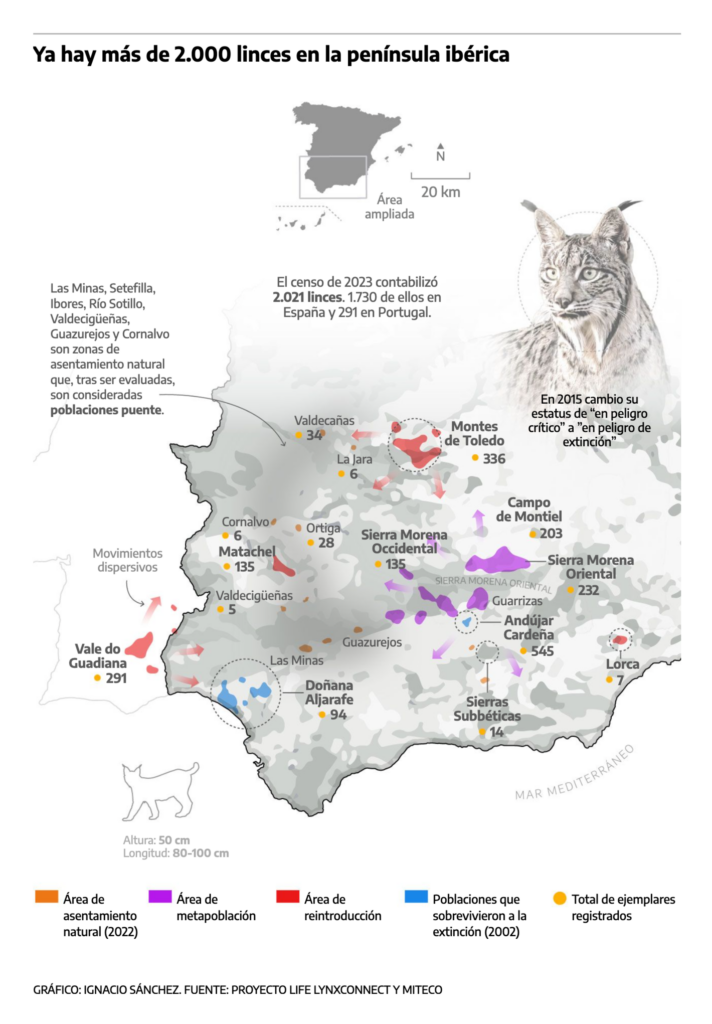
In news from the animal kingdom, there are more lynx in Spain (that’s a good thing) and more mosquitoes in parts of the world where there weren’t any before (that’s a bad thing):
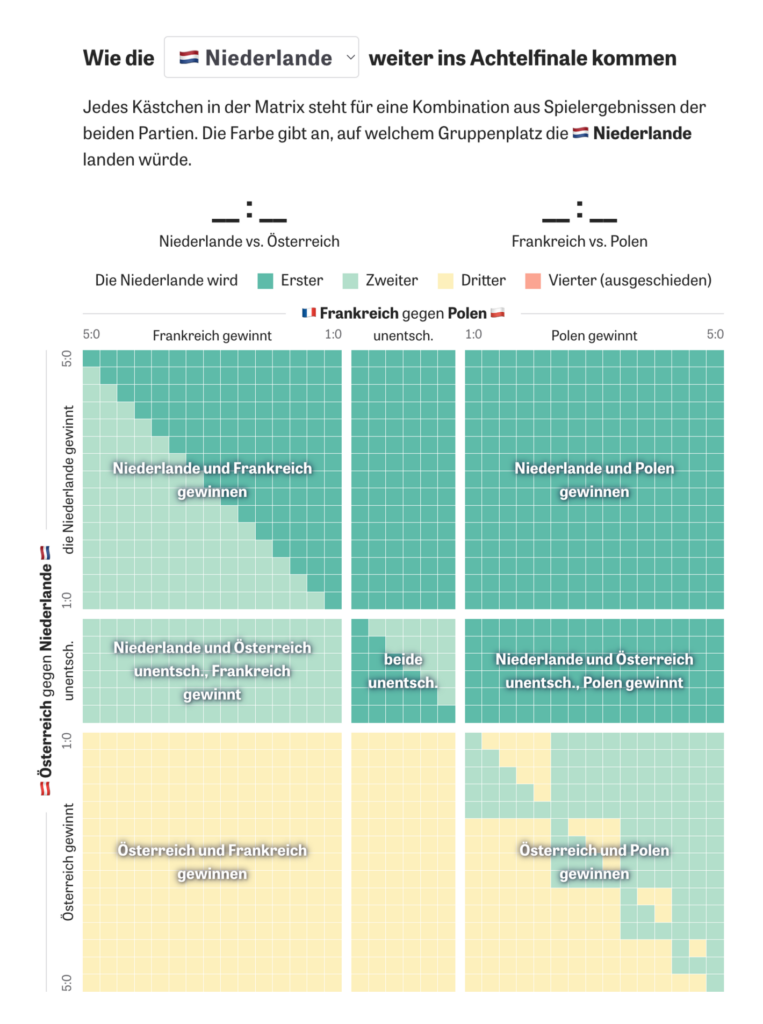
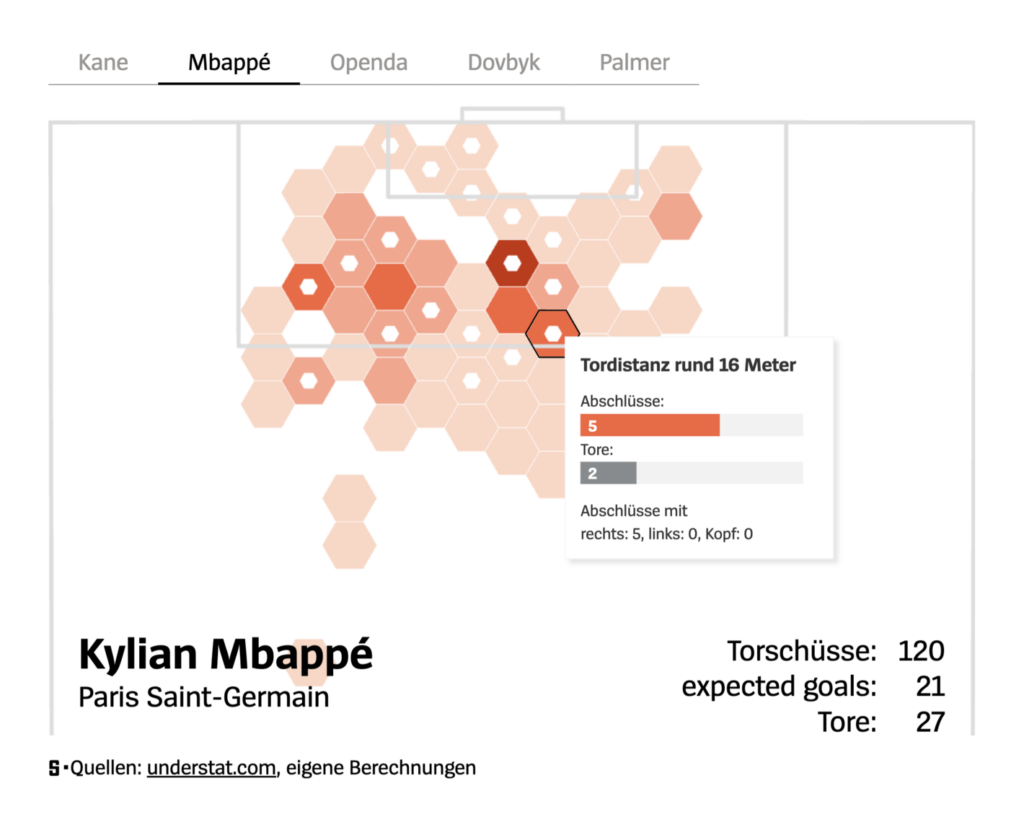
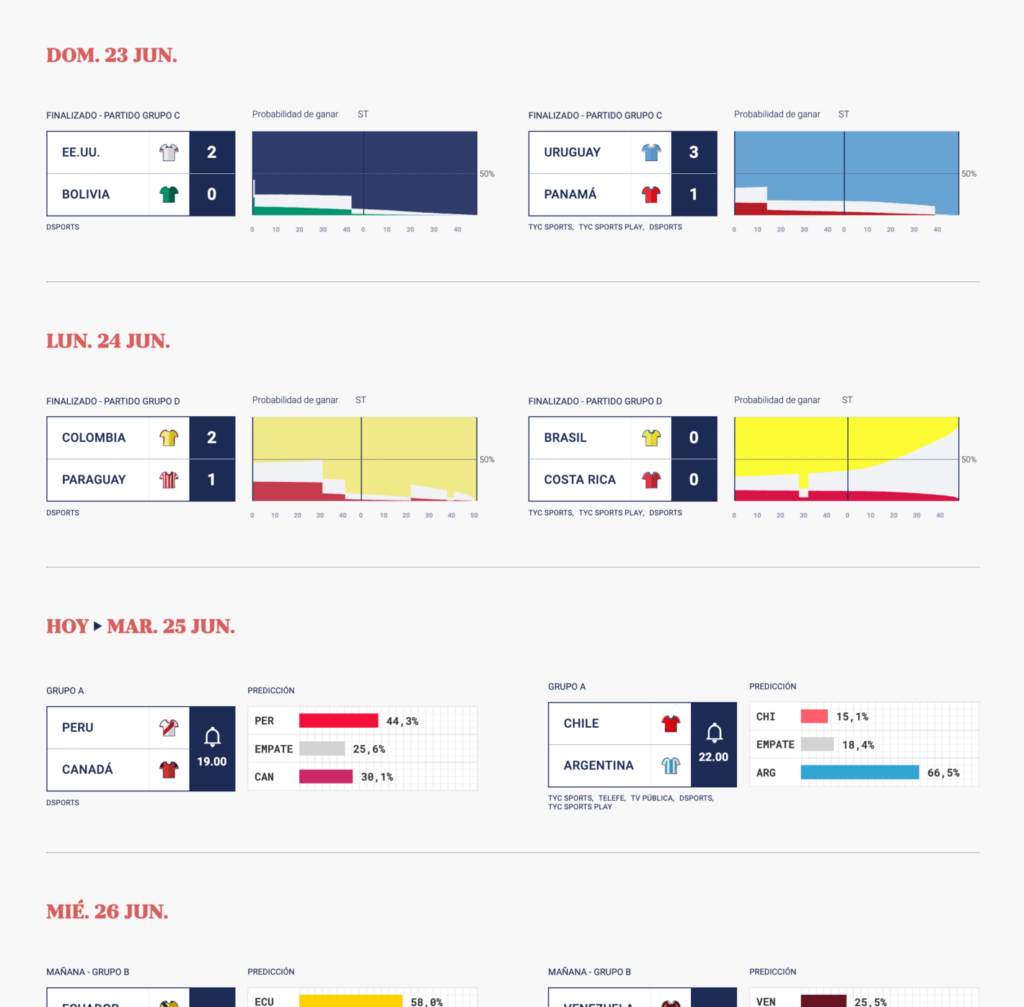
Let’s switch over to some entertainment. Two men’s soccer championship are happening these days, the UEFA Euro 2024 in Germany and the Copa América in the United States:
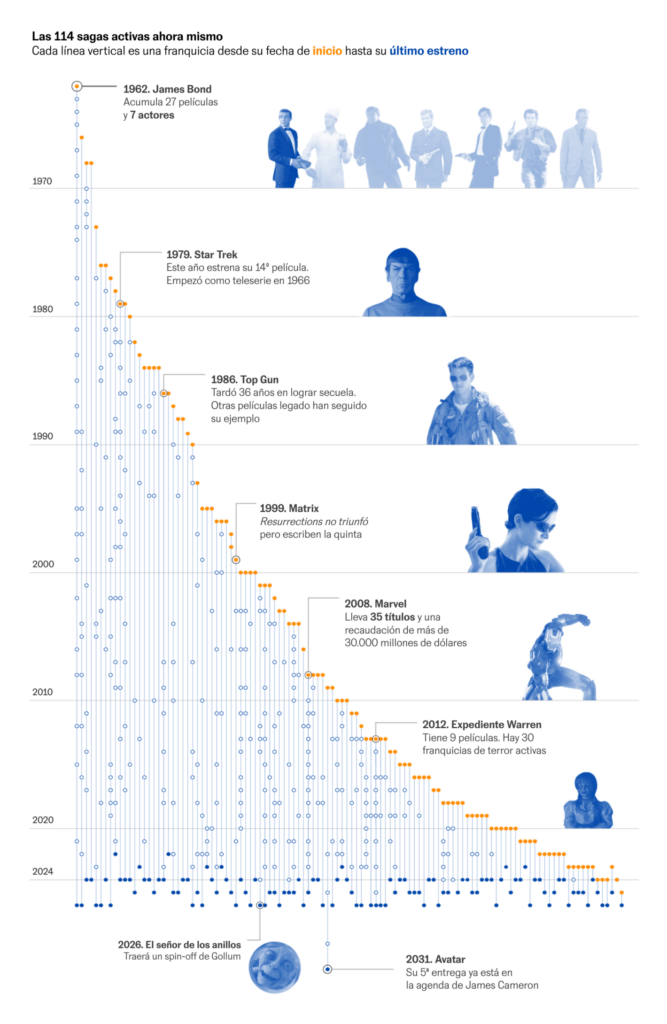
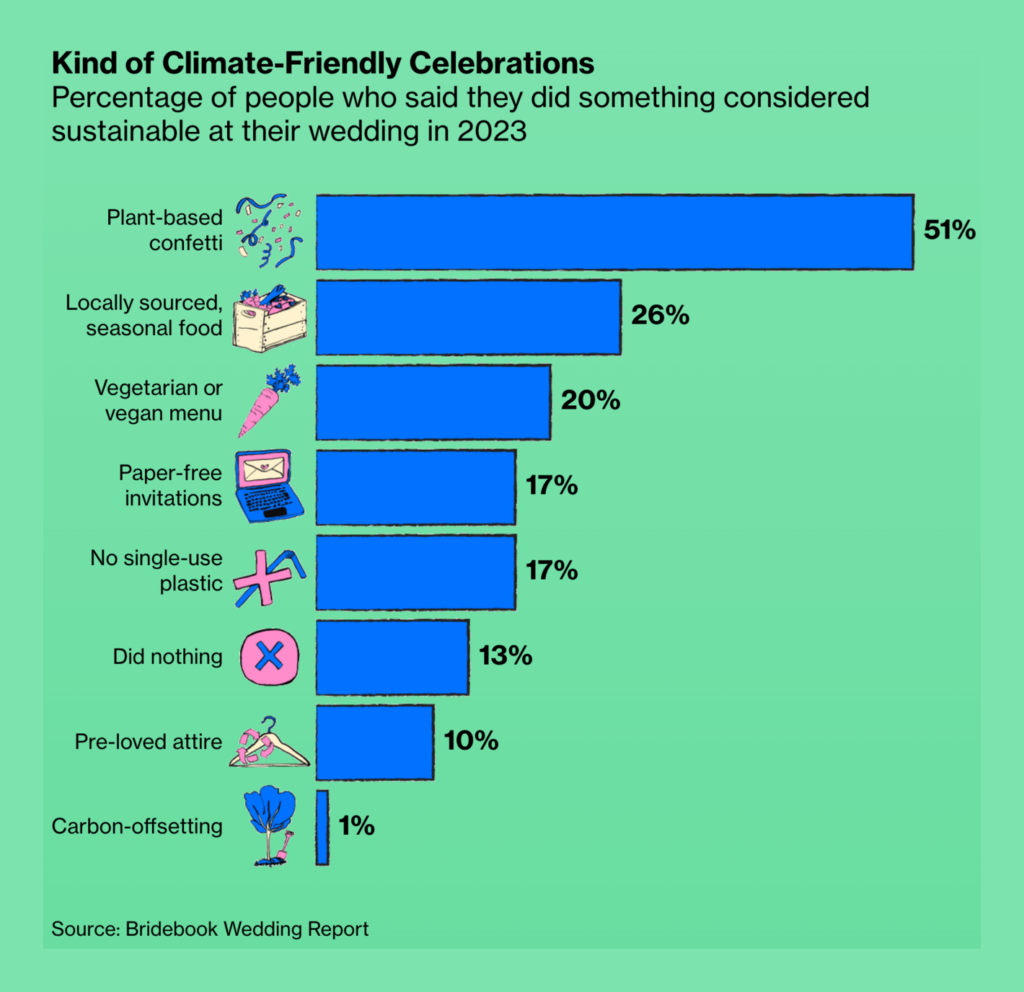
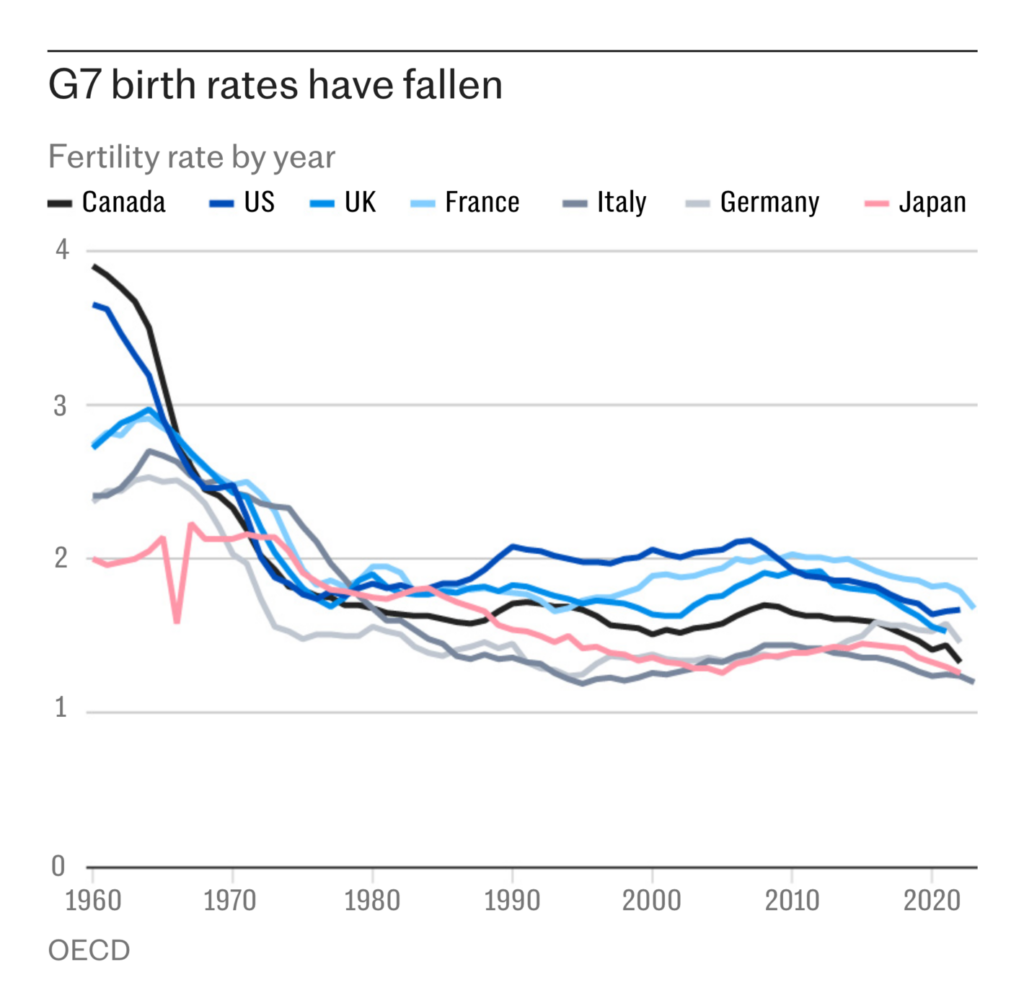
Bored of watching movies, too? Maybe try getting married and starting a family — you, too, could make an impact on the next charts showing birth rates.
Help us make this dispatch better! We’d love to hear which newsletters, blogs, or social media accounts we need to follow to learn about interesting projects, especially from less-covered parts of the world (Asia, South America, Africa). Write us at hello@datawrapper.de or leave a comment below.
(she/her, @lisacmuth, @lisacmuth@vis.social) is Datawrapper’s head of communications. She writes about best practices in data visualization and thinks of new ways to excite you about charts and maps. Lisa lives in Berlin.


Comments