This article is brought to you by Datawrapper, a data visualization tool for creating charts, maps, and tables. Learn more.
Data Vis Dispatch, June 6
The best of last week’s big and small data visualizations

Welcome back to the 96th edition of Data Vis Dispatch! Every week, we’ll be publishing a collection of the best small and large data visualizations we find, especially from news organizations — to celebrate data journalism, data visualization, simple charts, elaborate maps, and their creators.
Recurring topics this week include deforestation, labor shortages, and the war in Ukraine.
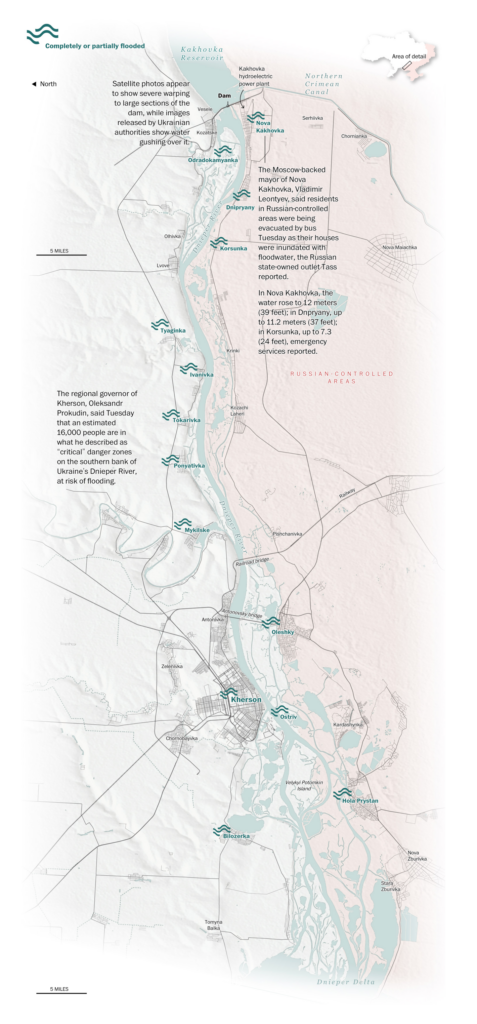
The explosion of Ukraine’s Kakhovka Dam has caused massive flooding in the Kherson region:
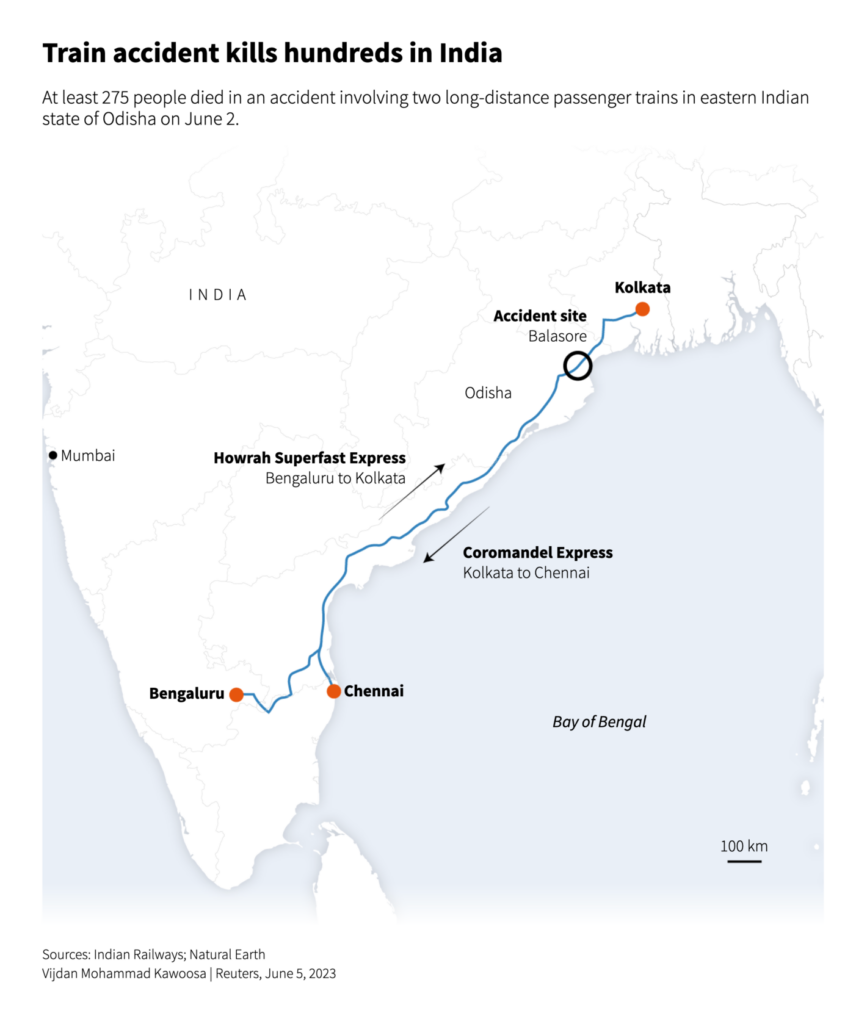
And hundreds of passengers were killed in a train collision in India:

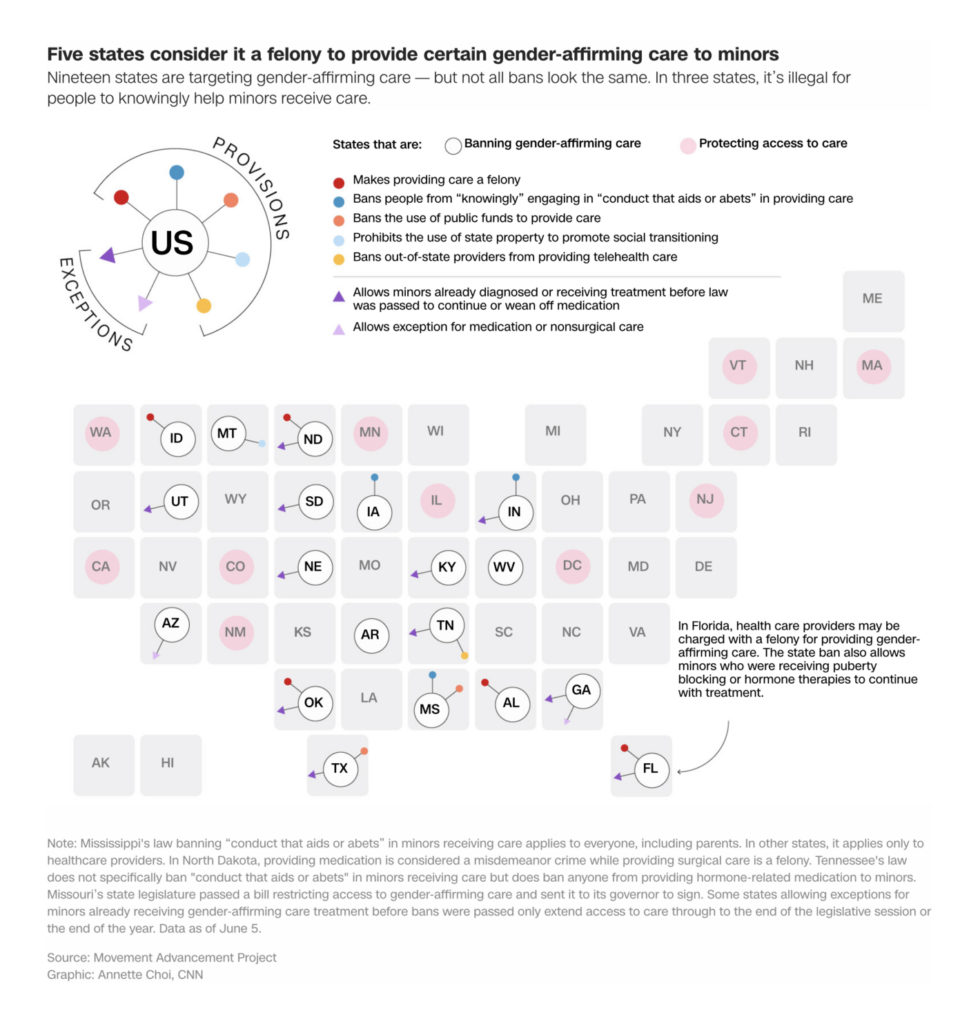
In just two years, 19 U.S. states have passed laws banning or restricting gender-affirming medical care:

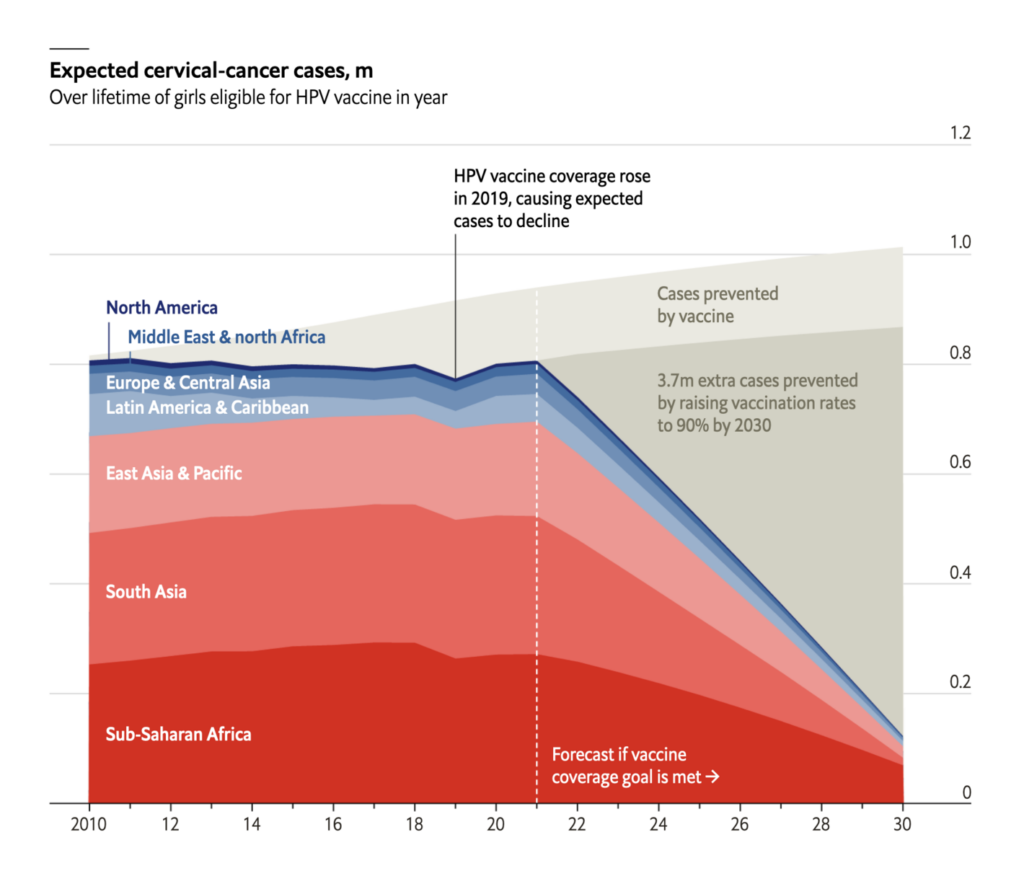
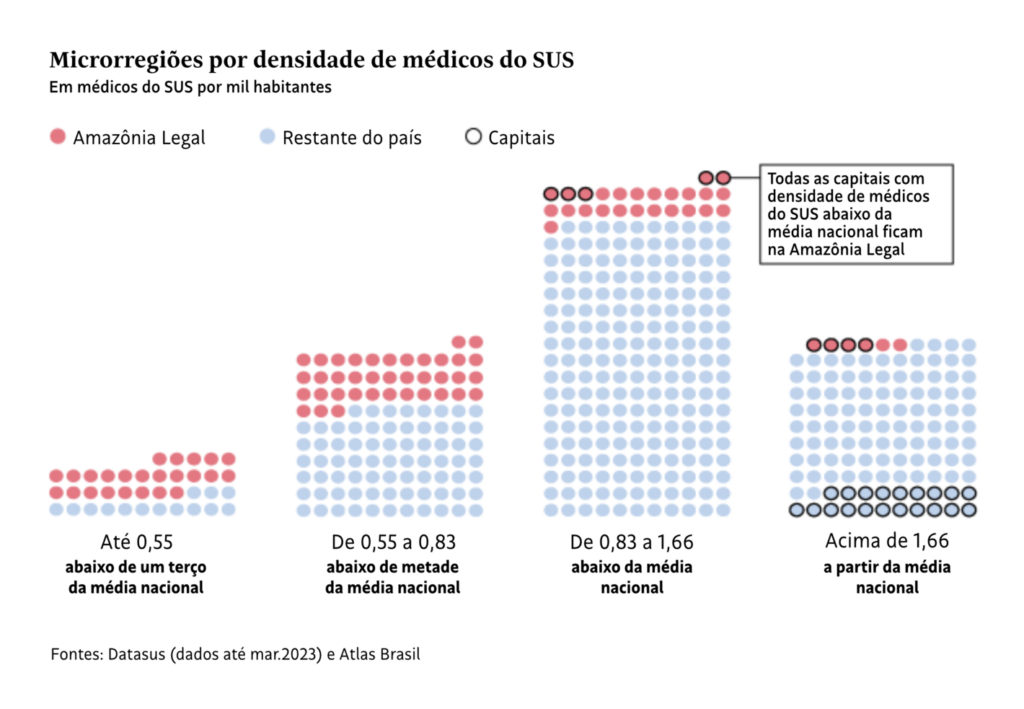
Other healthcare topics included post-COVID lung damage, the benefits of HPV vaccines, and a doctor shortage in rural Brazil:
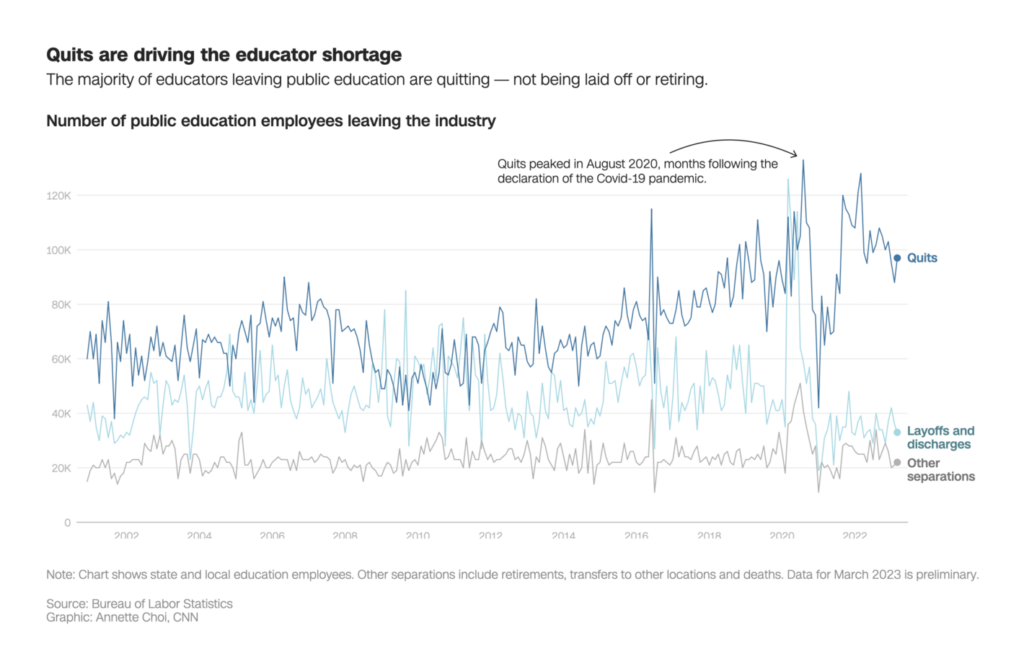
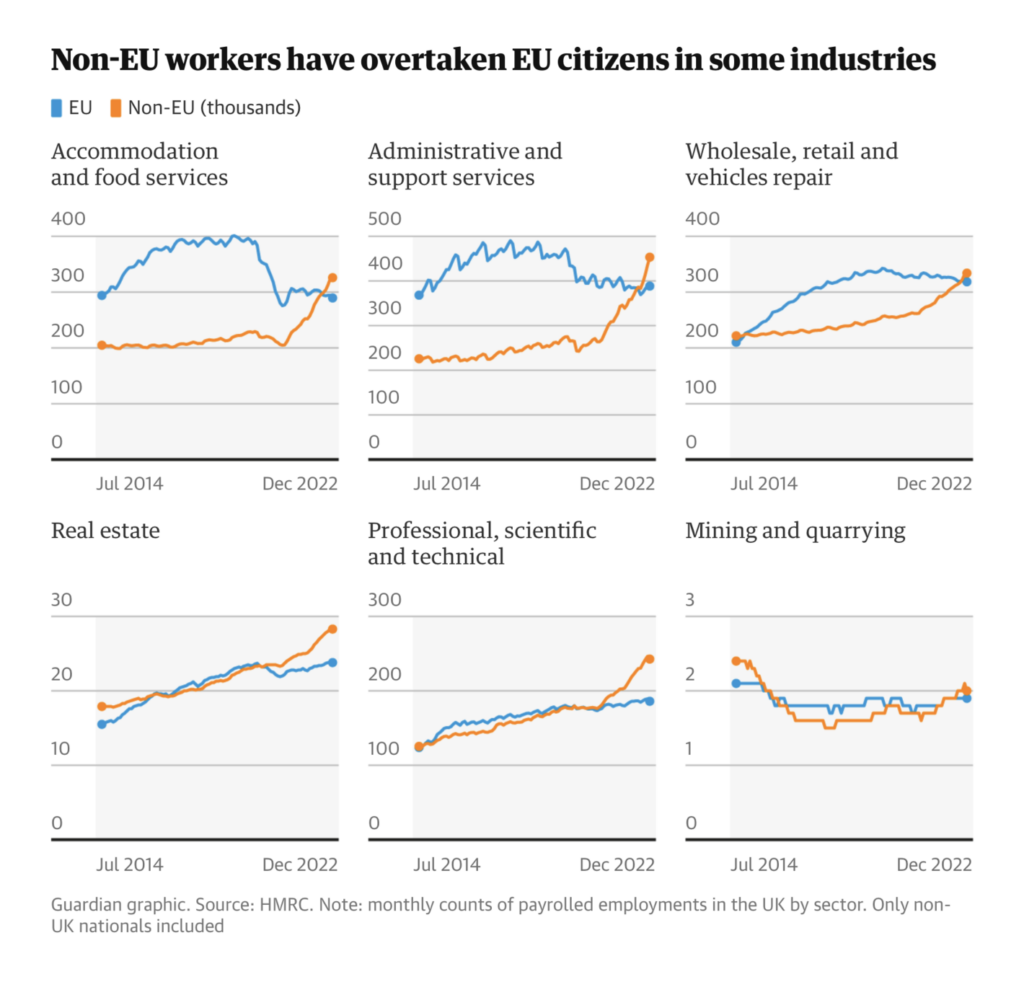
Meanwhile, the U.S. faces a shortage of teachers, and non-EU workers take up the slack in Britain:
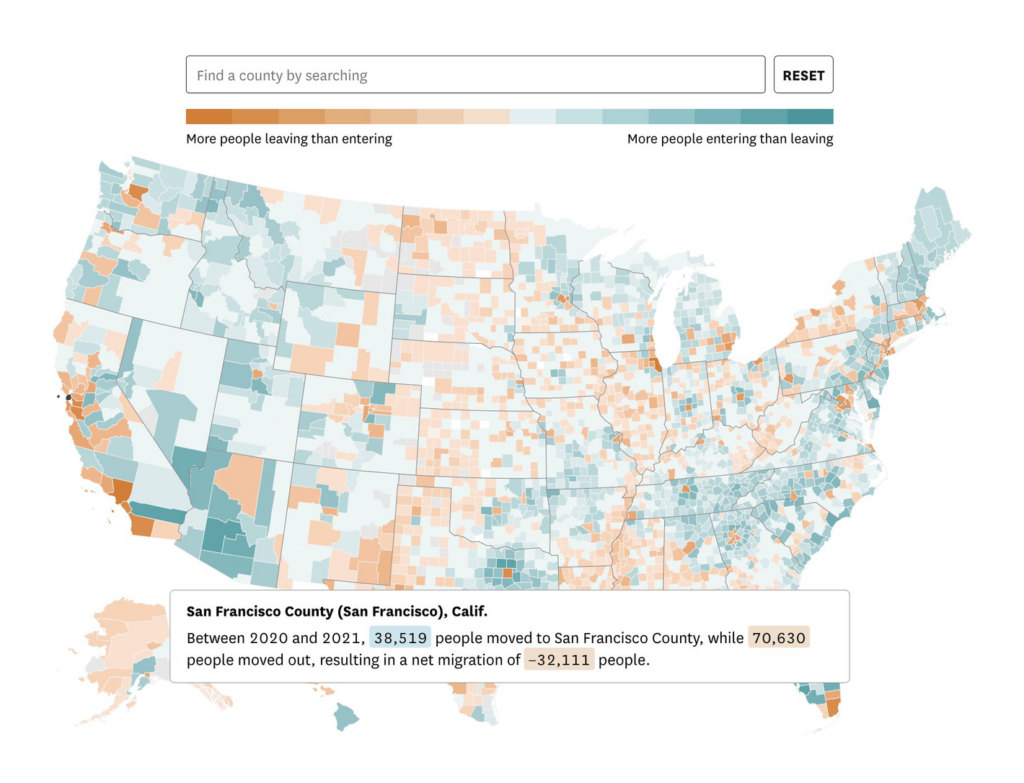
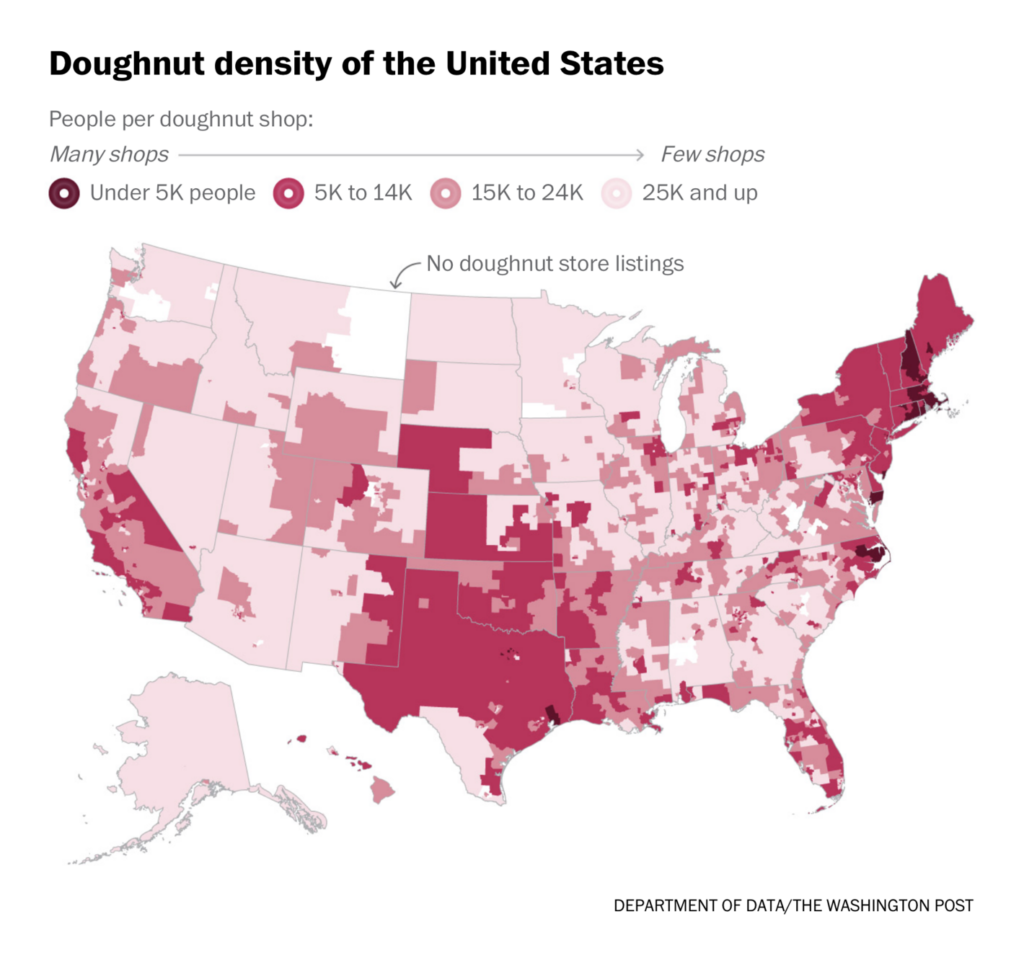
We saw charts on above-board trade in doughnuts, real estate, and semiconductors:

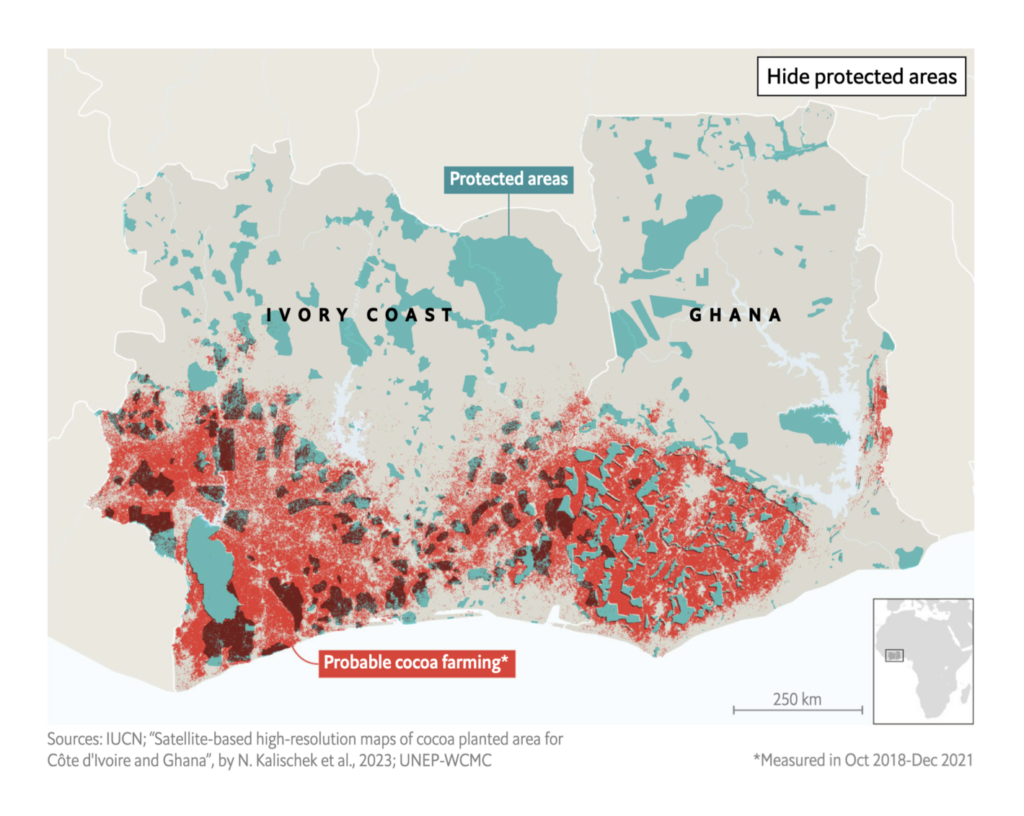
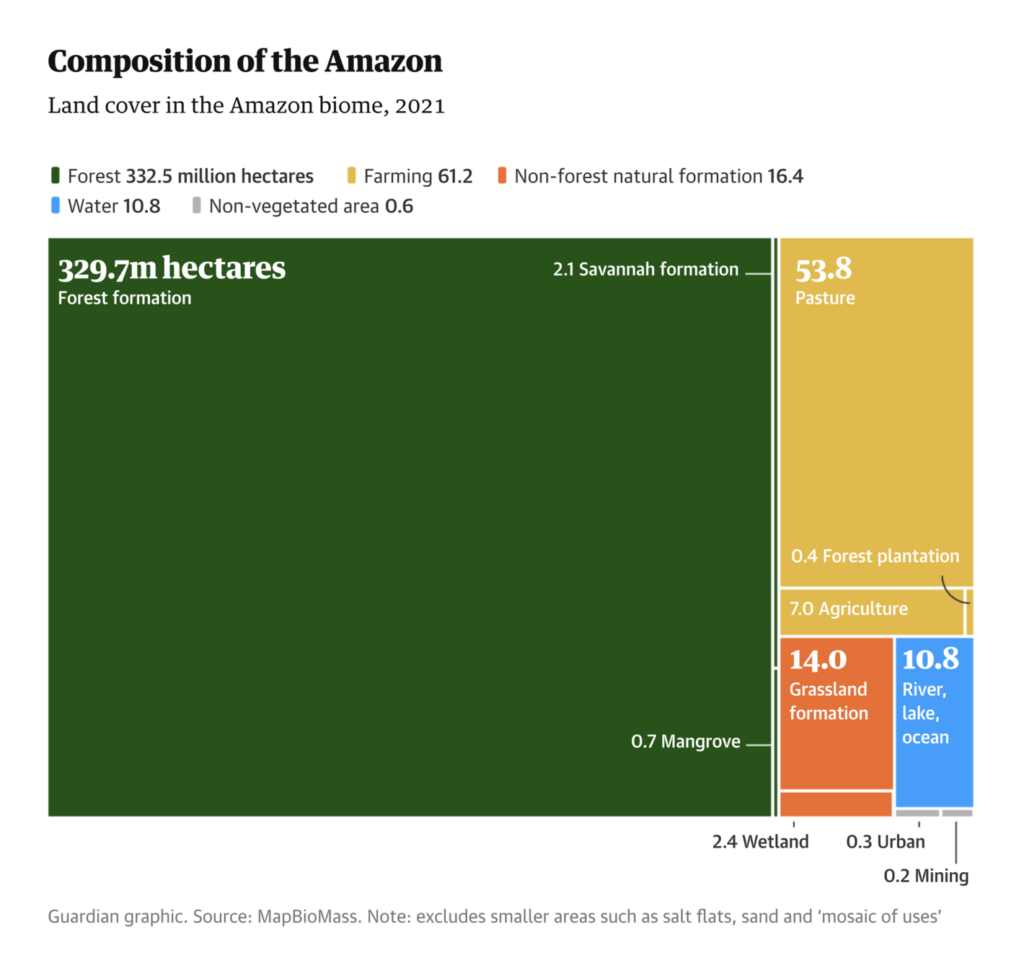
As well as illicit economies of Russian oil, West African cocoa, and Amazonian beef:
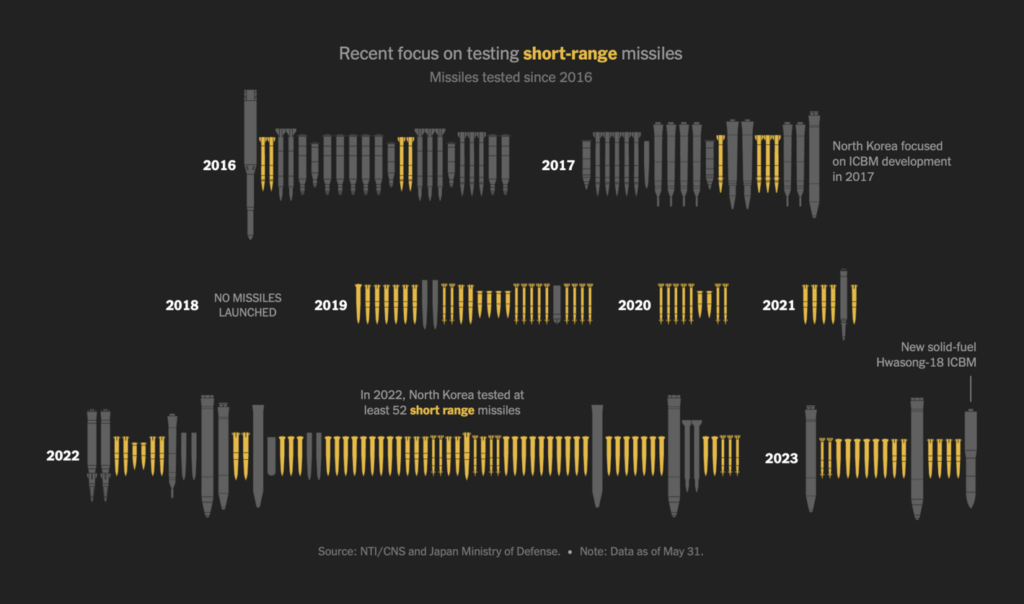
Other charts covered topics from sonic booms to missile tests:
What else we found interesting


Applications are open for…
- Various roles in data vis and infographics at El Confidencial
- An assistant data and graphics editor at The Los Angeles Times
- A data journalist at the Bayerischer Rundfunk
Help us make this dispatch better! We’d love to hear which newsletters, blogs, or social media accounts we need to follow to learn about interesting projects, especially from less-covered parts of the world (Asia, South America, Africa). Write us at hello@datawrapper.de or leave a comment below.
Want the Dispatch in your inbox every Tuesday? Sign up for our Blog Update newsletter!


Comments