This article is brought to you by Datawrapper, a data visualization tool for creating charts, maps, and tables. Learn more.
Data Vis Dispatch, May 10
The best of last week’s big and small data visualizations

Welcome back to the 44th edition of Data Vis Dispatch! Every week, we’ll be publishing a collection of the best small and large data visualizations we find, especially from news organizations — to celebrate data journalism, data visualization, simple charts, elaborate maps, and their creators.
Recurring topics this week include the plans to abolish abortion rights in the U.S., smaller elections, and drought in many parts of the world.
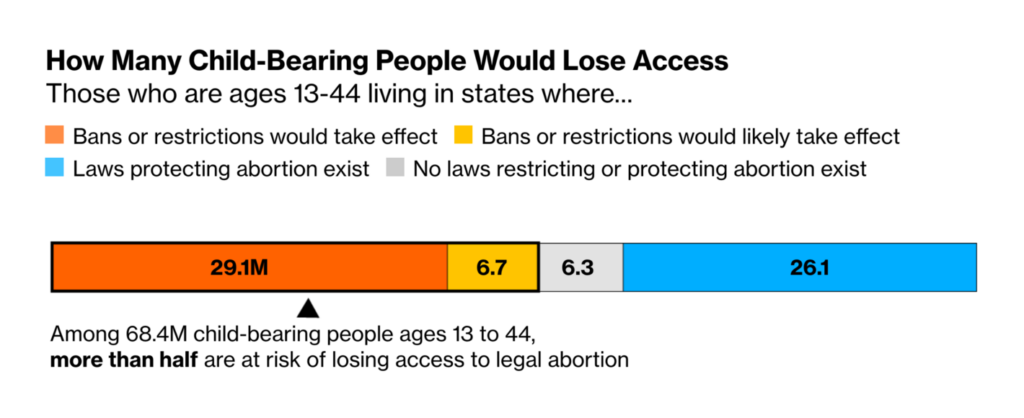
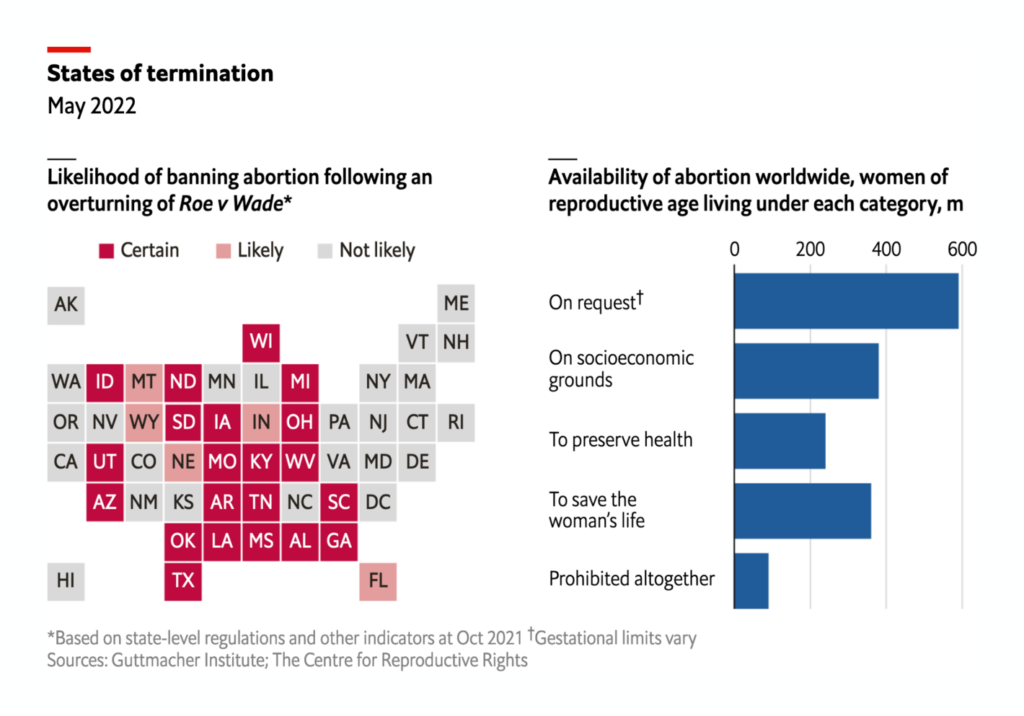
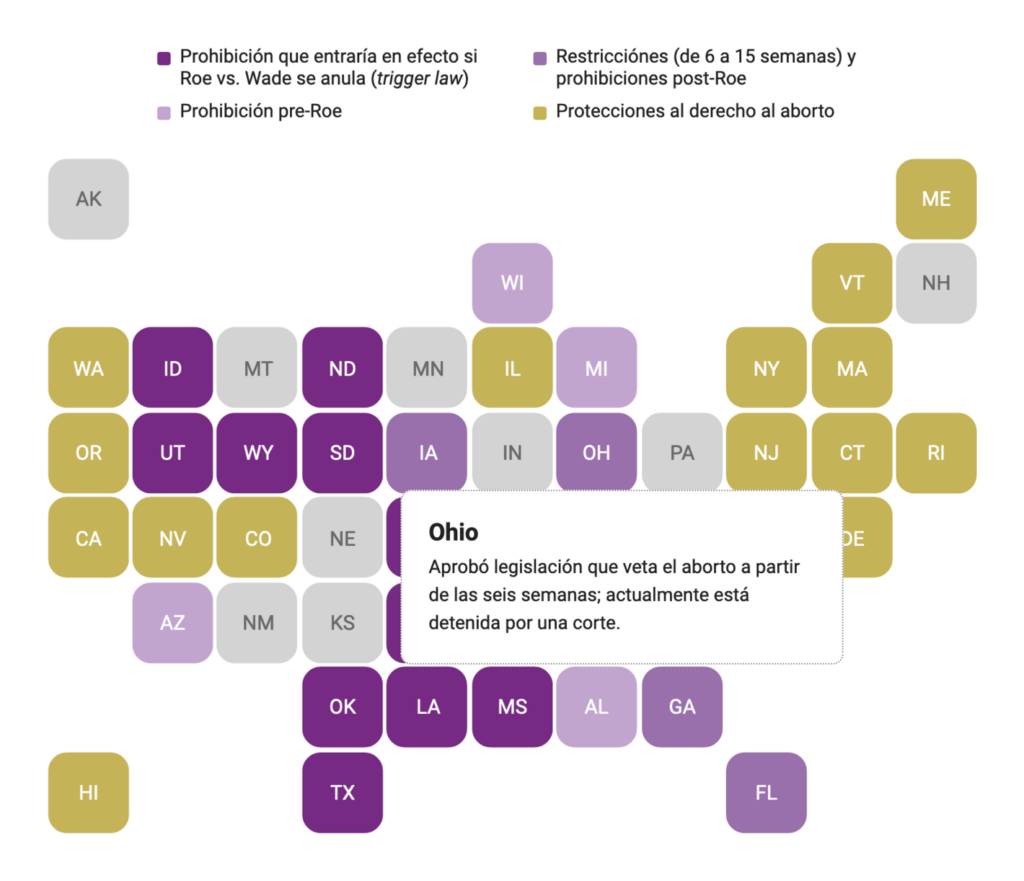
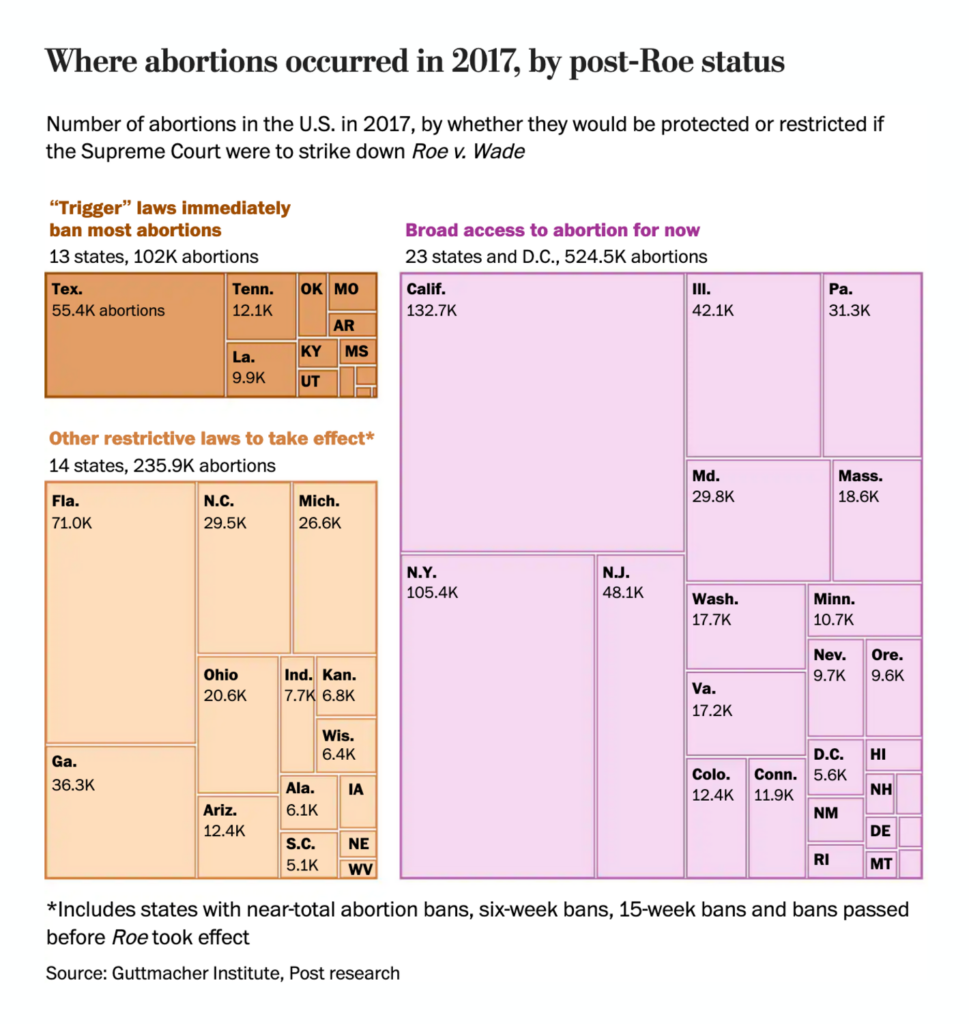
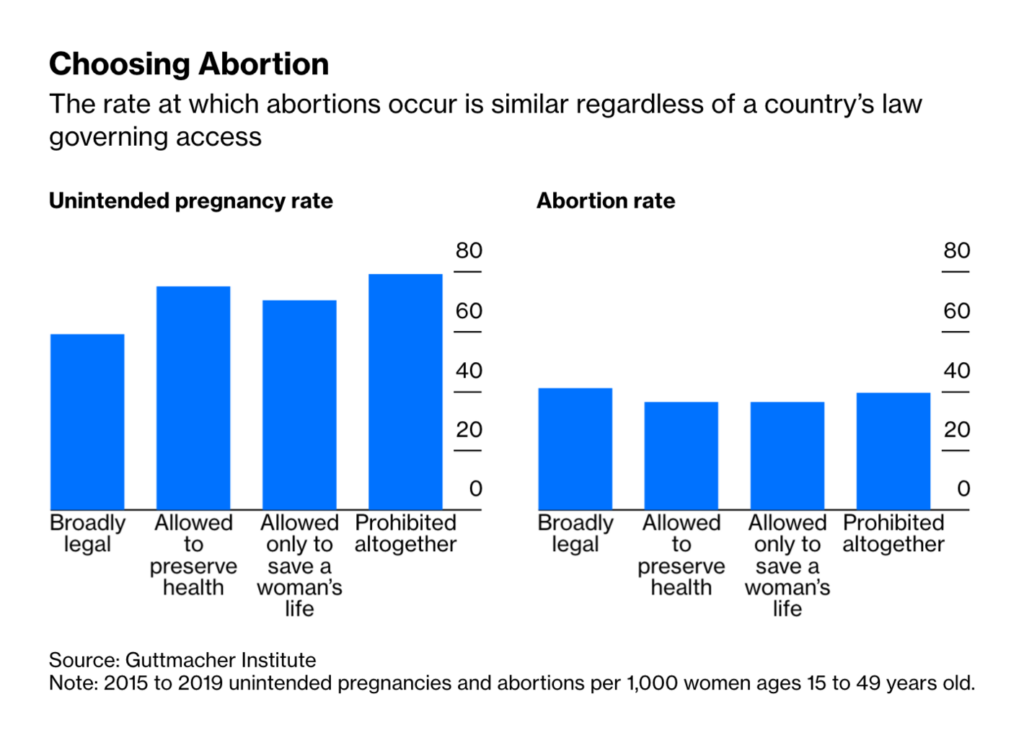
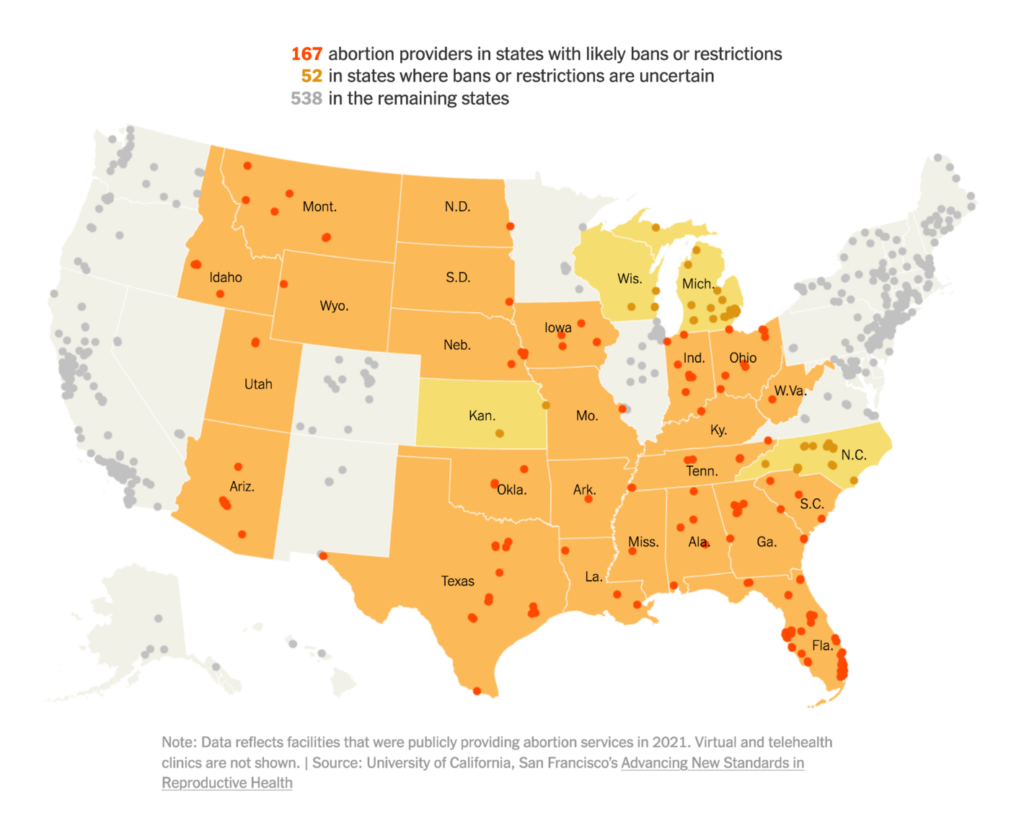
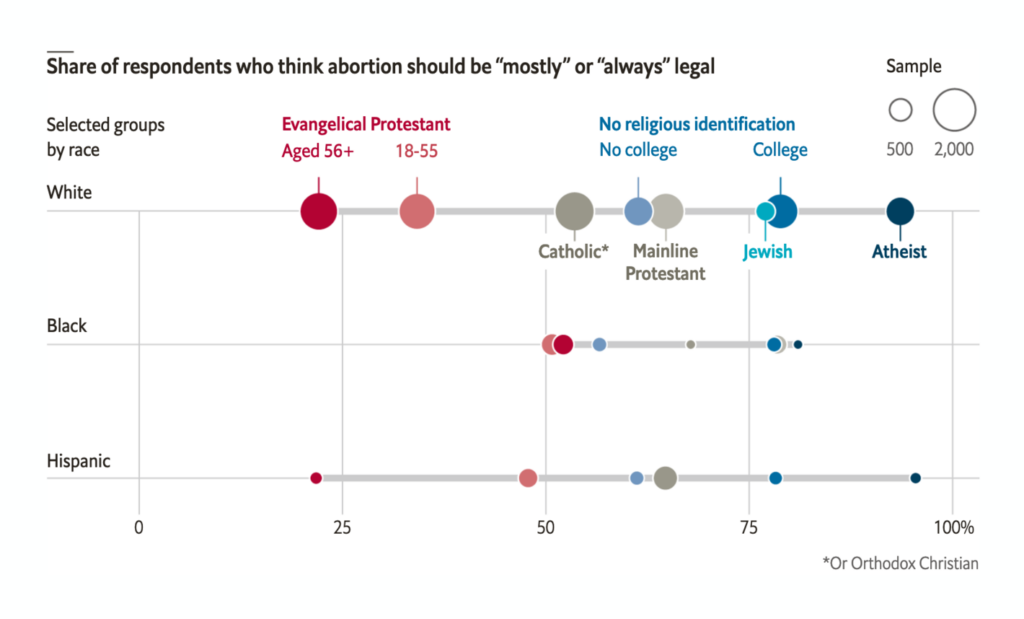
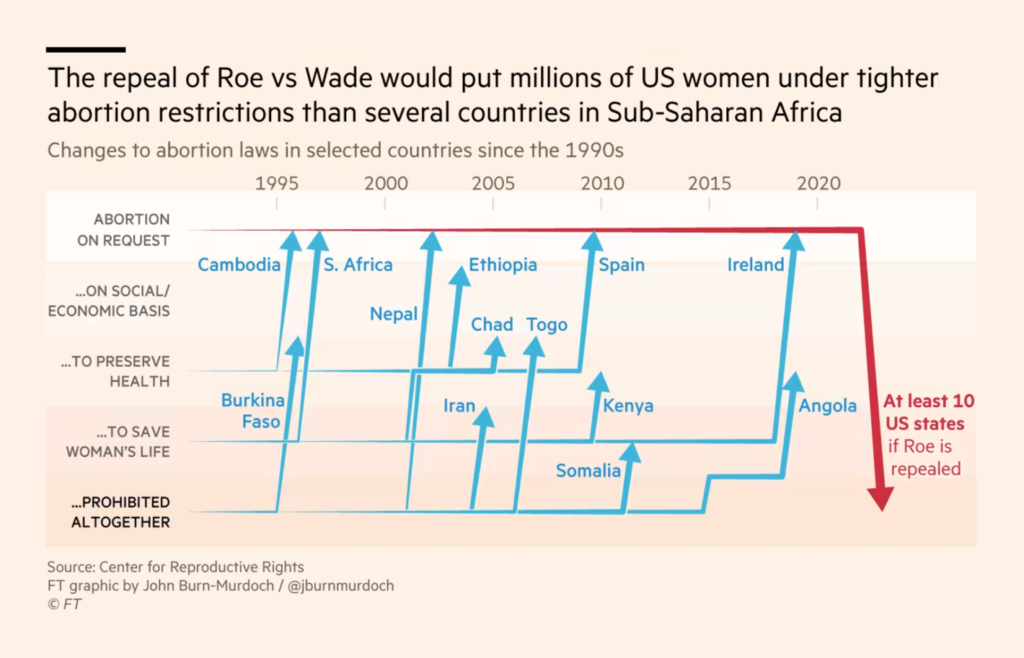
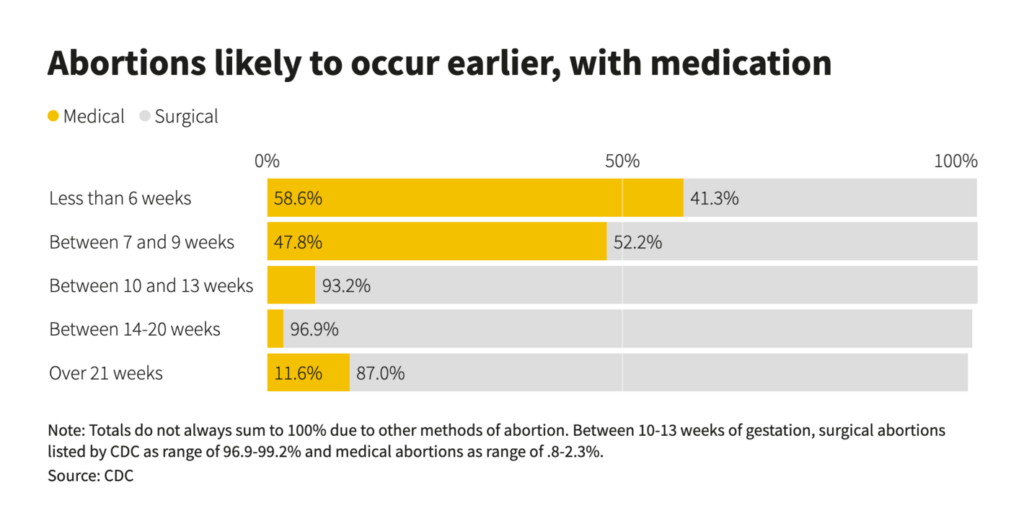
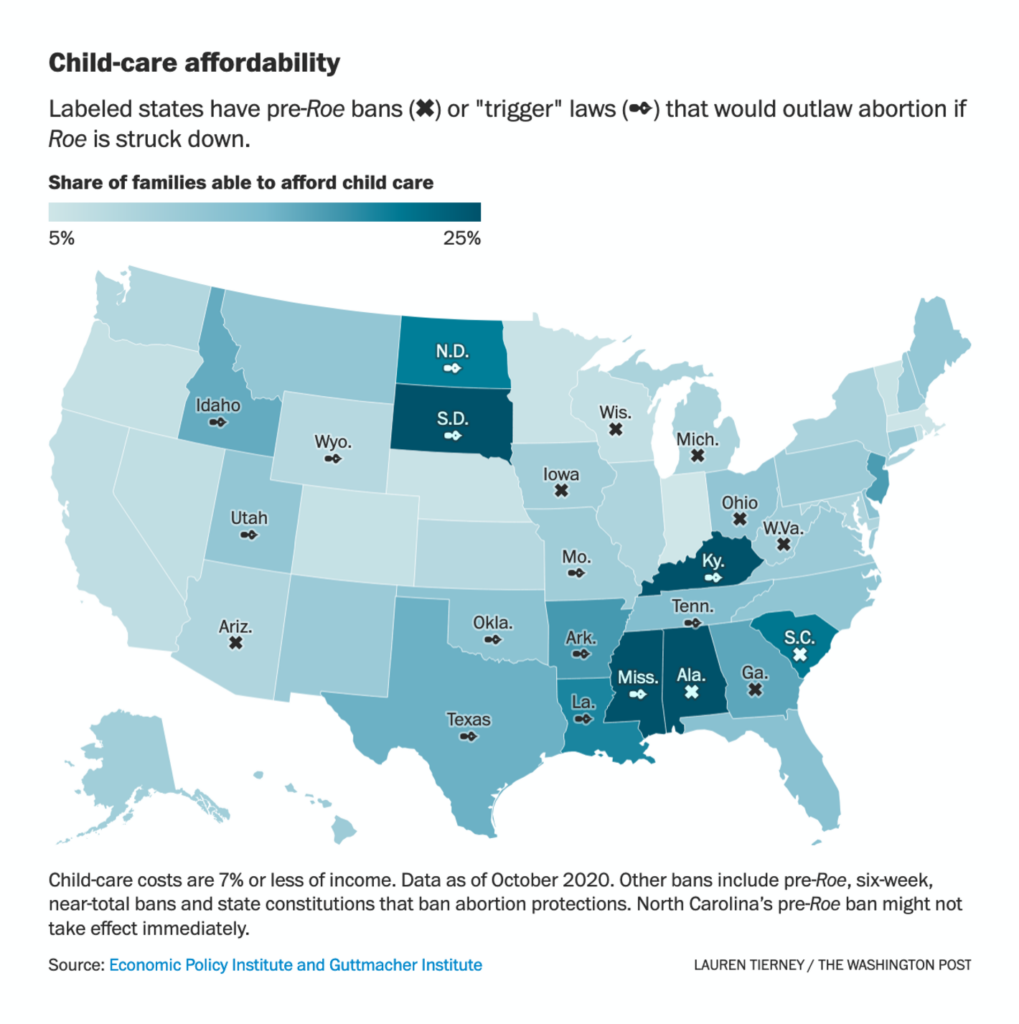
The biggest topic of last week in the U.S. was the possible overturning of abortion rights through the Supreme Court. Newsrooms used visualizations to show many aspects of that political change:


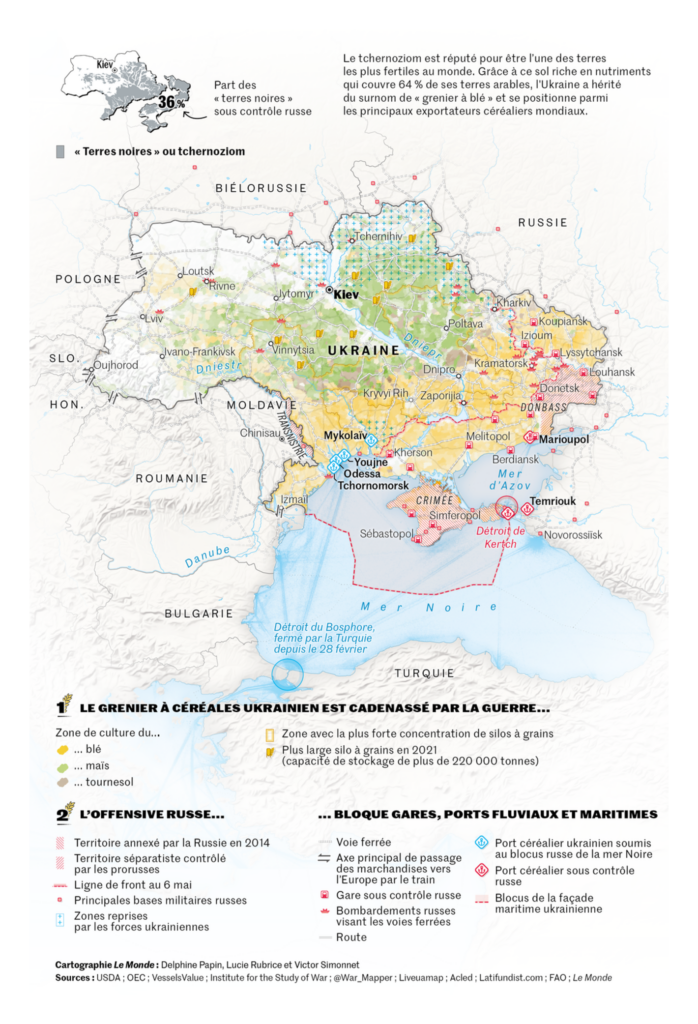
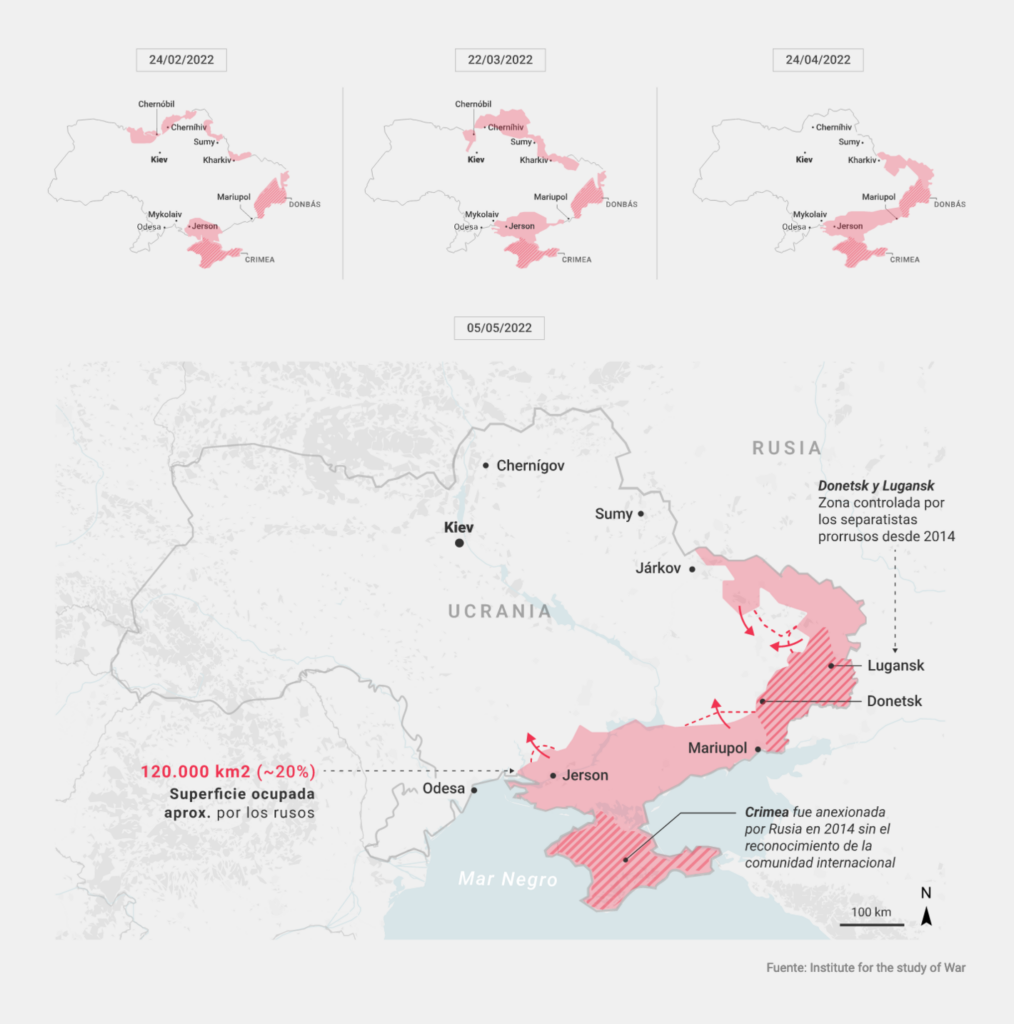
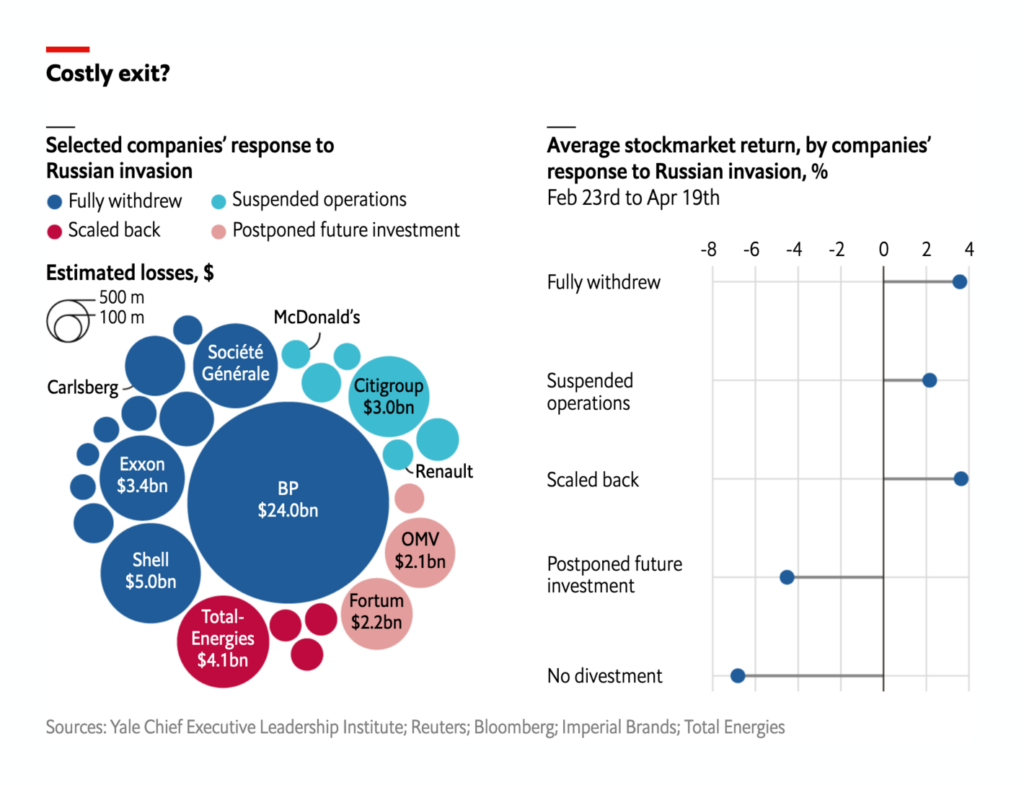
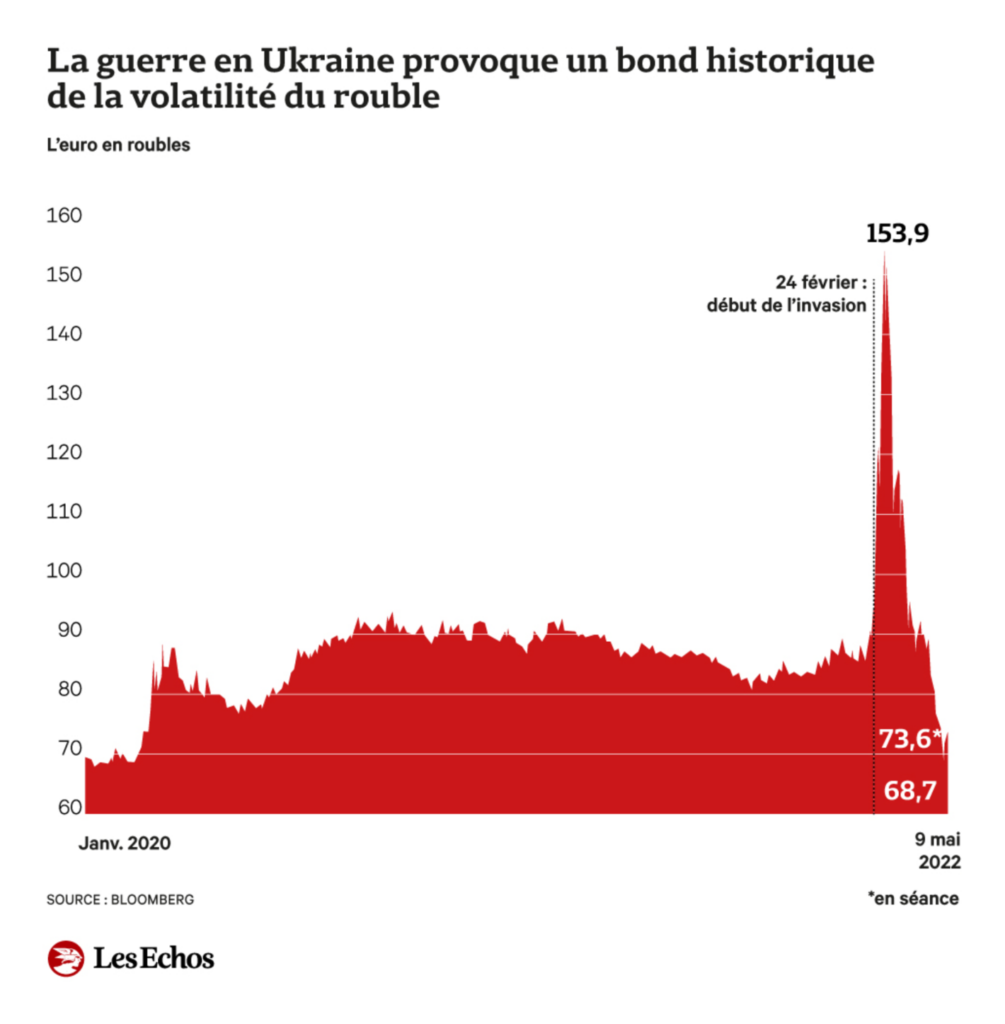
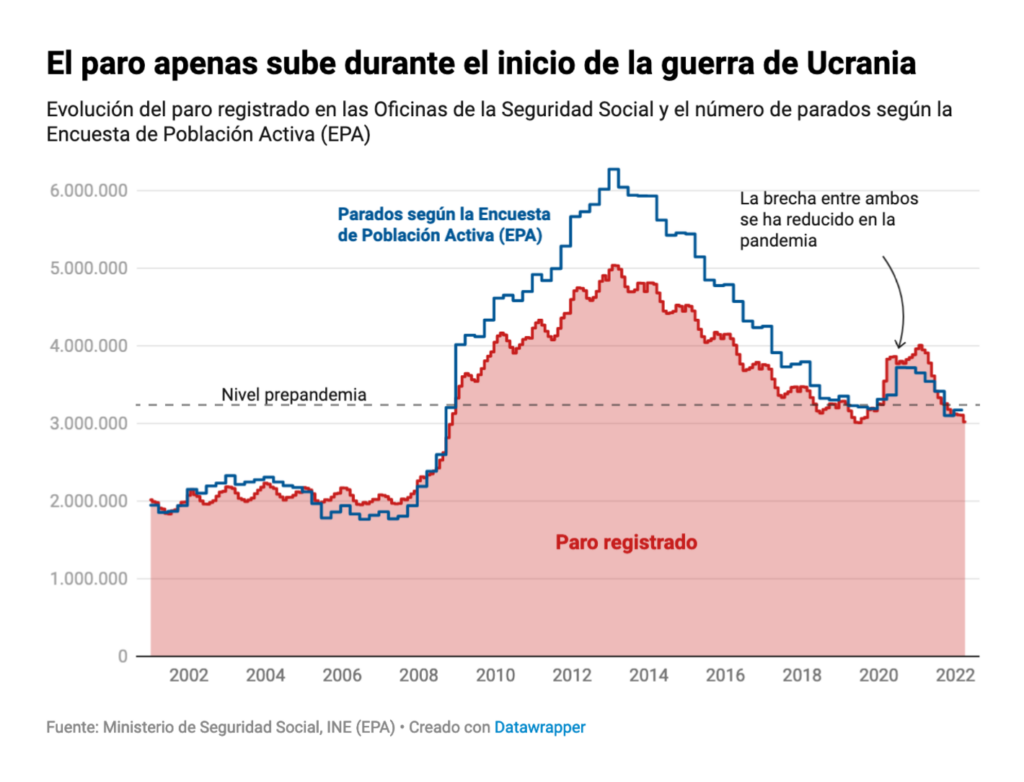
Every week, we’re seeing fewer maps and charts on the Russia-Ukraine war and its consequences. This week, with its big focus on abortion rights, was no exception:
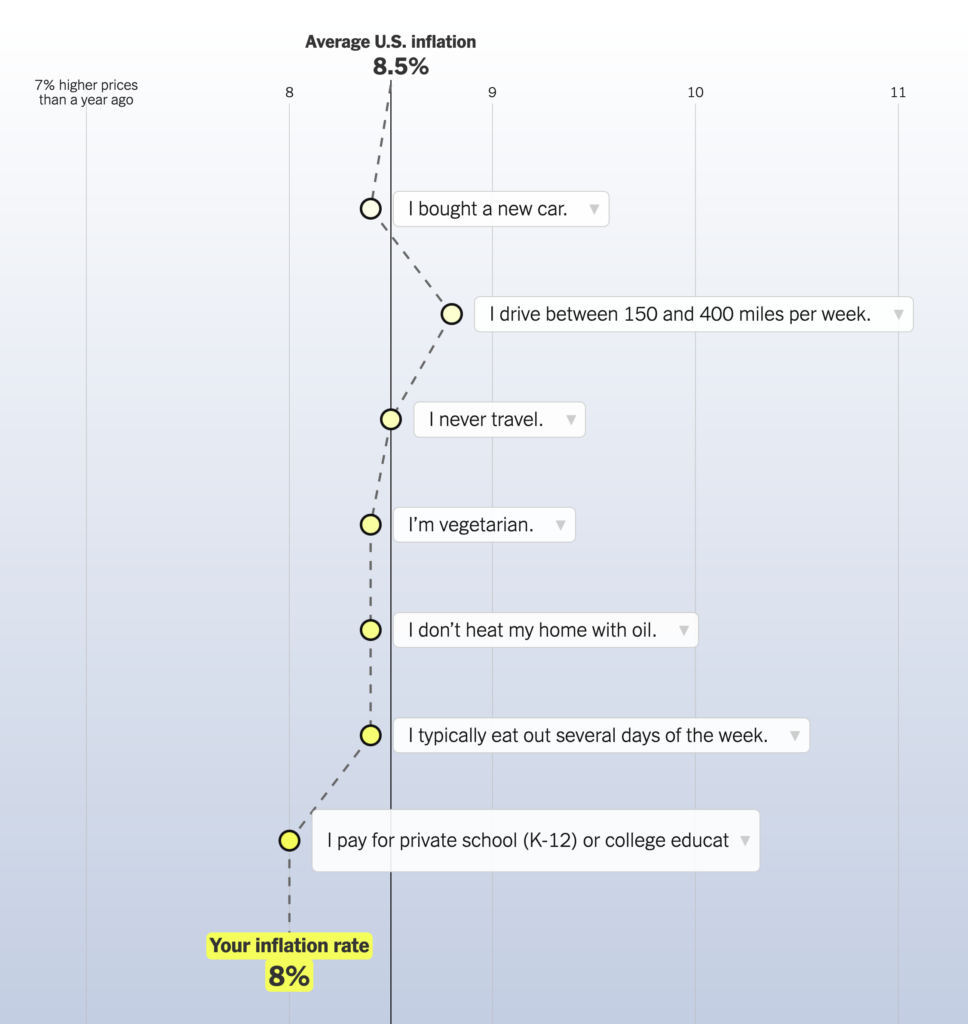
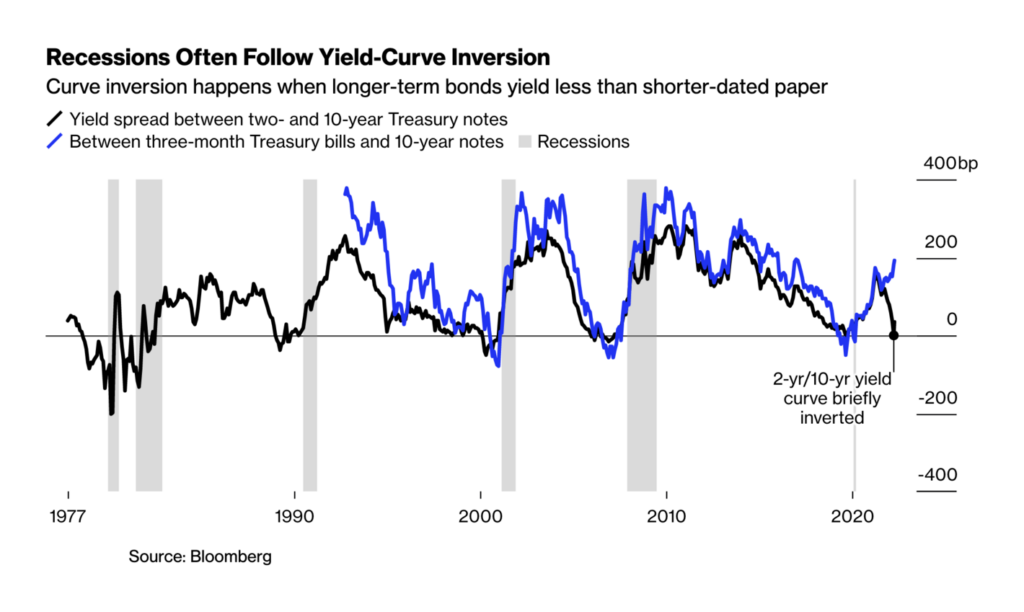
Related to the war is the increasing inflation rate. The New York Times published an interactive experiment that shows how different inflation is depending on your life situation:

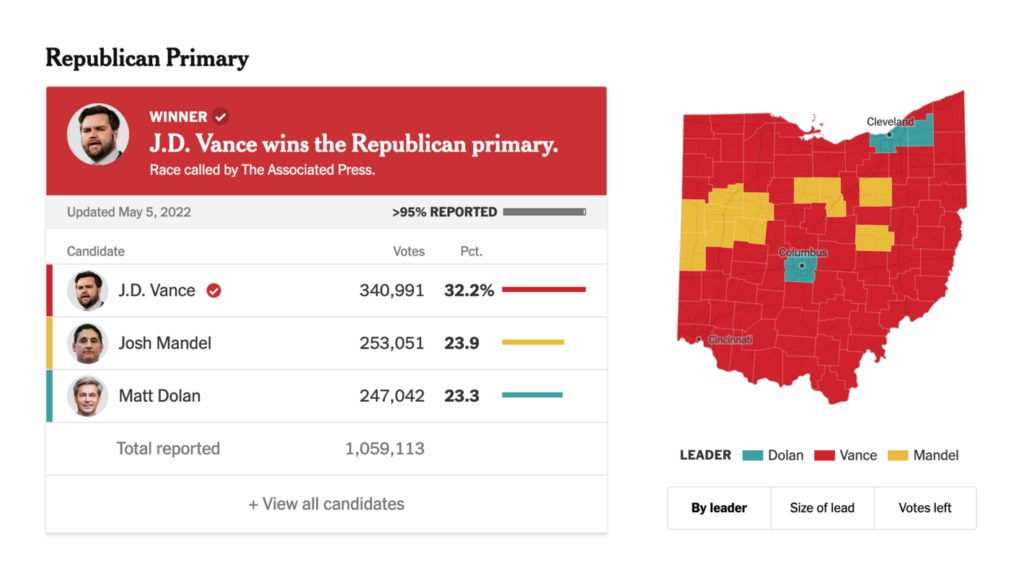
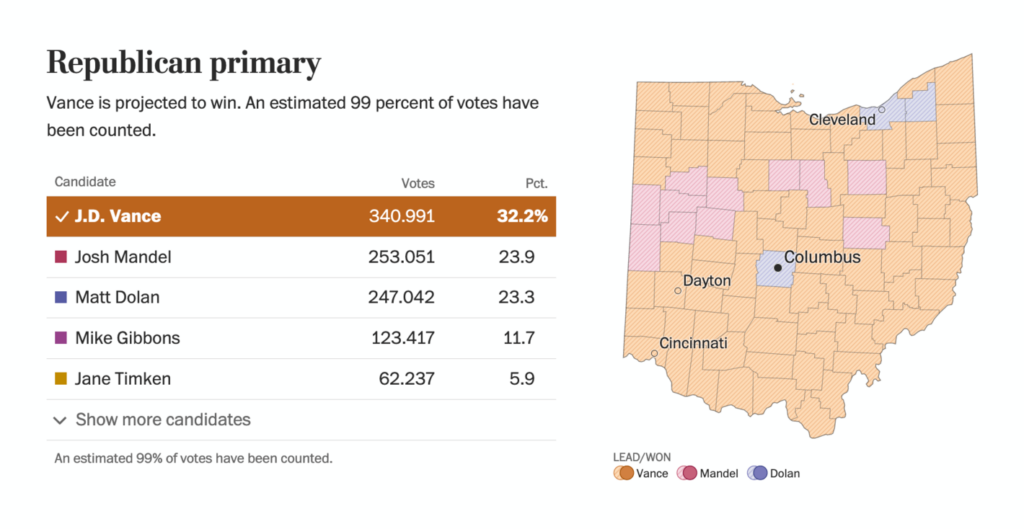
This was also a major week for minor elections. There were three: First, the primary elections for U.S. Senate in Ohio:

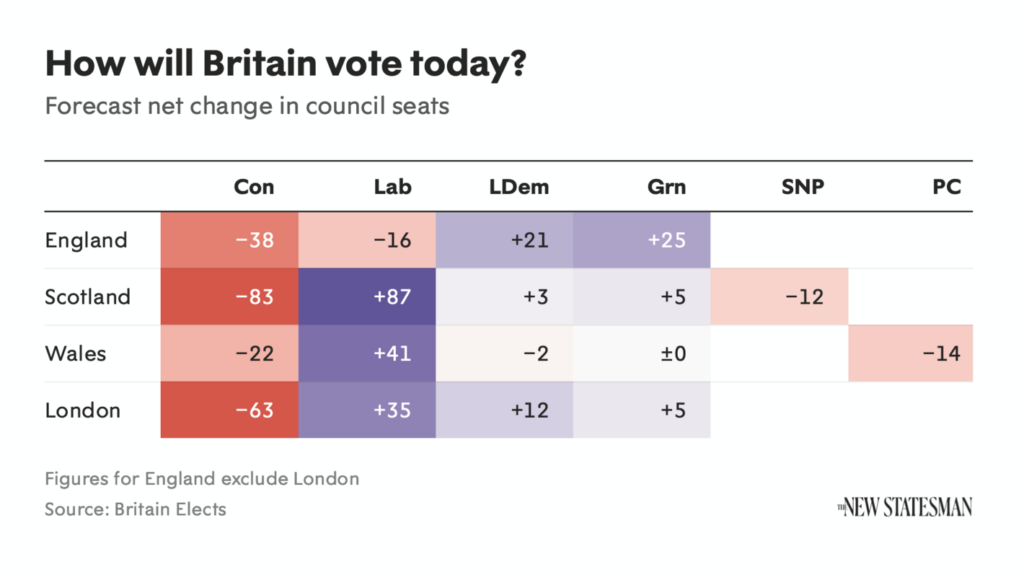
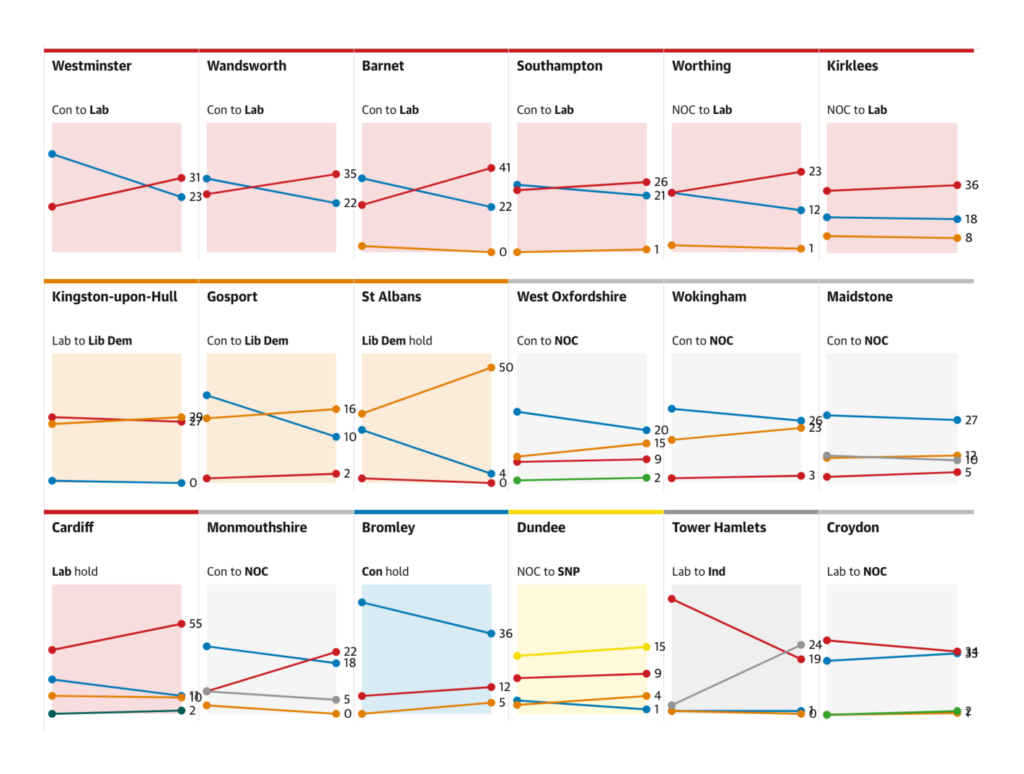
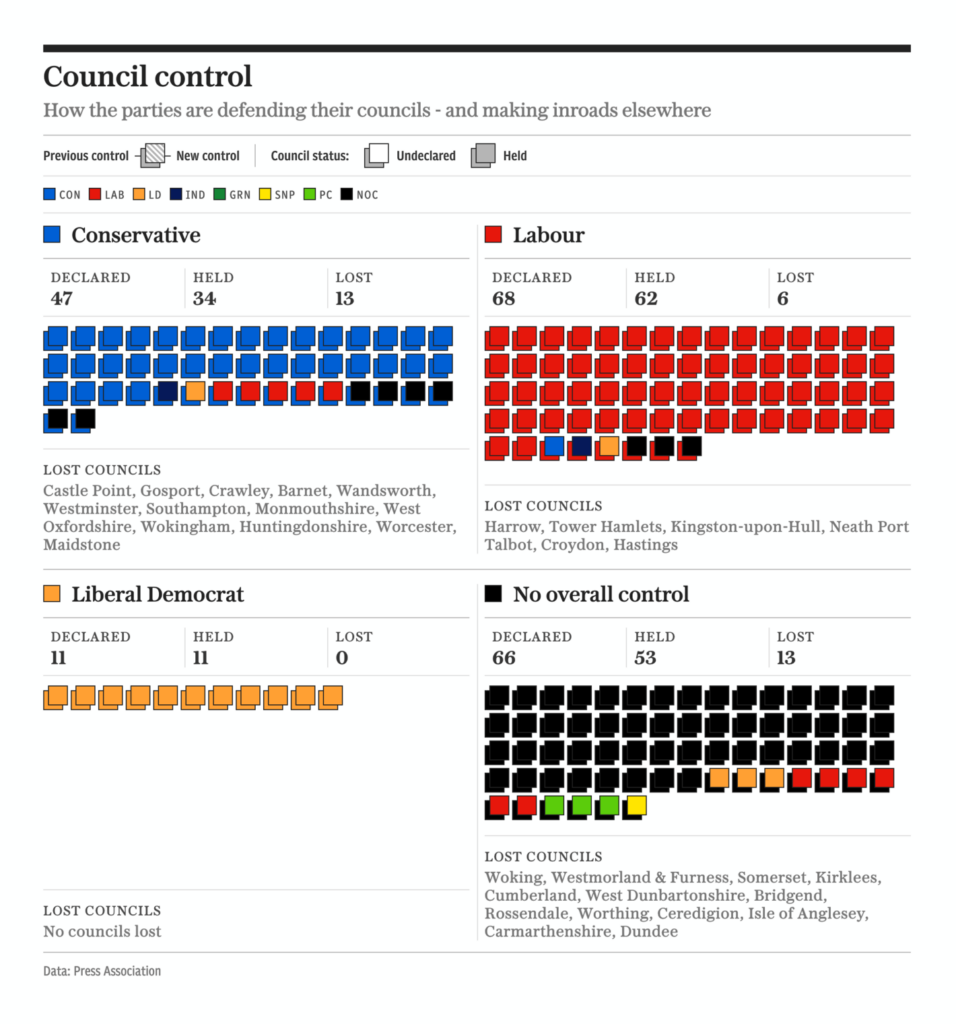
Local elections in Britain and Northern Ireland were happening last week, too, with a clear loser: The Conservative party lost hundreds of seats.


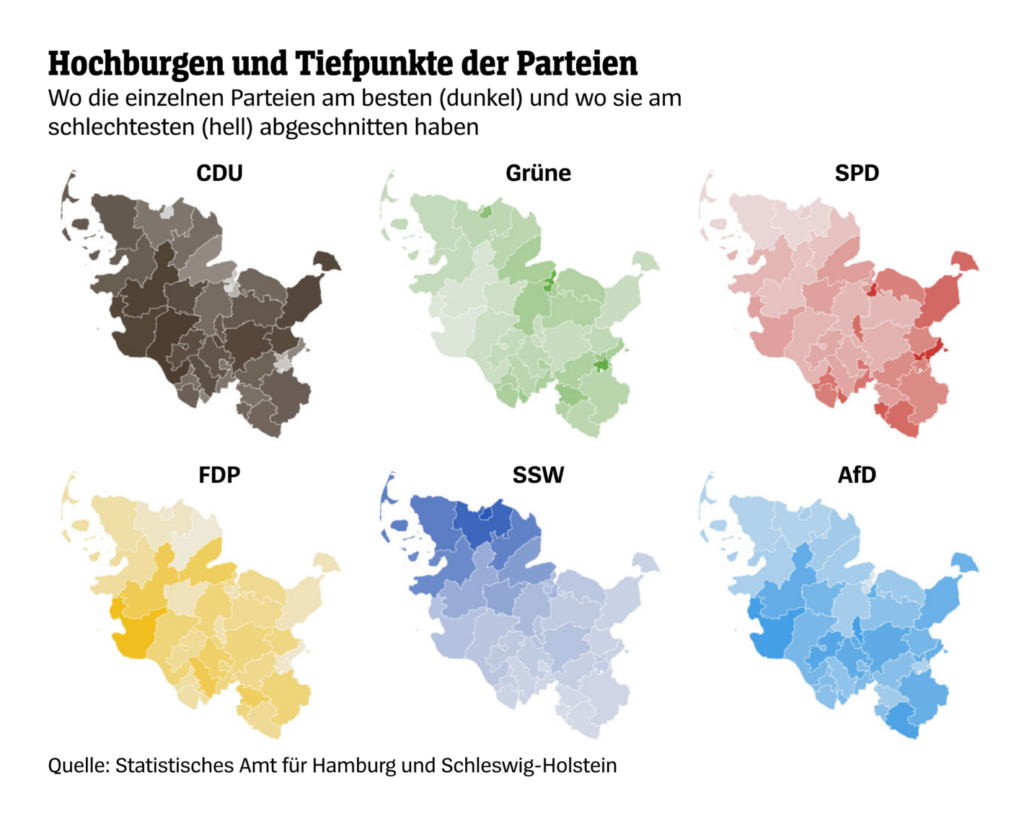
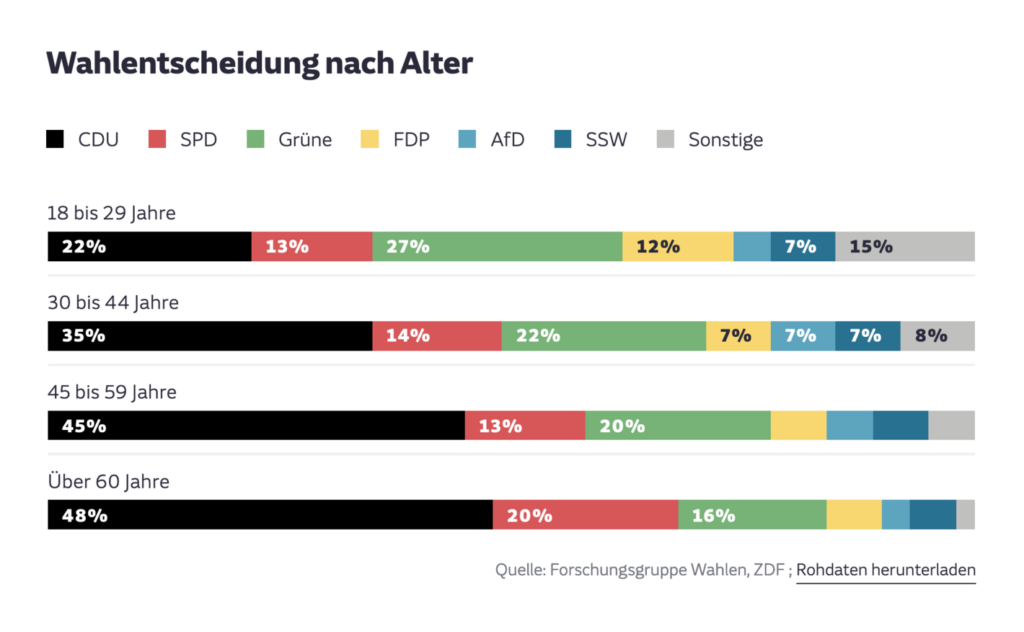
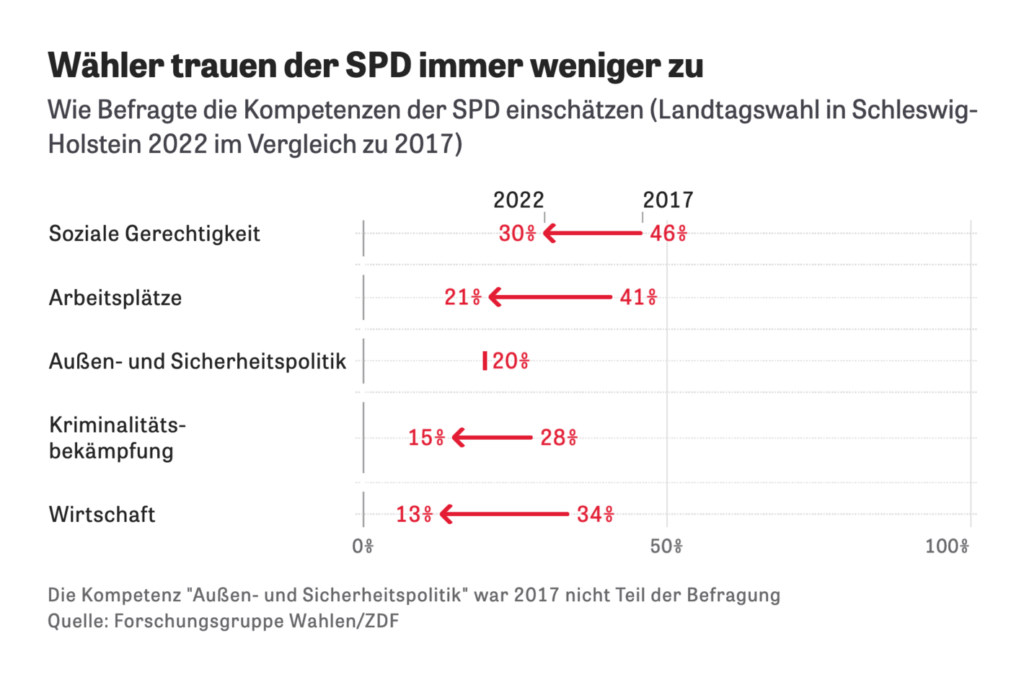
The opposite happened in the state parliament of Schleswig-Holstein, Germany’s northernmost region. Here, the conservative party CDU won by a big margin:

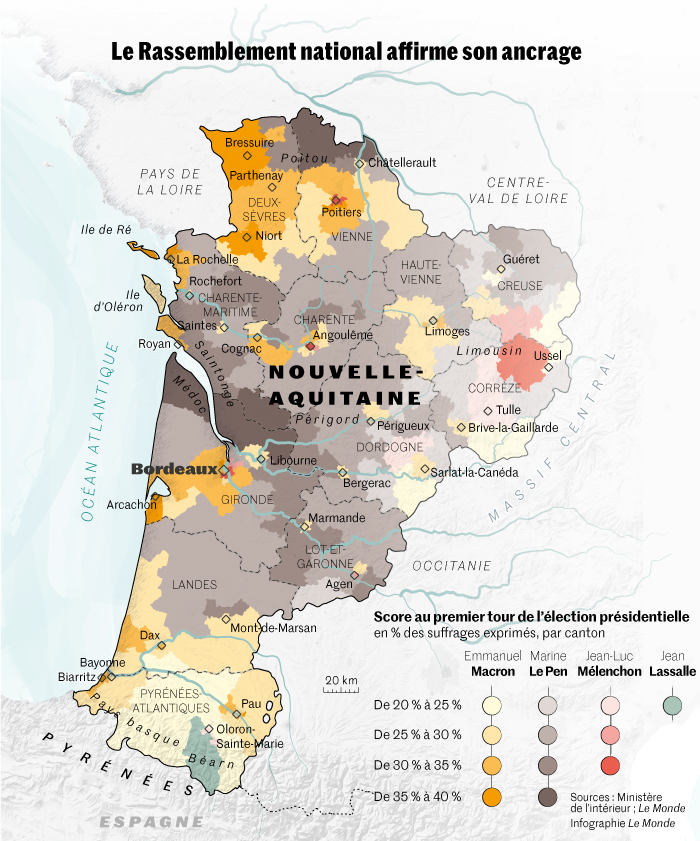
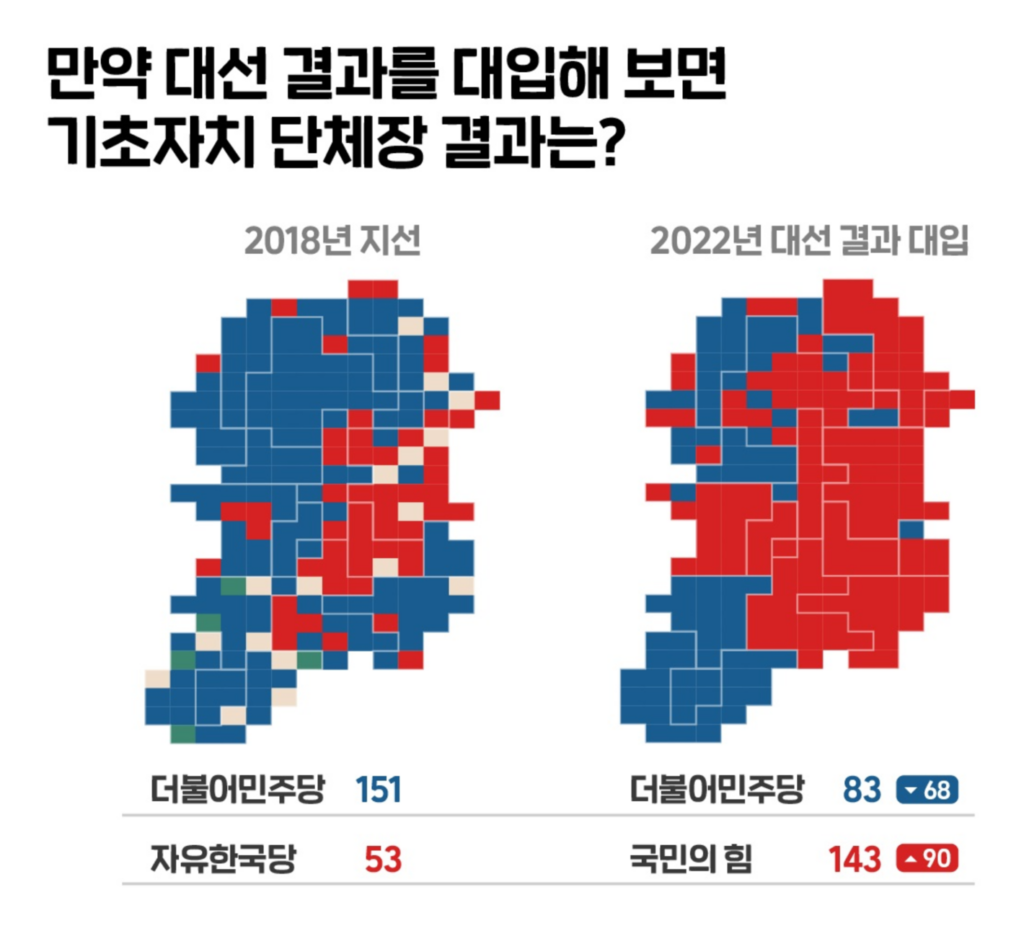
Le Monde is also still busy analyzing the French election — and South Korean SBS News focuses on the importance of local elections:
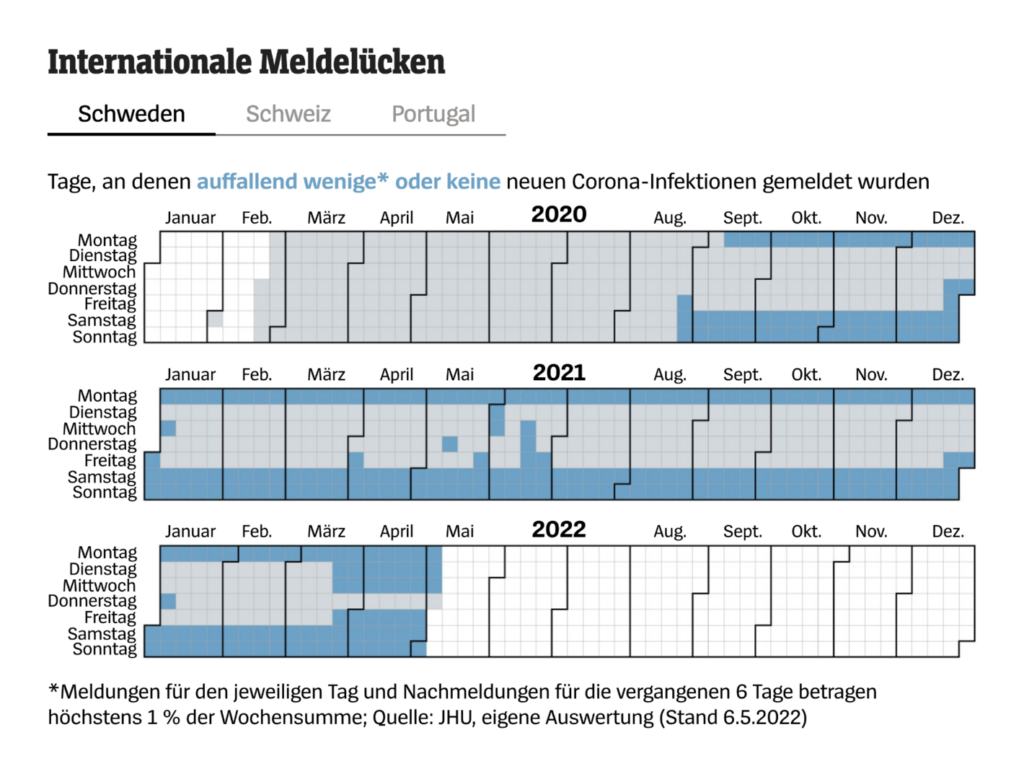
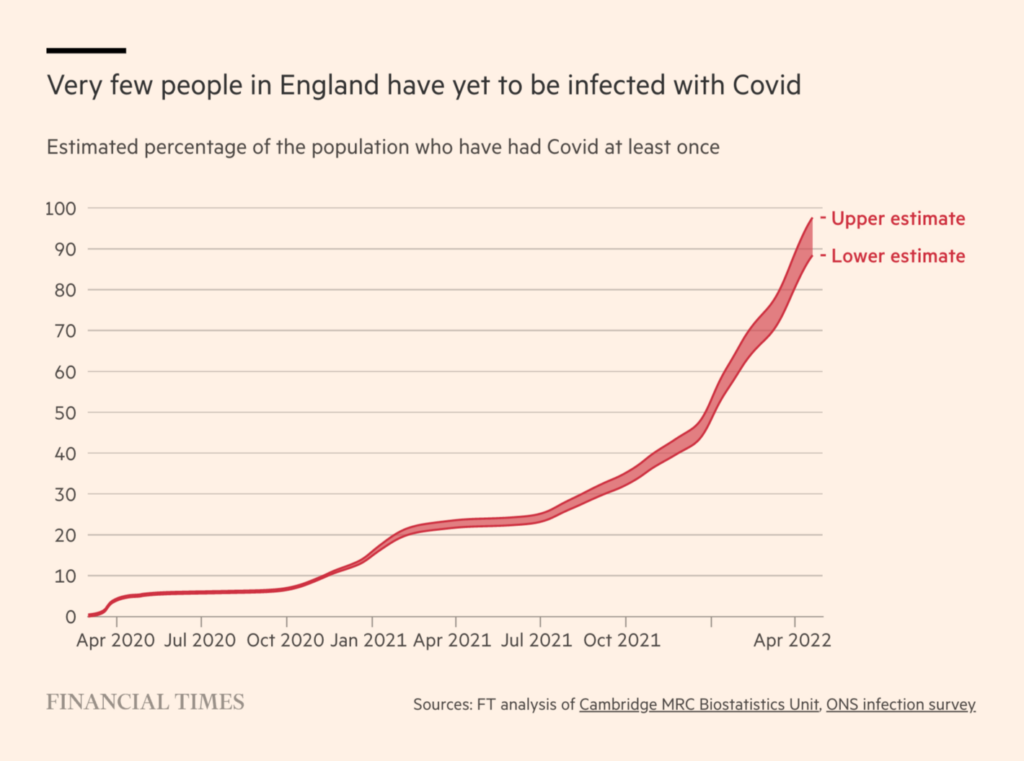
This wouldn’t be a Data Vis Dispatch without some COVID-19 charts. This month, the U.S. passes the grim milestone of 1,000,000 total COVID deaths, as Axios reminds us with this powerful article:

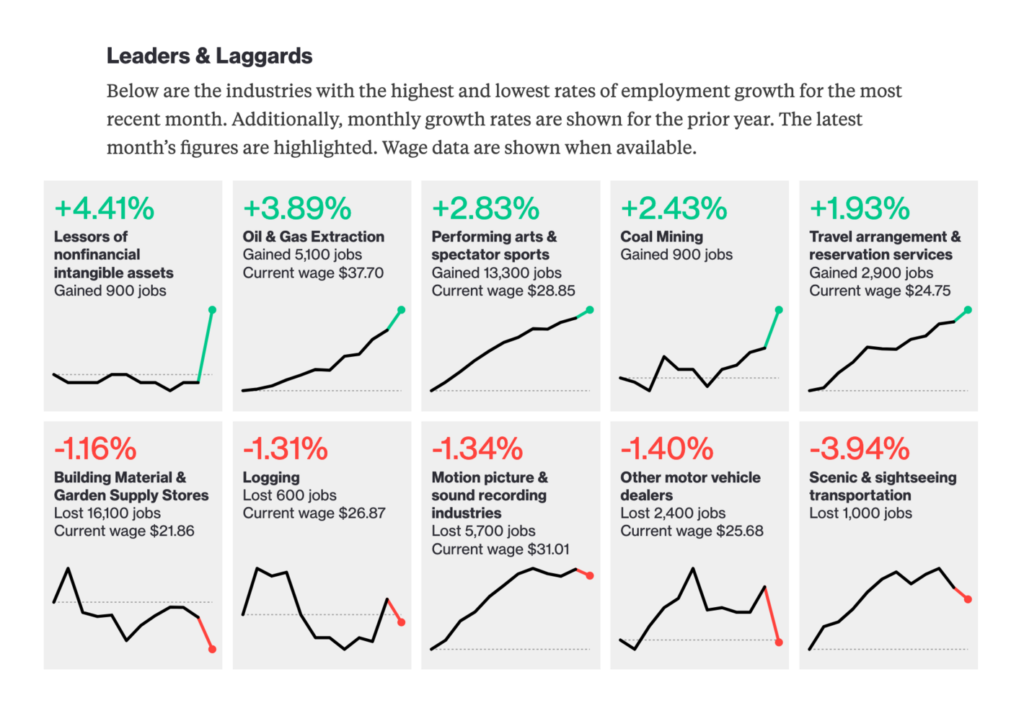
In better news, the economy is doing well — at least in some parts. The April jobs report in the U.S. shows some industries making strong gains:
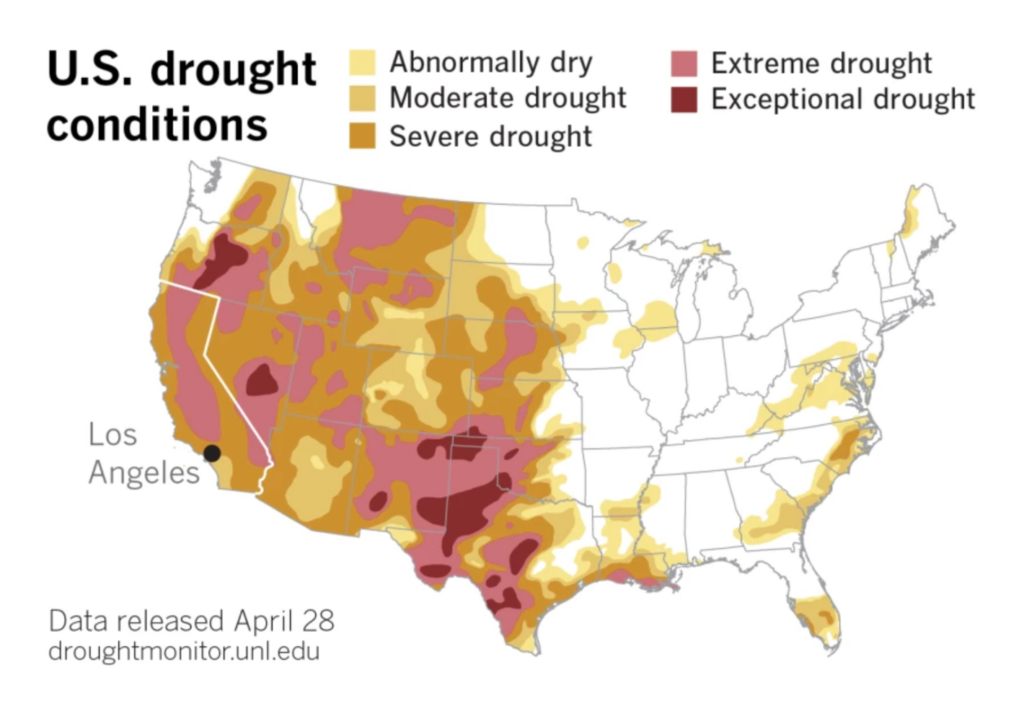
What else? The climate. Temperatures in India are still extreme, while some regions in the U.S. are starting to experience problems with drought:


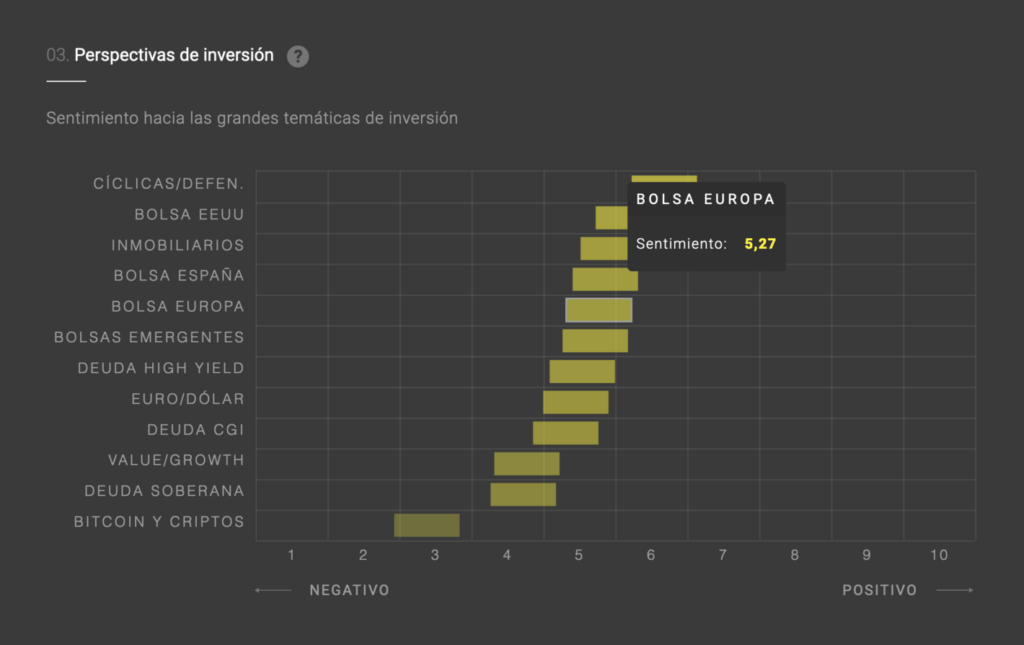
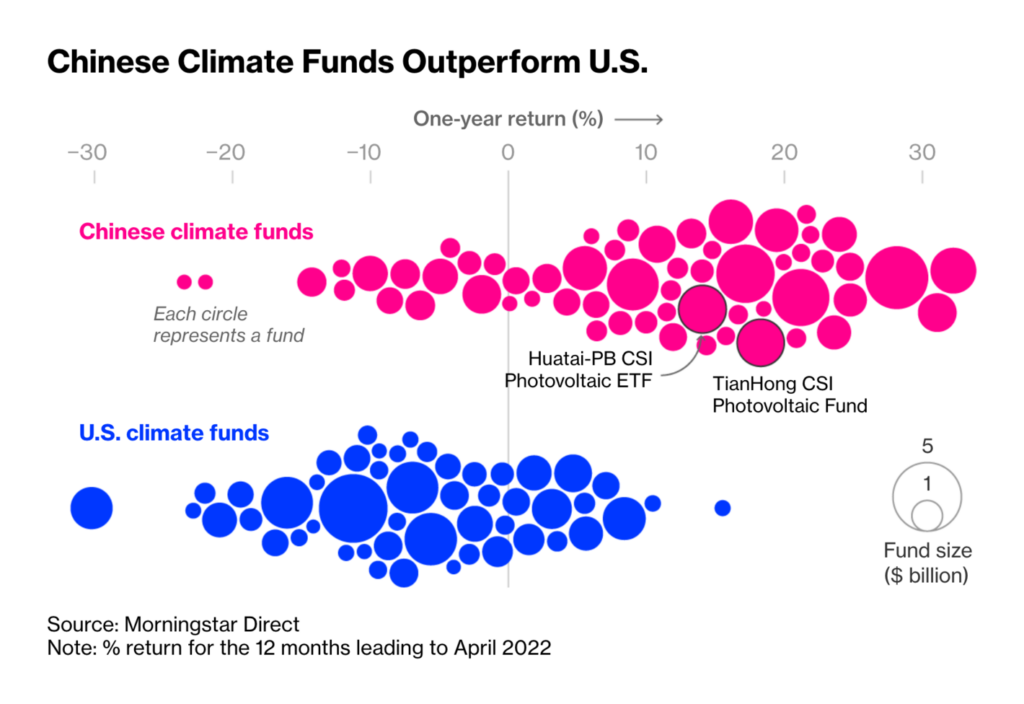
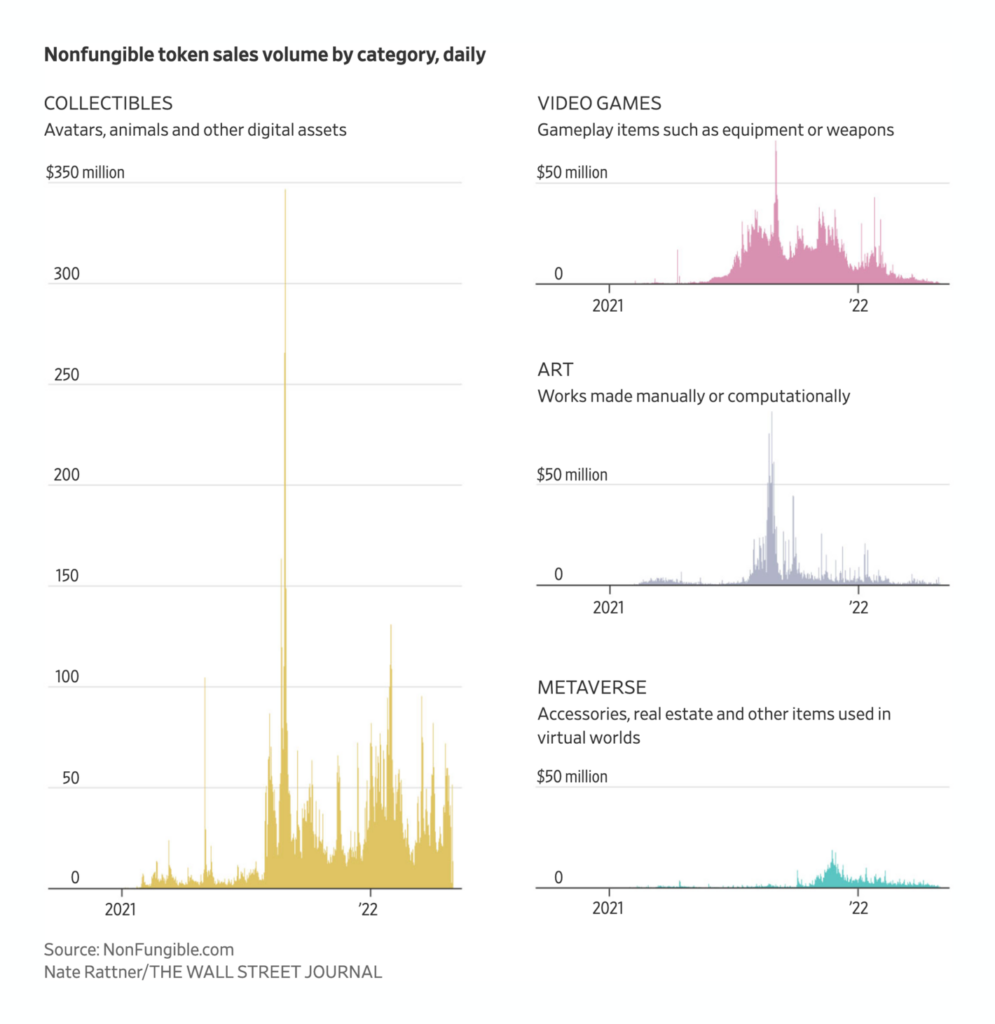
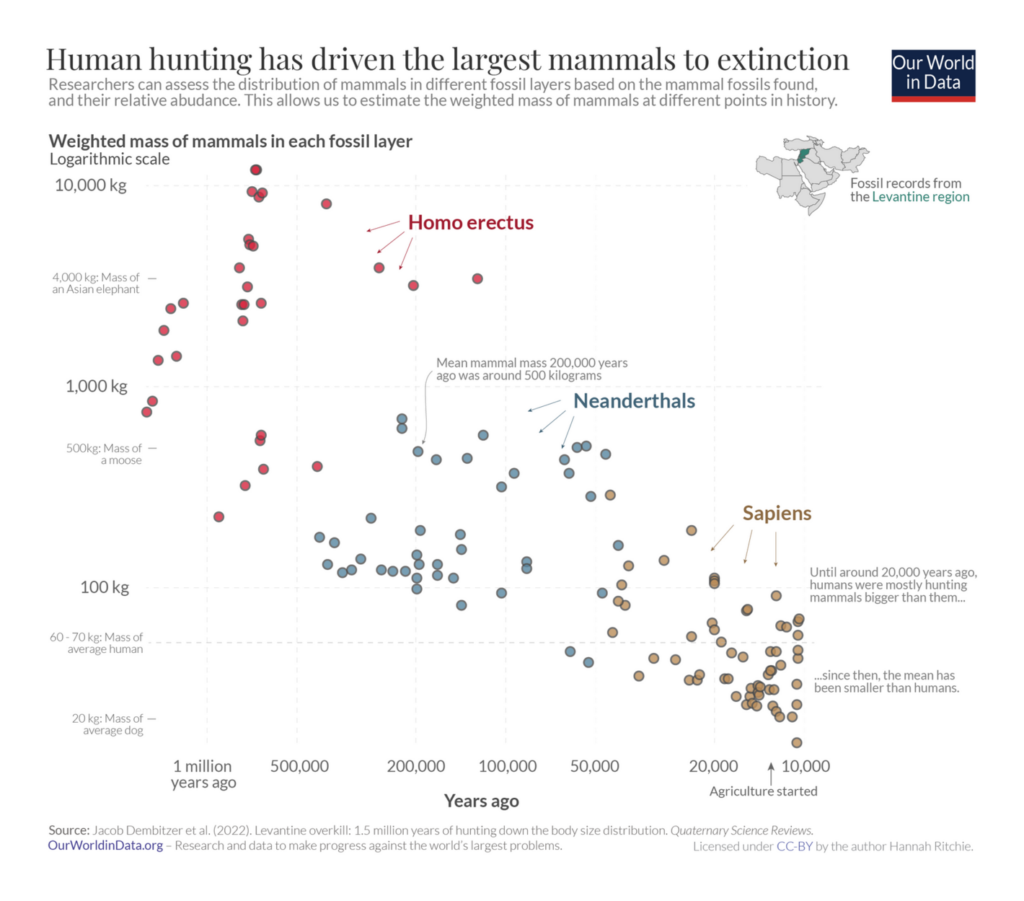
A beautiful visualization on Formula One races, a waning interest in NFTs, and an explanation of why there are fewer big mammals these days than they could be — find all this and more in our miscellaneous section:

What else we found interesting


Applications are open for…
- Head of Product & Design at Our World in Data
- Graphics/Multimedia Editor with a focus on maps at The New York Times
Help us make this dispatch better! We’d love to hear which newsletters, blogs, or social media accounts we need to follow to learn about interesting projects, especially from less-covered parts of the world (Asia, South America, Africa). Write us at hello@datawrapper.de or leave a comment below.
Want the Dispatch in your inbox every Tuesday? Sign up for our Blog Update newsletter!


Comments