We want to enable everyone to create beautiful charts, maps, and tables. New to data visualization? Or do you have specific questions about us? You'll find all the answers here.
The best of last week’s big and small data visualizations
Vivien Serve
Welcome back to the 168th edition of the Data Vis Dispatch! Every week, we publish a collection of the best small and large data visualizations we find, especially from news organizations — to celebrate data journalism, data visualization, simple charts, elaborate maps, and their creators.
Recurring topics this week include U.S. election results, analysis, and birds.
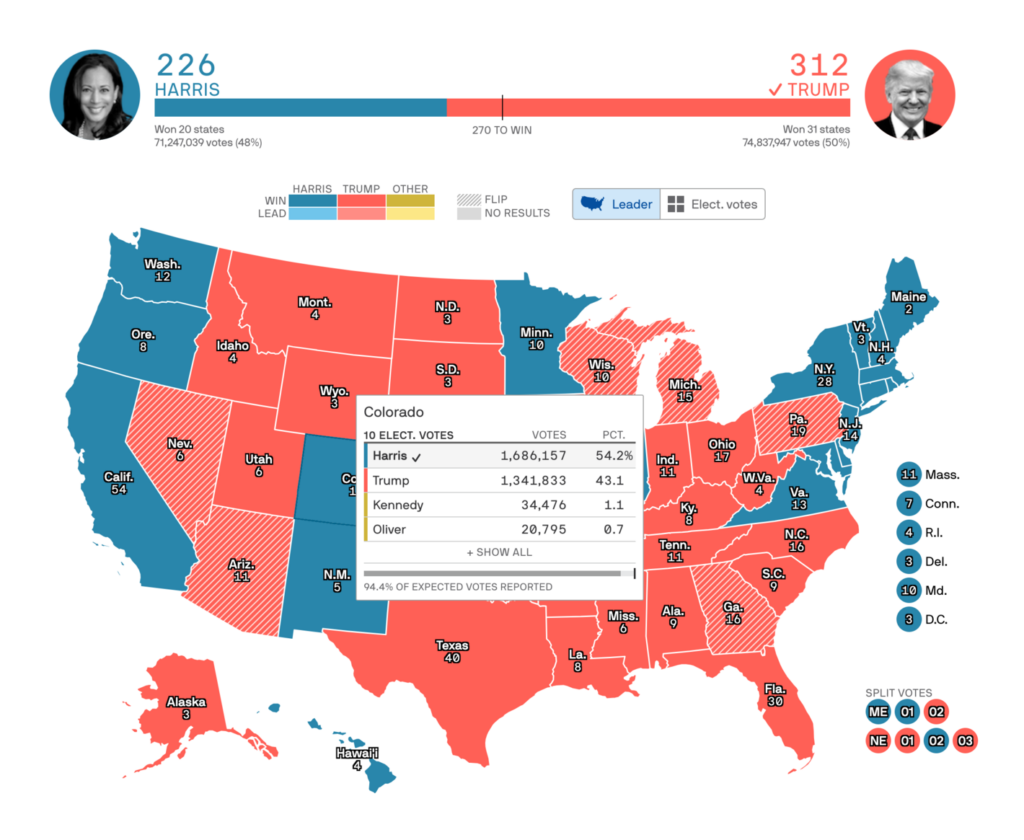
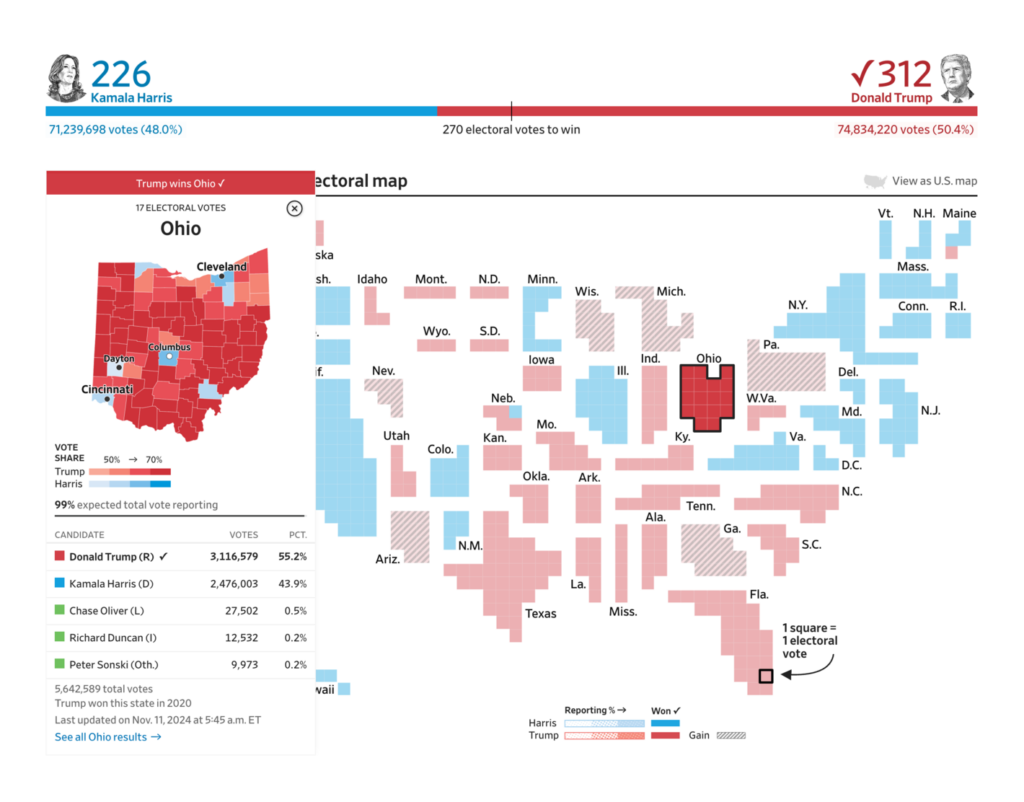
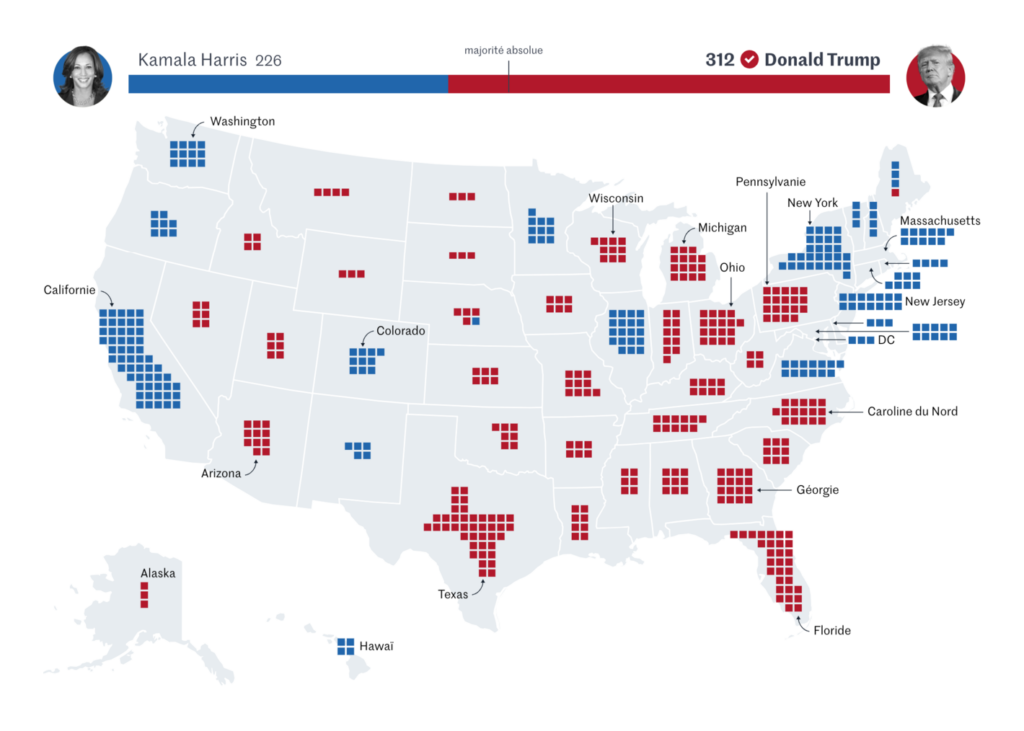
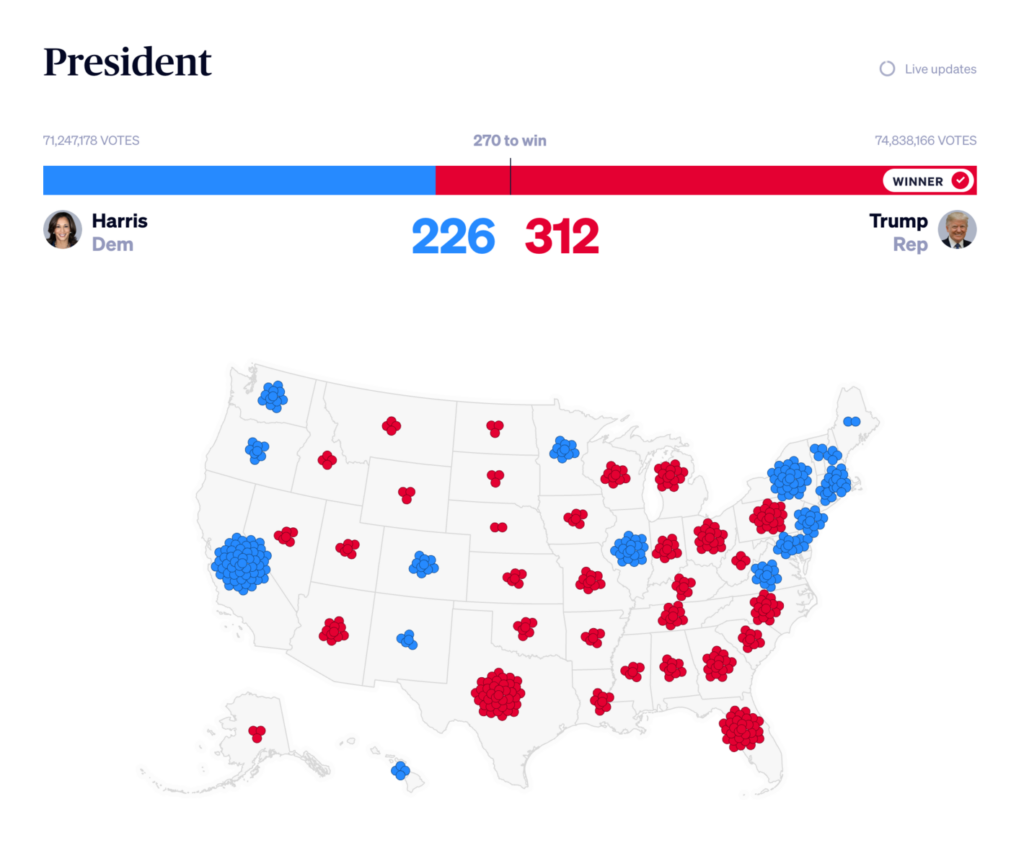
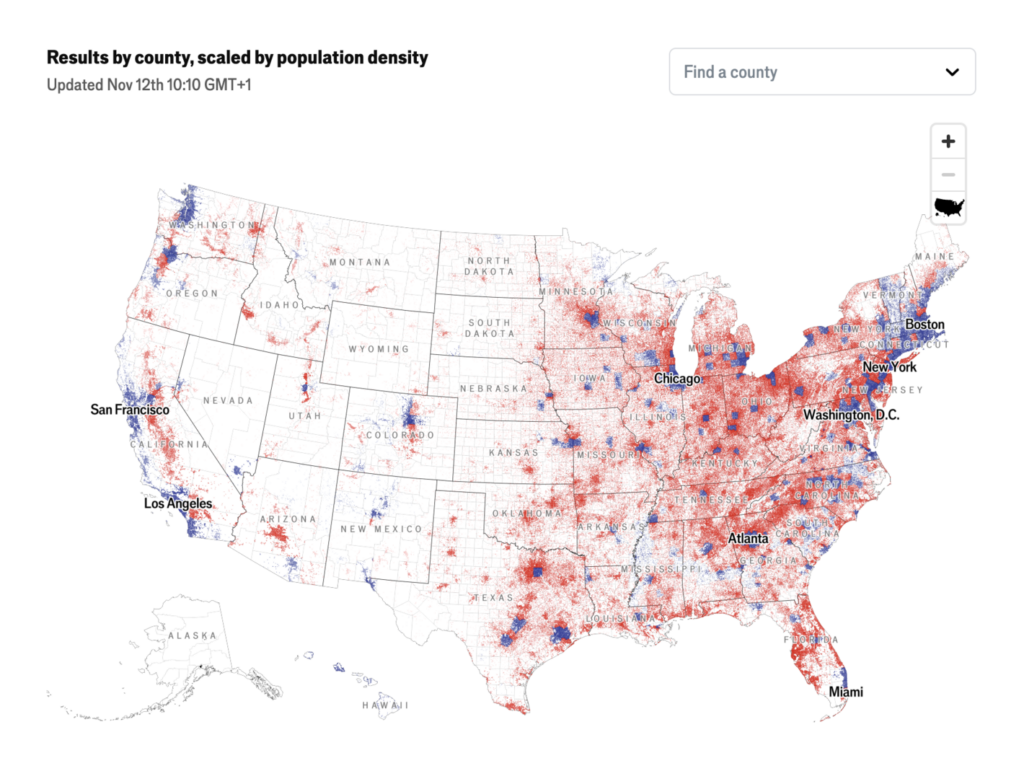
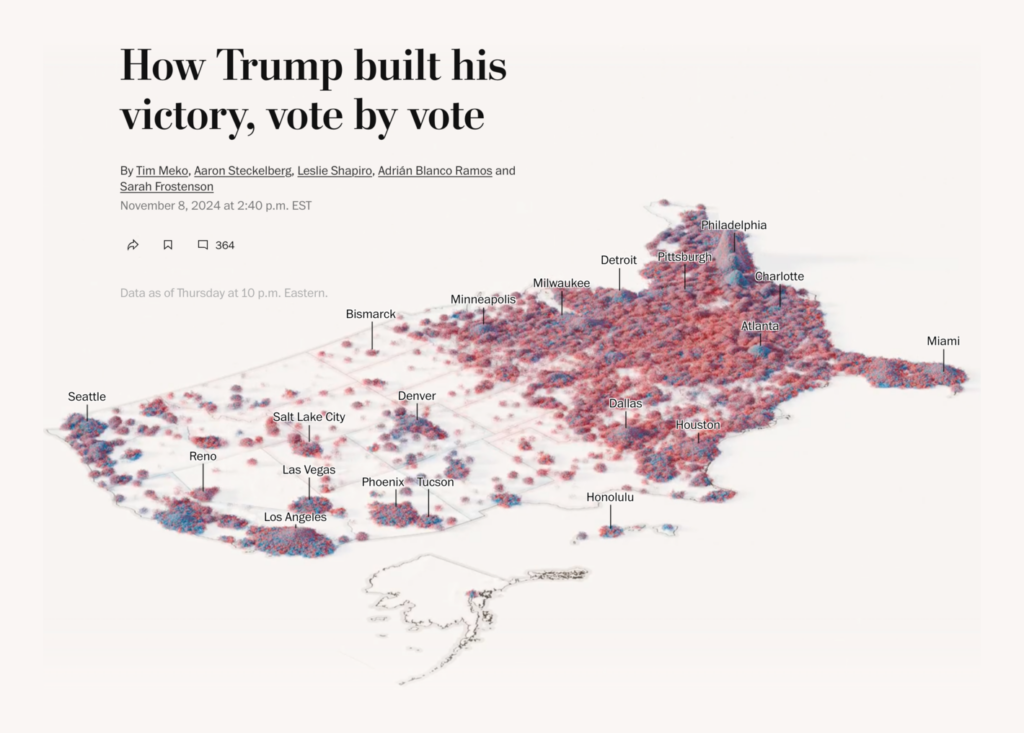
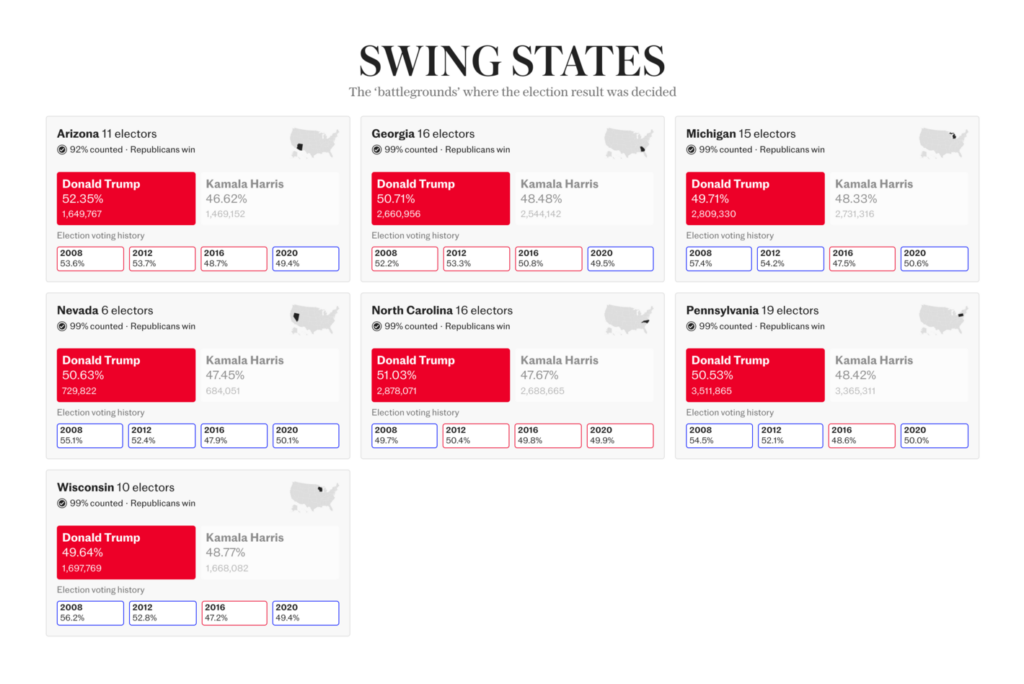
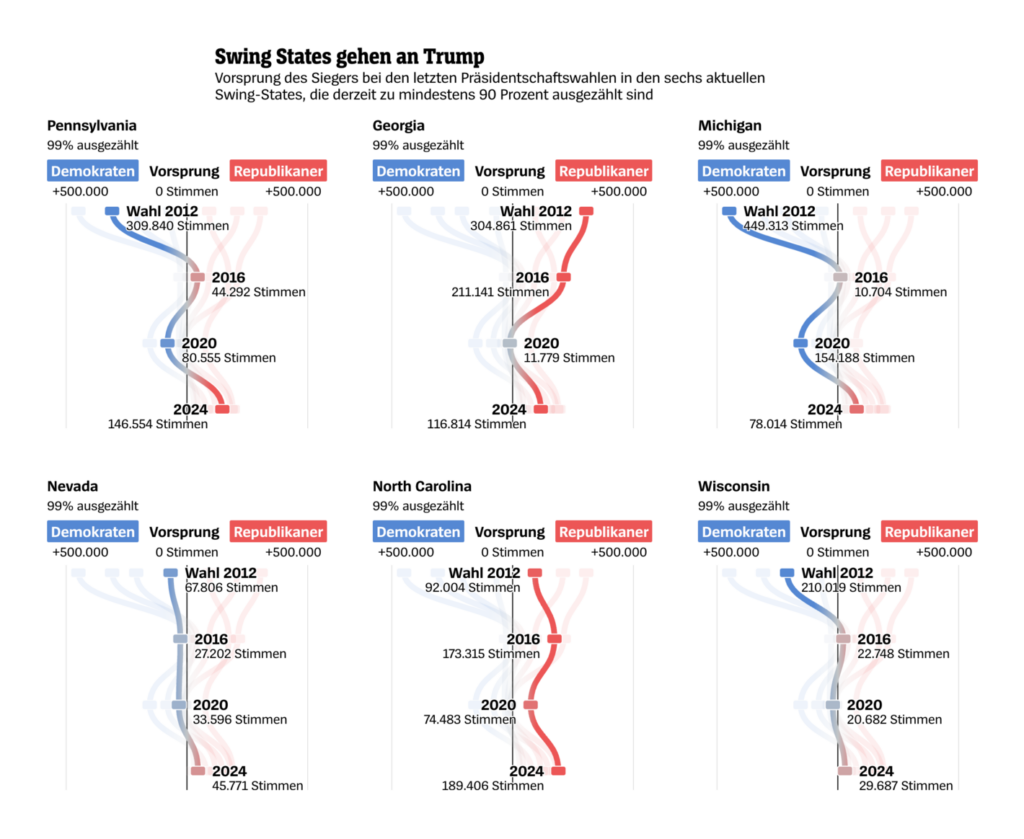
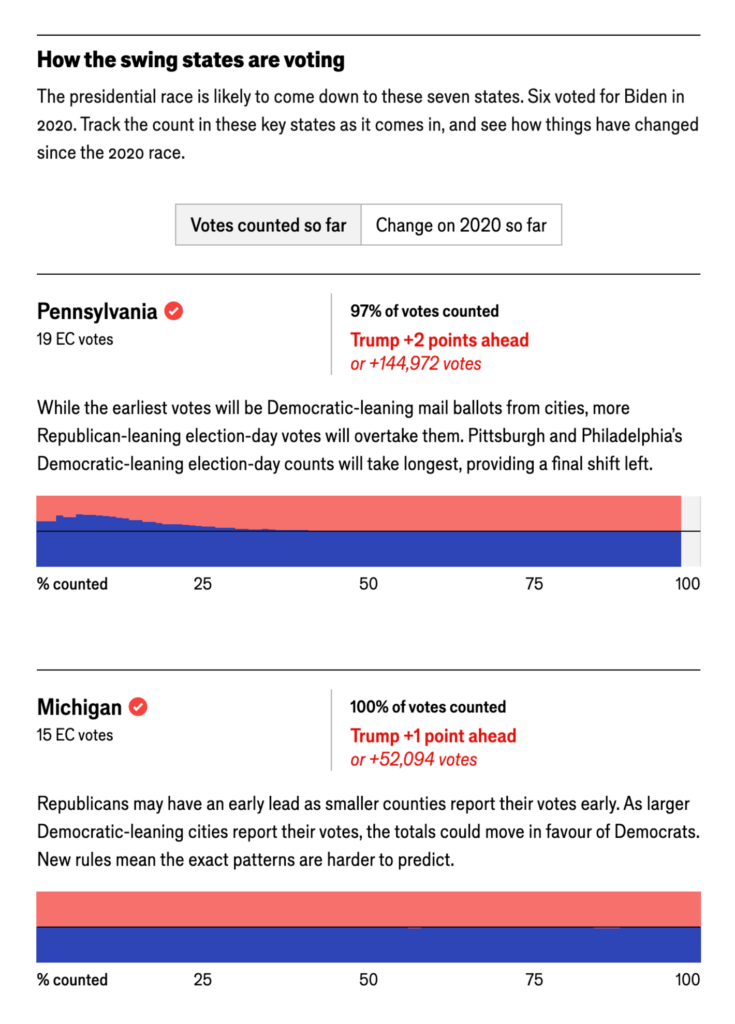
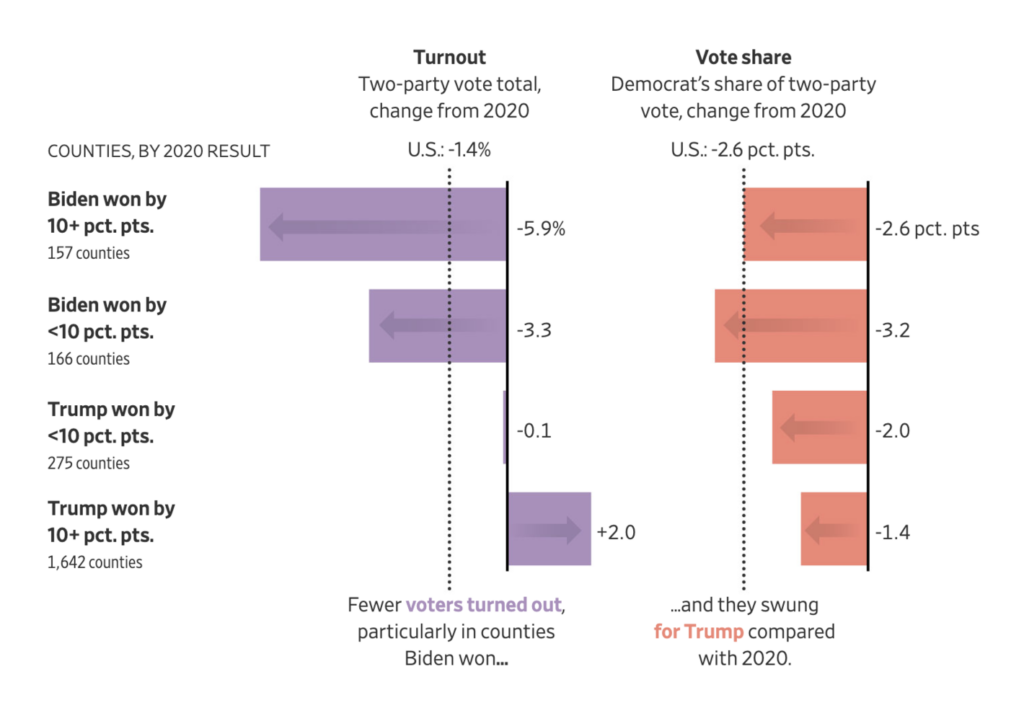
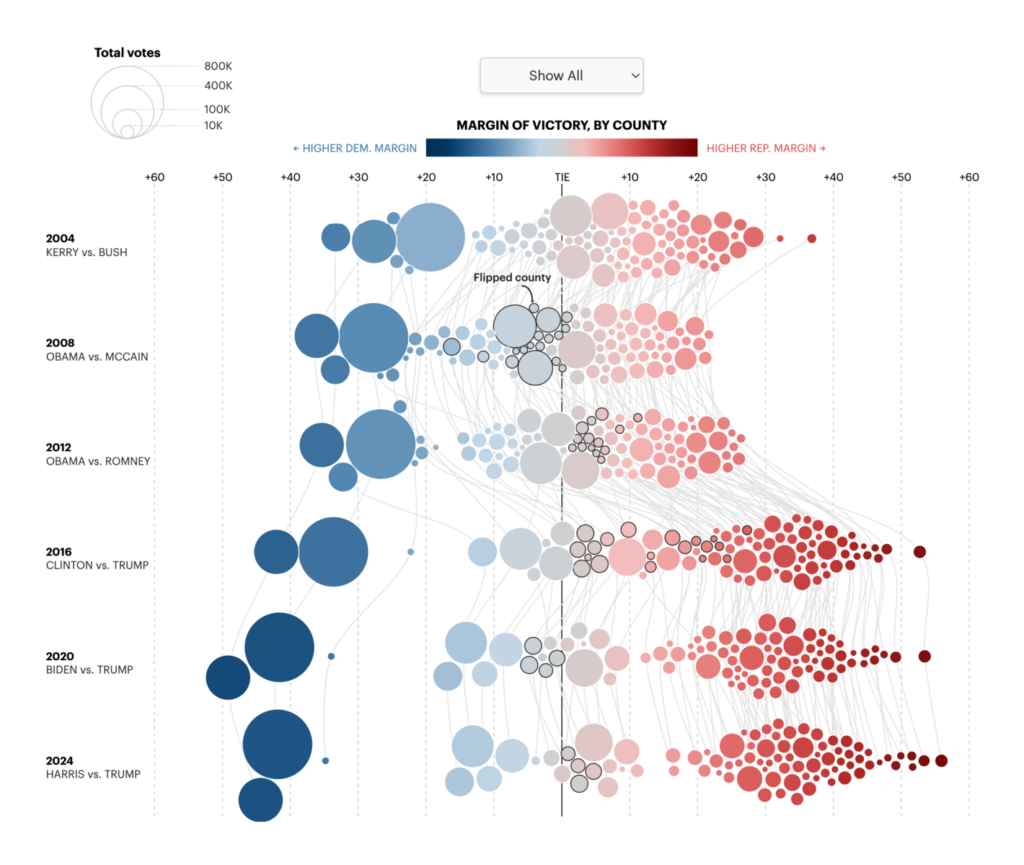
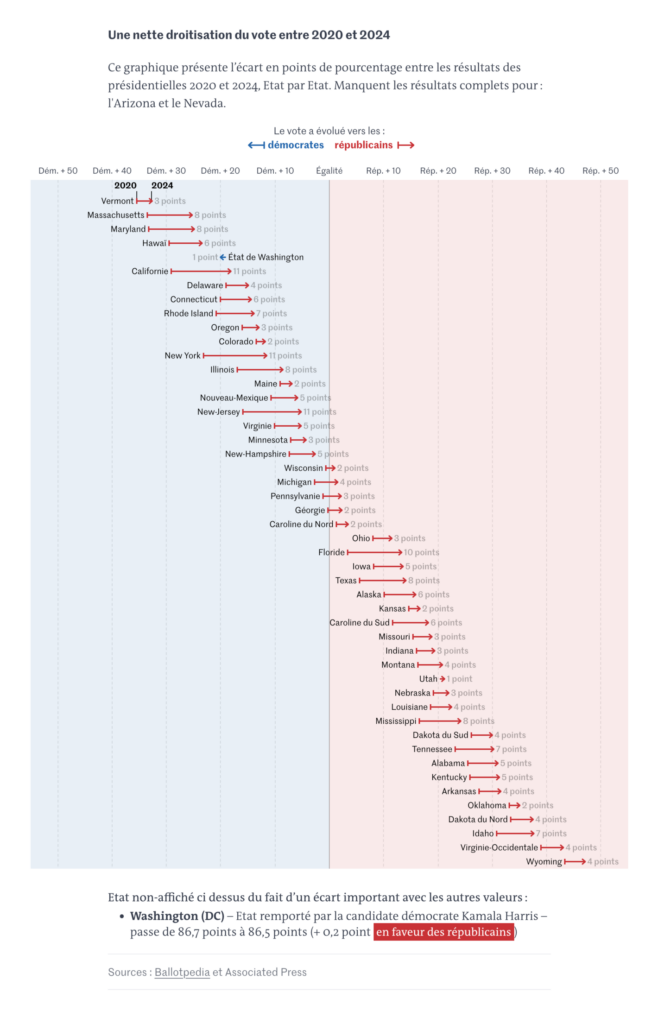
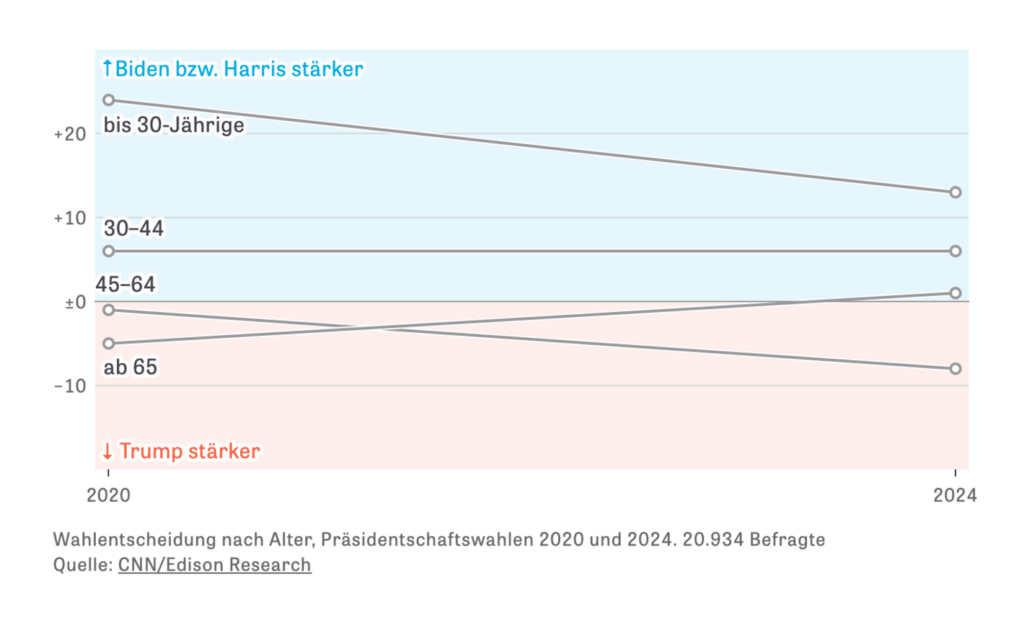
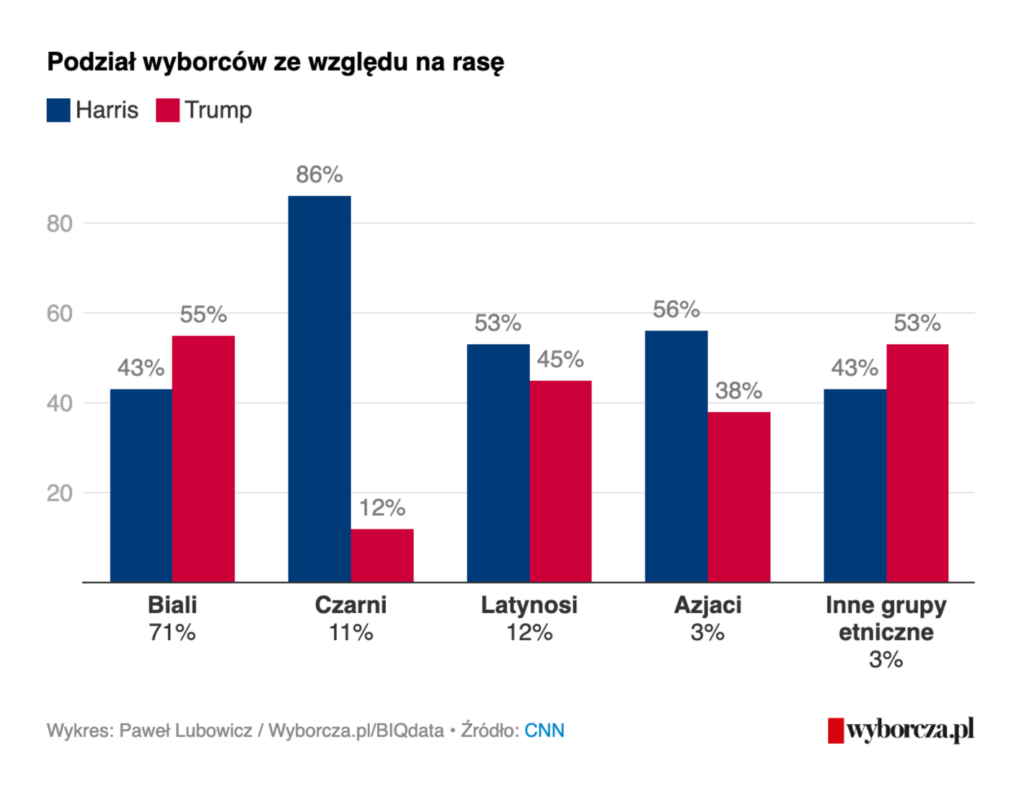
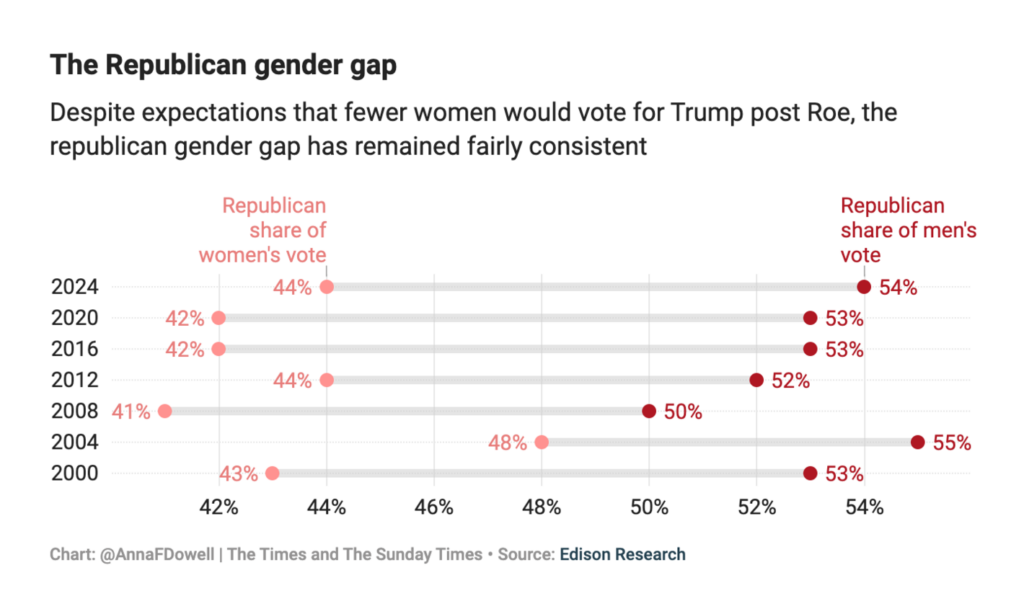
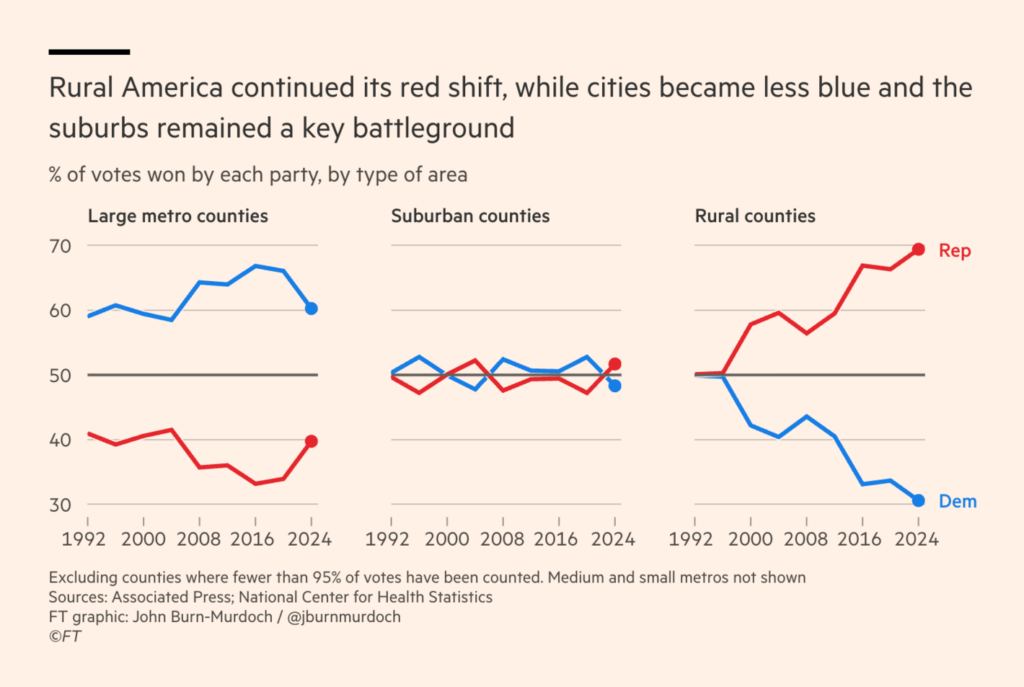
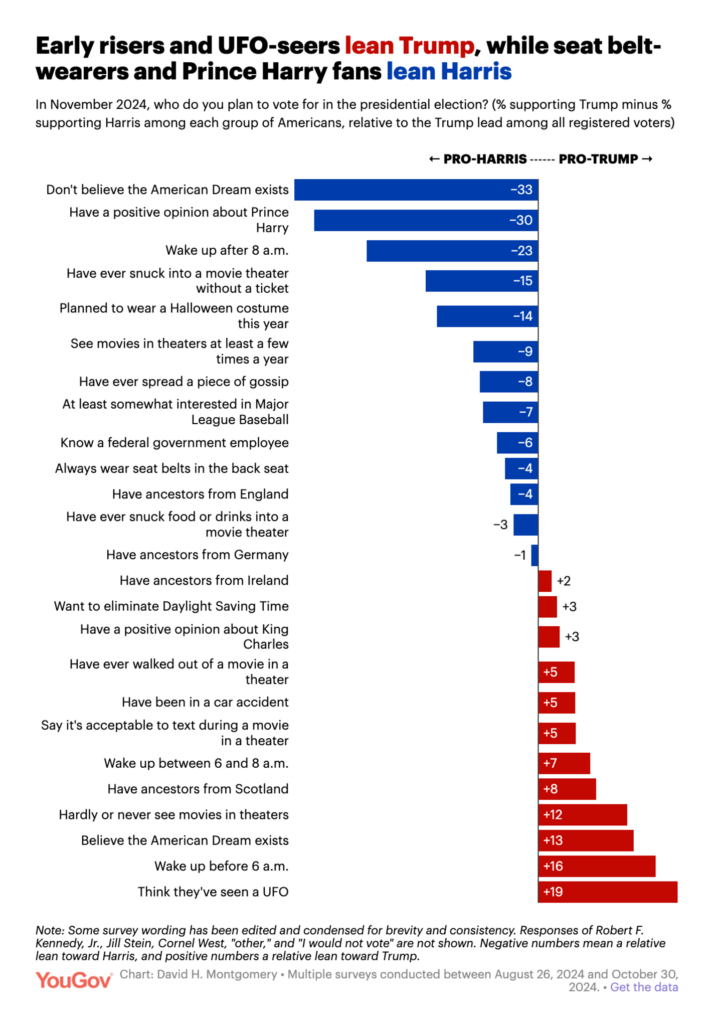
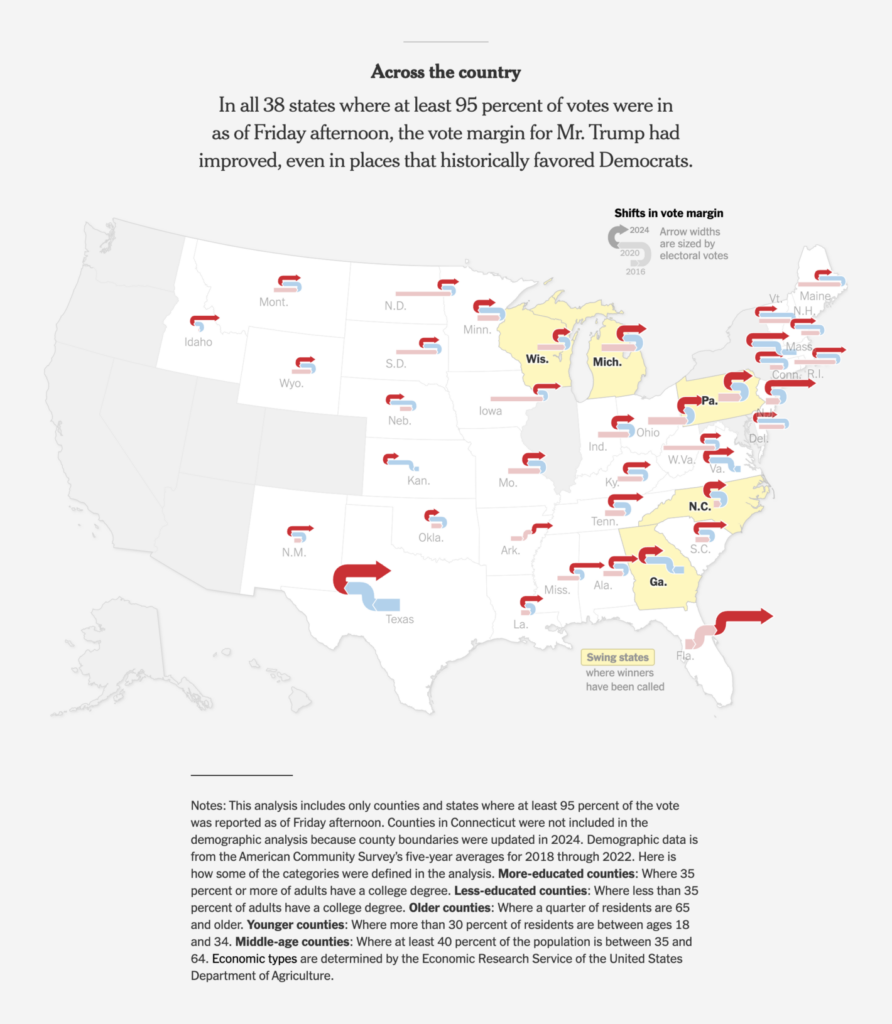
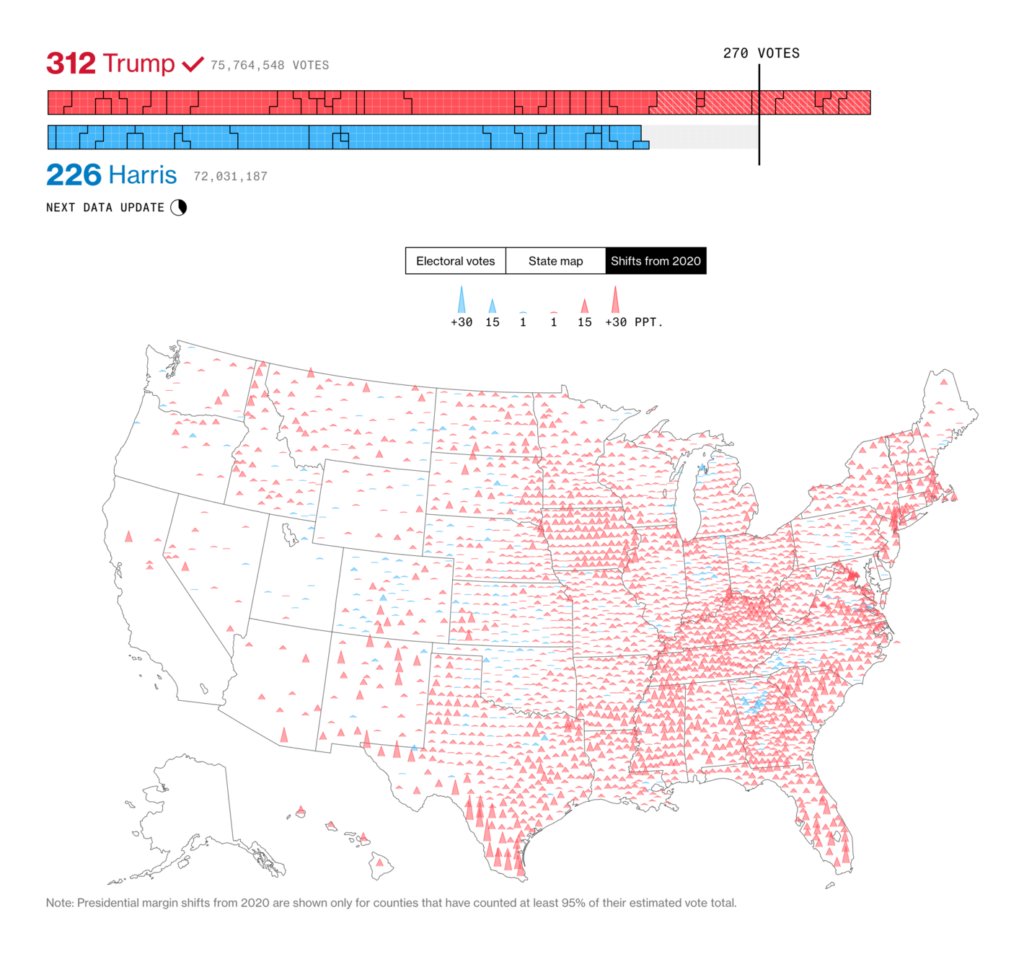
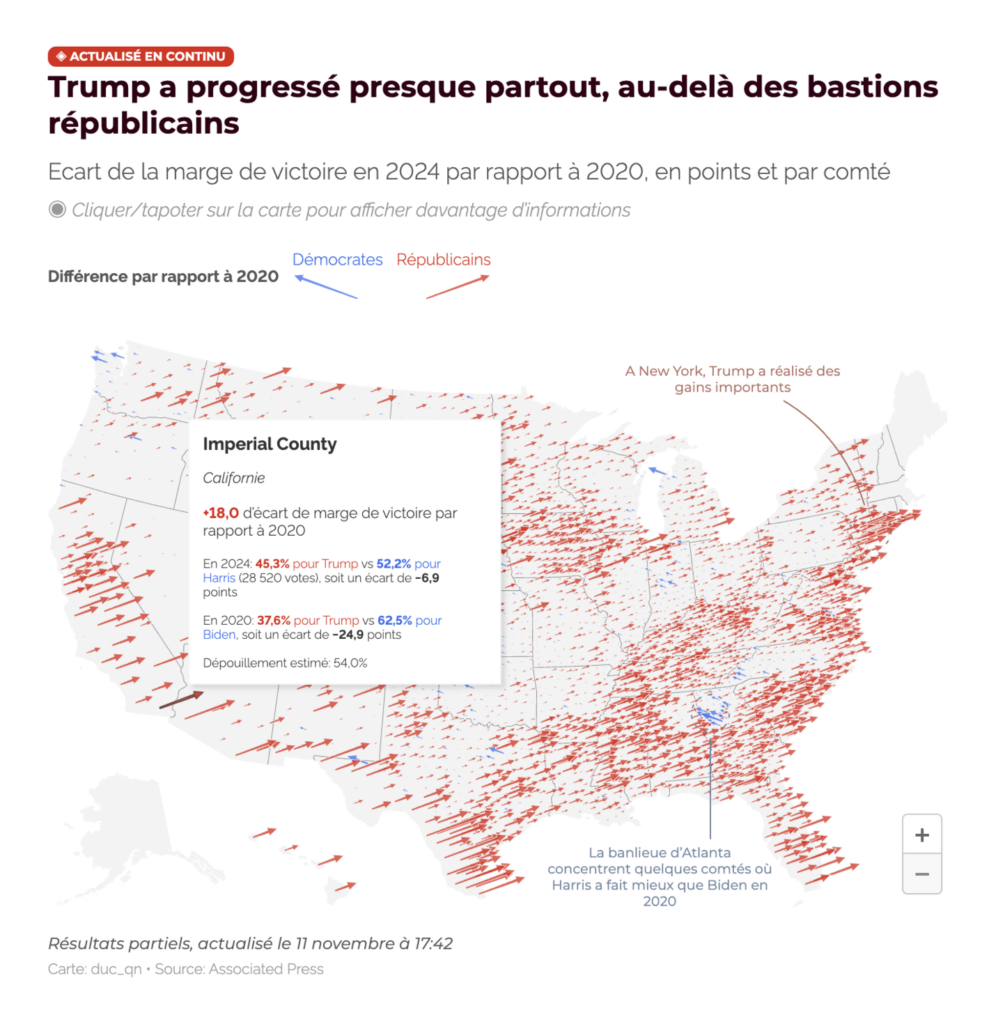
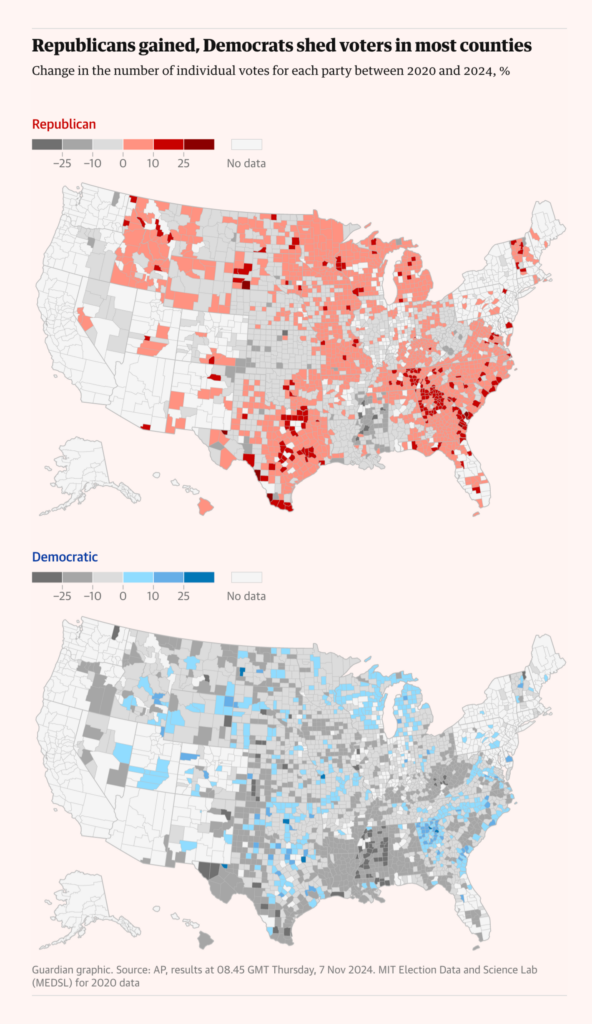
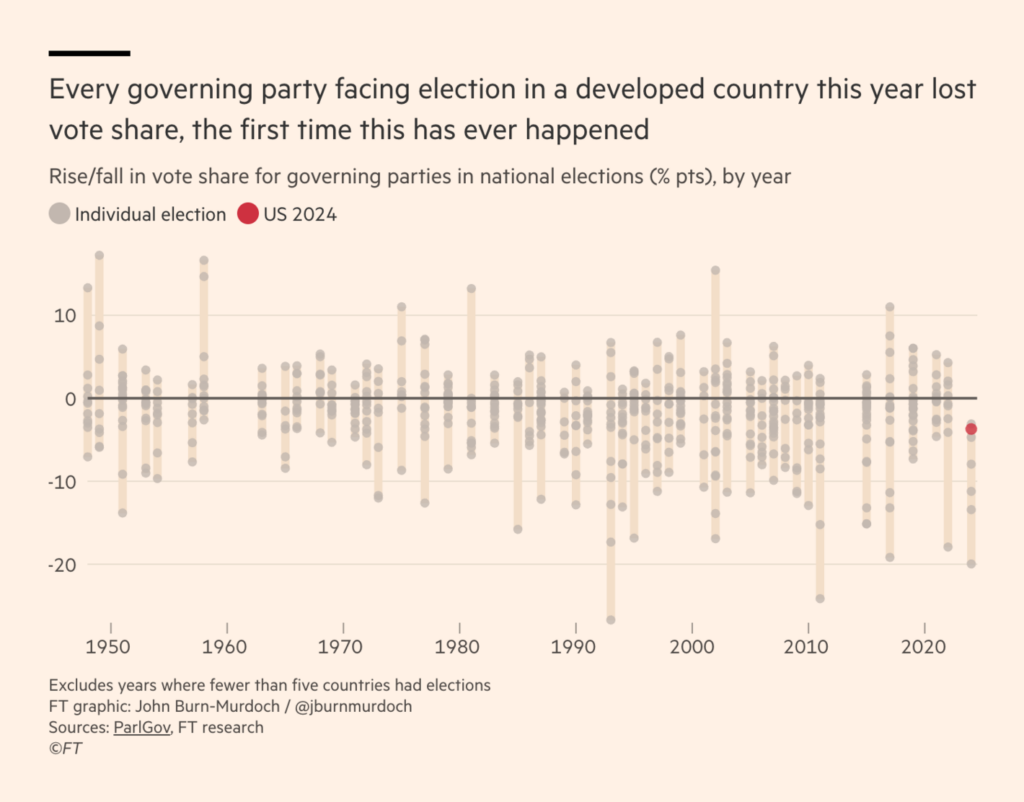
Let’s face it — this Dispatch is going to be packed with visualizations in blue and red. (If you’re interested in even more U.S election trackers, my colleague Lisa has put together a long list!)
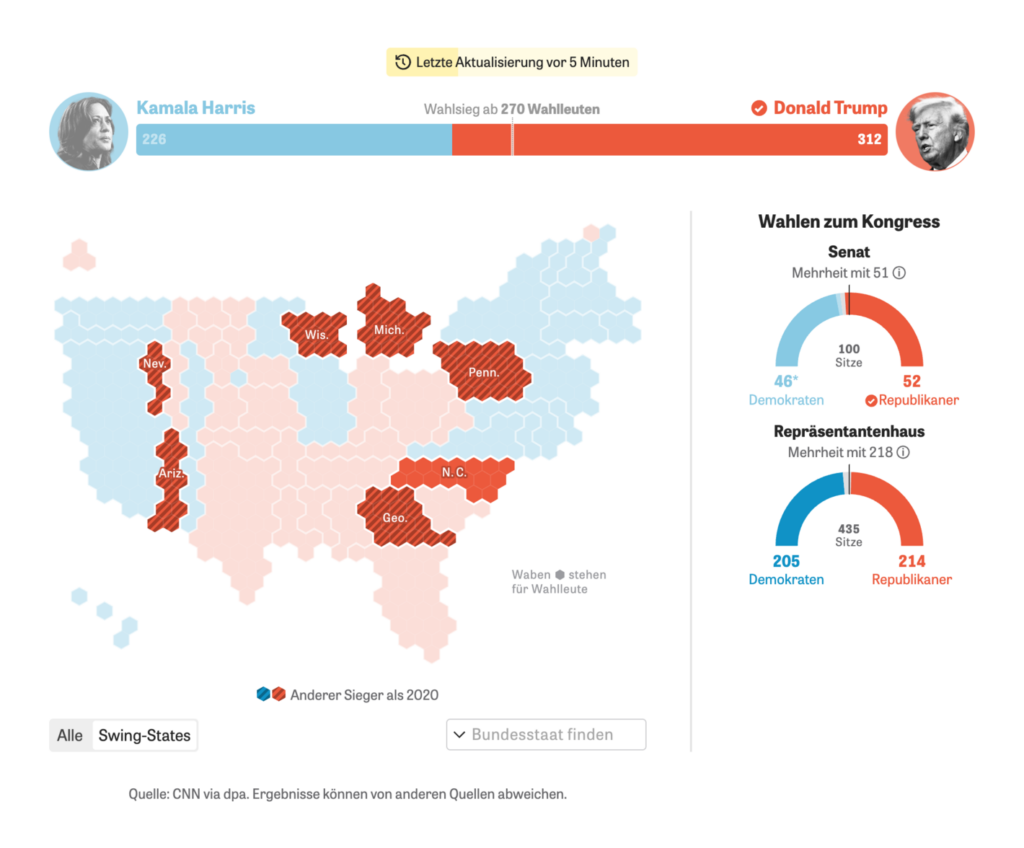
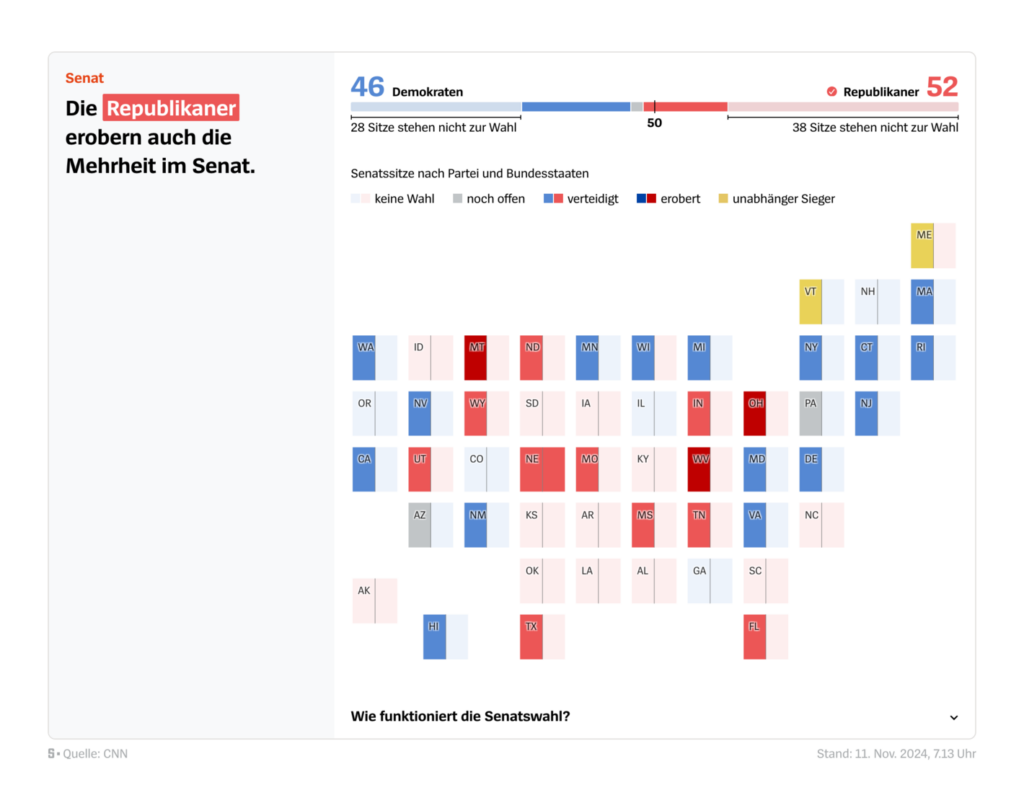
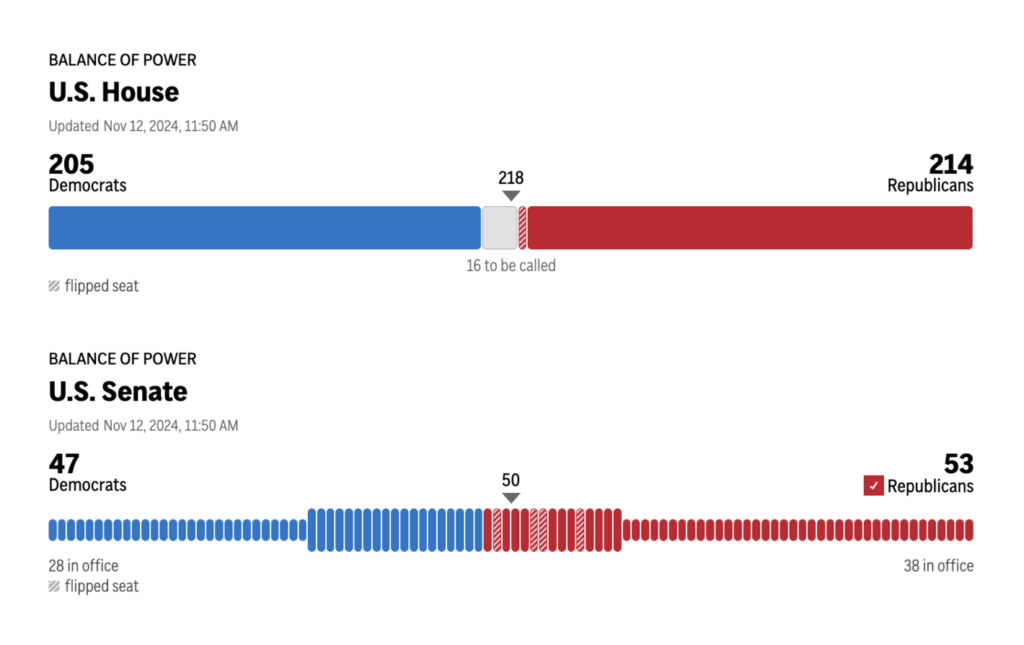
Of course, the presidential race wasn’t last week’s only U.S. election! On November 5, all 435 Congressionalseats, as well as 35 of the 100 senators, were also up for grabs:
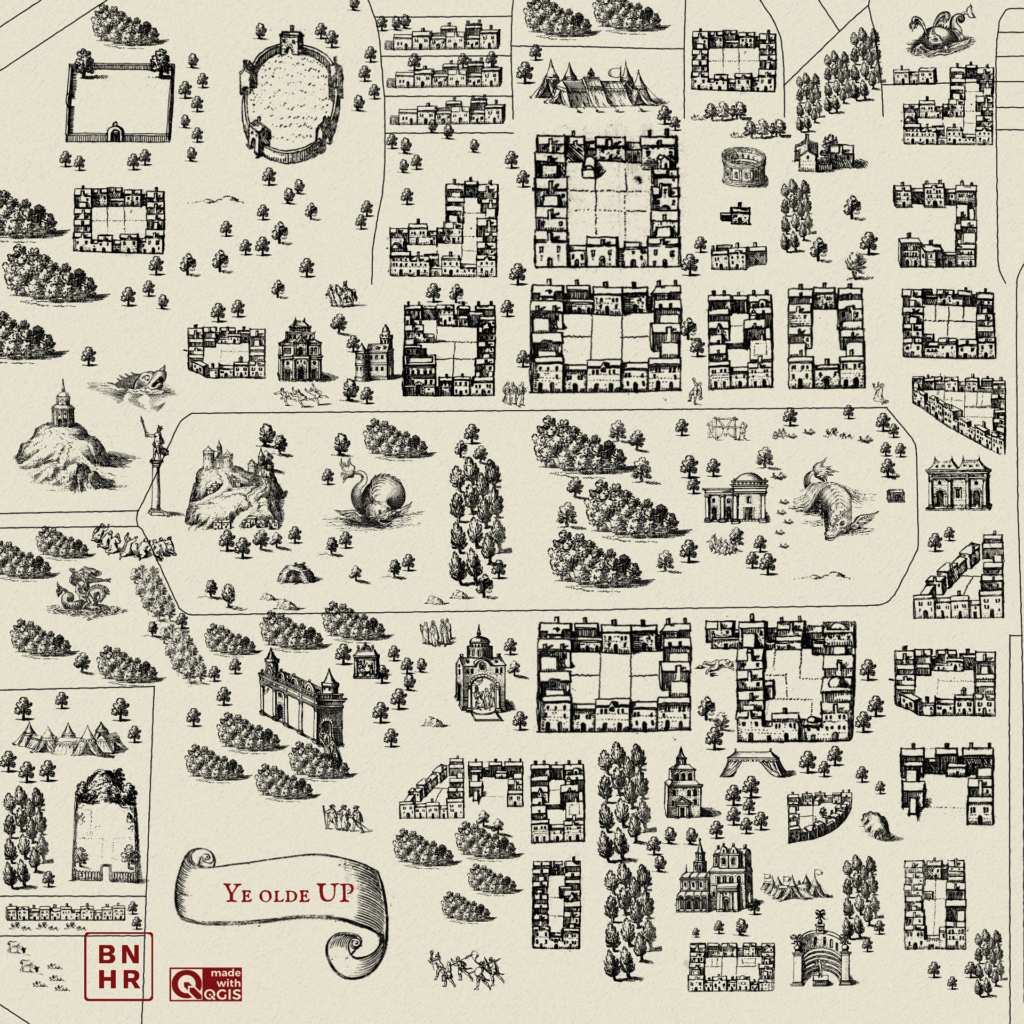
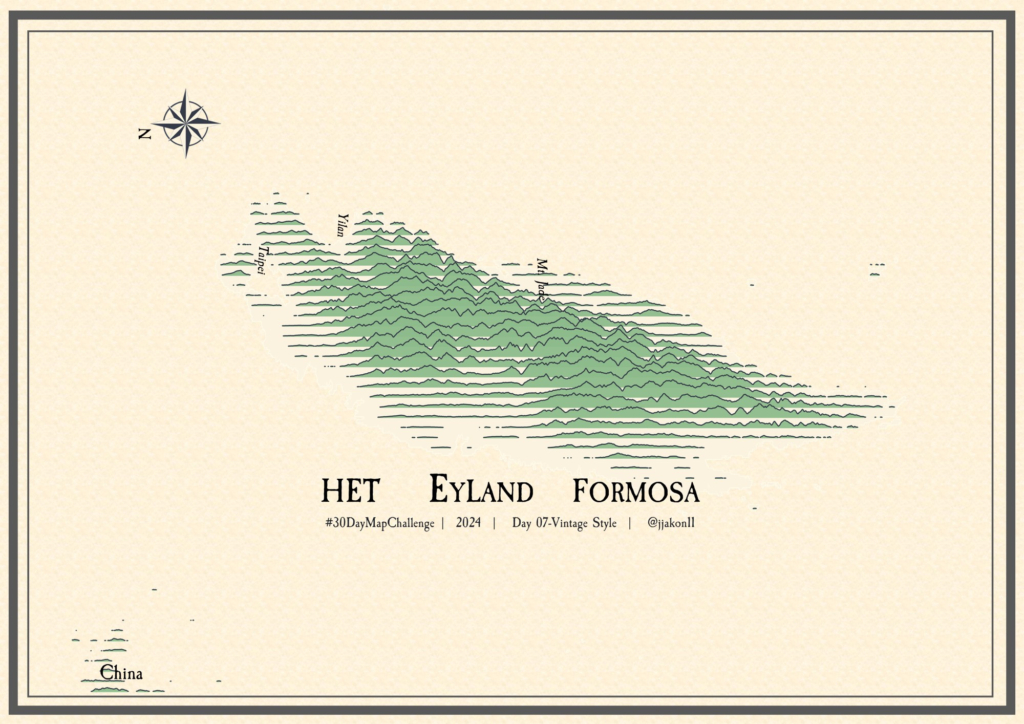
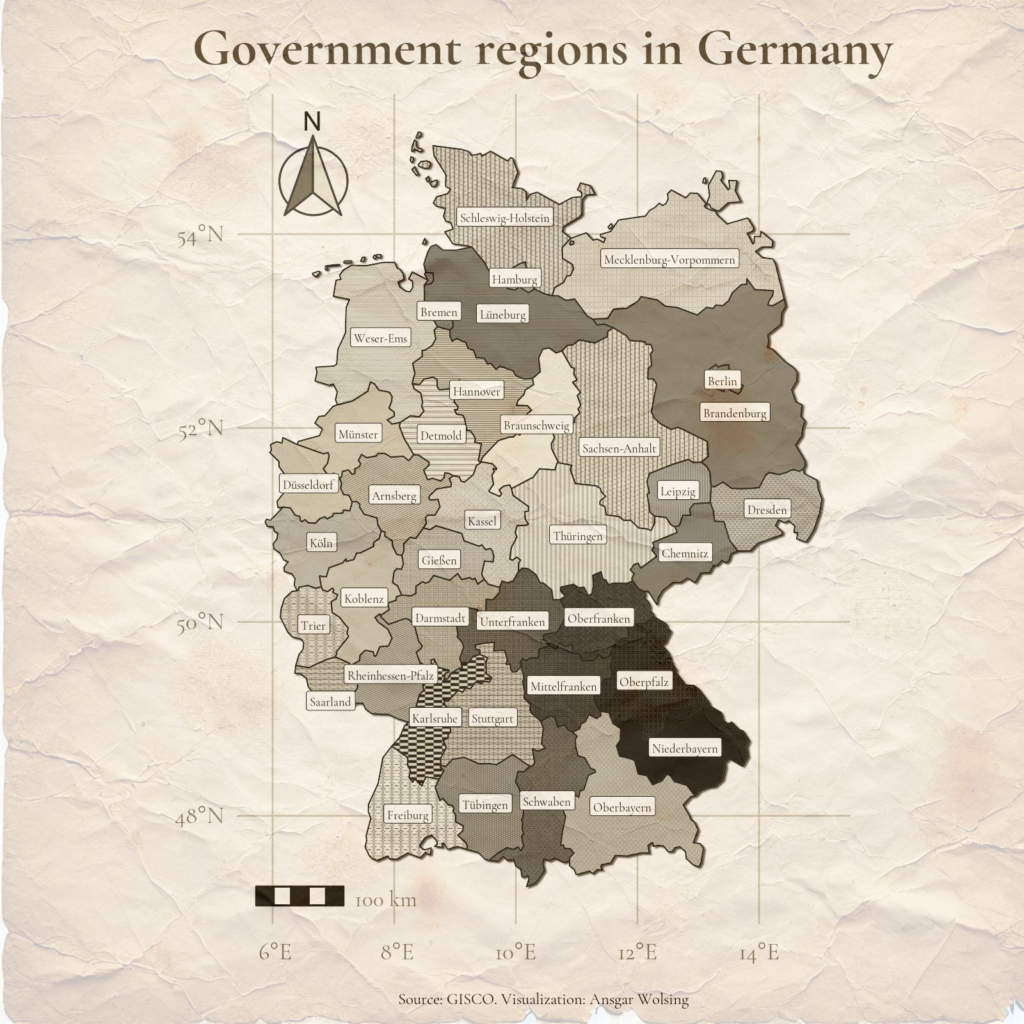
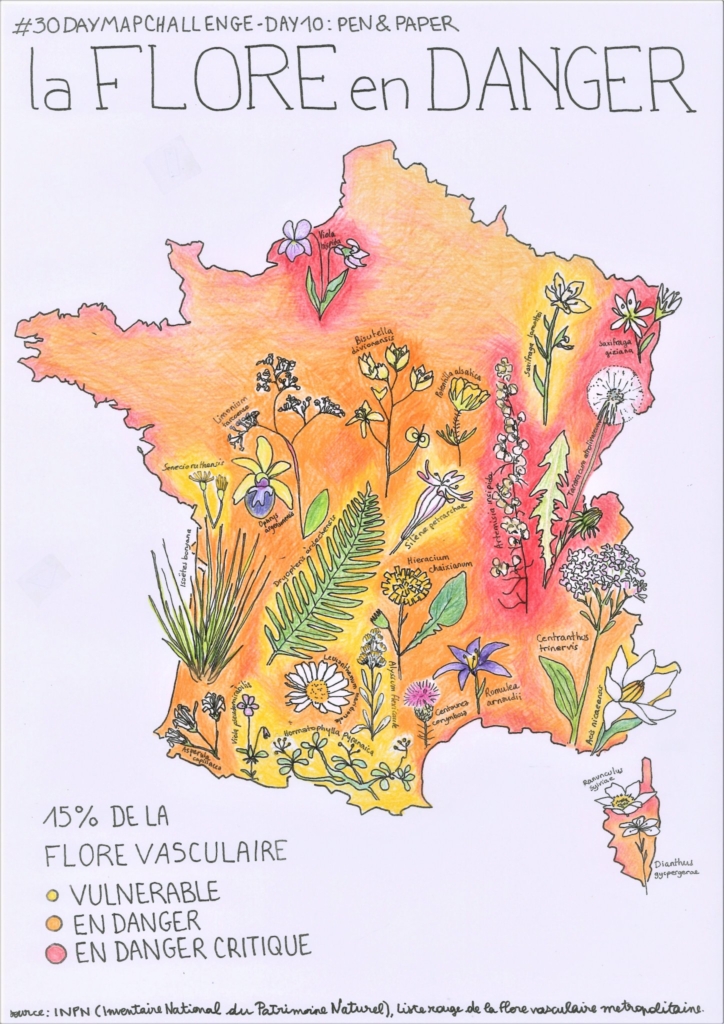
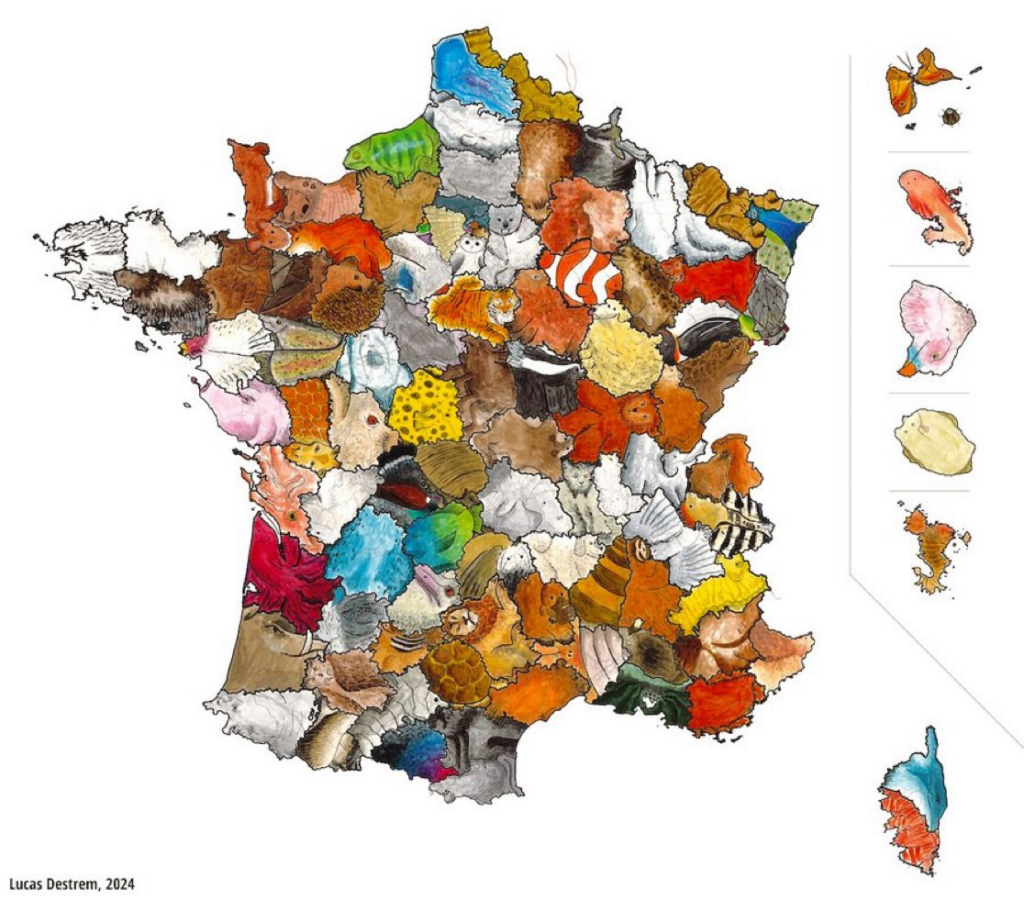
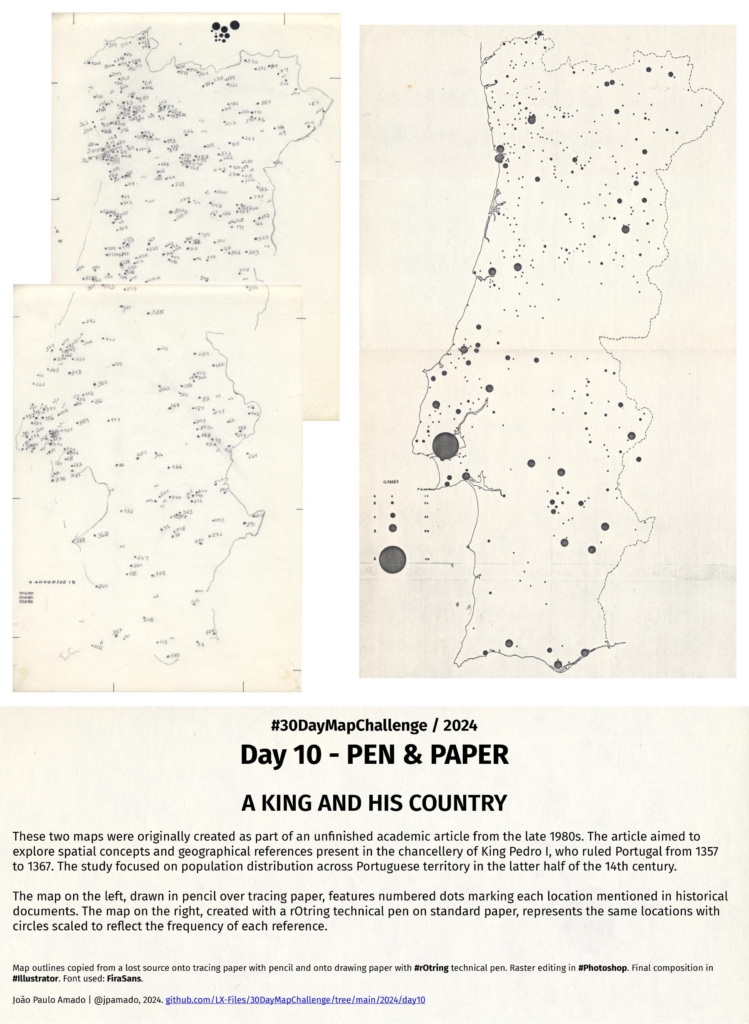
Phew, we’re done! Cut to the #30DayMapChallenge: The past week we especially enjoyed the categories “vintage” and “hand-drawn”:
BNHR.XYZ: “[…] A (very maximalist) map of the University of the Philippines Diliman in vintage 16th/17th century European cartographic style (complete with some out-of-place sea monsters haha). DATA > UPD data […], ” November 9 (Mastodon)Chen-Chia Ku, Ph.D: “#Day7_VintageStyle, HET EYLAND FORMOSA. Today, I used a digital elevation model (DEM) to create a 2024 rendition inspired by Francois Valentijn’s 1726 map of Formosa. Using modern data and techniques, I aimed to reimagine the map, not replicate it exactly,” November 8 (Bluesky)Ansgar Wolsing: “A vintage-styled map of the government regions in Germany (NUTS-2). This map combines a #ggplot2 map with an old paper texture created with DALL-E using the {magick} package,” November 7 (Bluesky)IGN France: “[…] 15% des espèces indigènes de la Flore vasculaire sont menacées. Retrouvez sur cette carte certaines des espèces endémiques vulnérables ou en danger critique.” [15% of native species of vascular flora are under threat. Find some of the vulnerable or critically endangered endemic species on this map.] November 10 (Tweet) Lucas Destrem: “De retour pour ce jour 10 du #30DayMapChallenge, Stylo et Papier… et surtout Acrylique. Voici l’assemblage tout récent de mes ZooDépartements : à chaque département, une forme animale associée,” [Back for day 10 of the #30DayMapChallenge, Pen and Paper… and especially Acrylic. Here’s the latest assembly of my ZooDépartements: each département has an associated animal shape] November 10 (Mastodon)jpamado: “A KING AND HIS COUNTRY […],” November 10 (Mastodon)
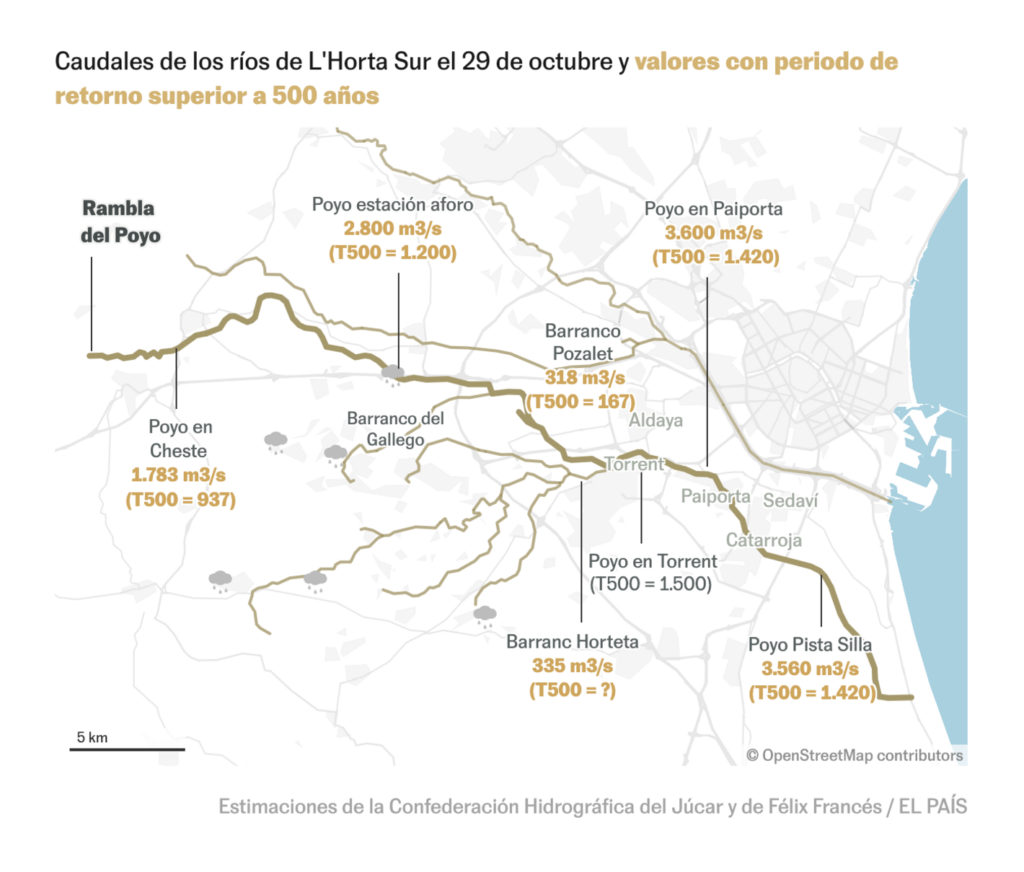
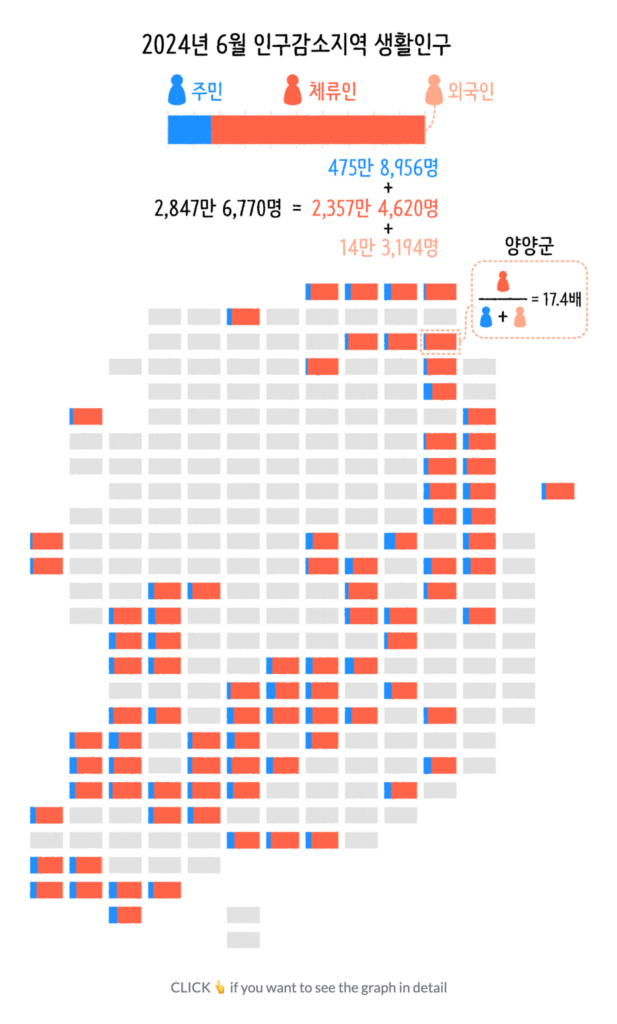
Other maps covered floods in Valencia and South Korea’s concept of “resident population“:
It’s time to take a break from maps. How about creative visualizations of animals?:
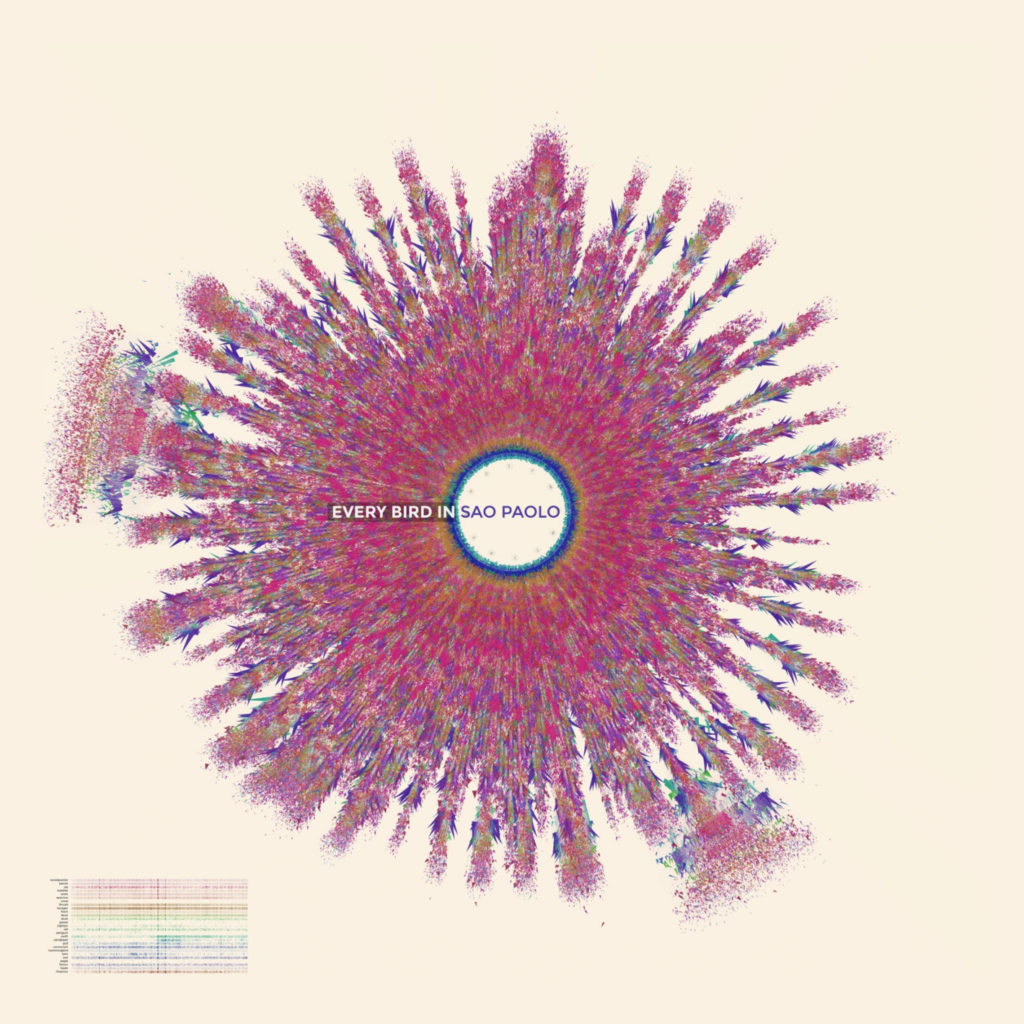
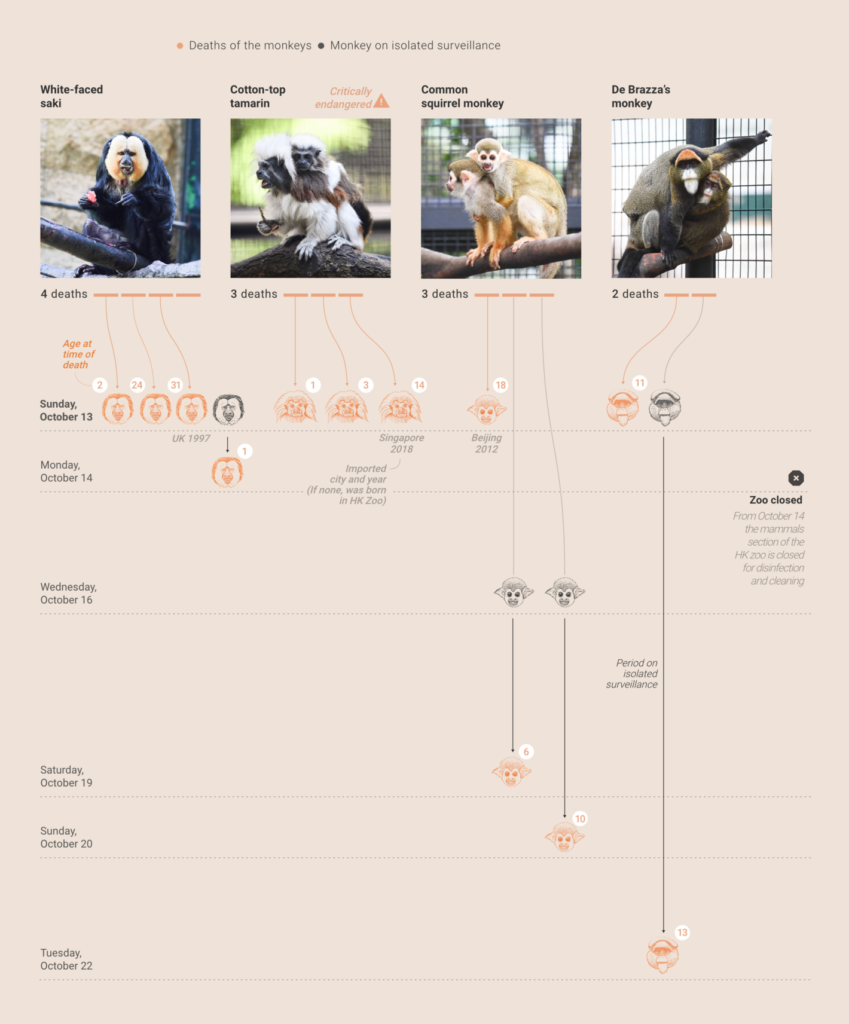
Jer Thorp: “Over the last difficult, grief-filled month I’ve found some solace in making. I’m happy to finally be able to share something with you: Every Bird is a series of artworks celebrating the astounding diversity of the world’s birds and the tenacity of its birders,” November 10 (Bluesky)South China Morning Post: Hong Kong zoo monkey deaths: here’s what we know, November 8
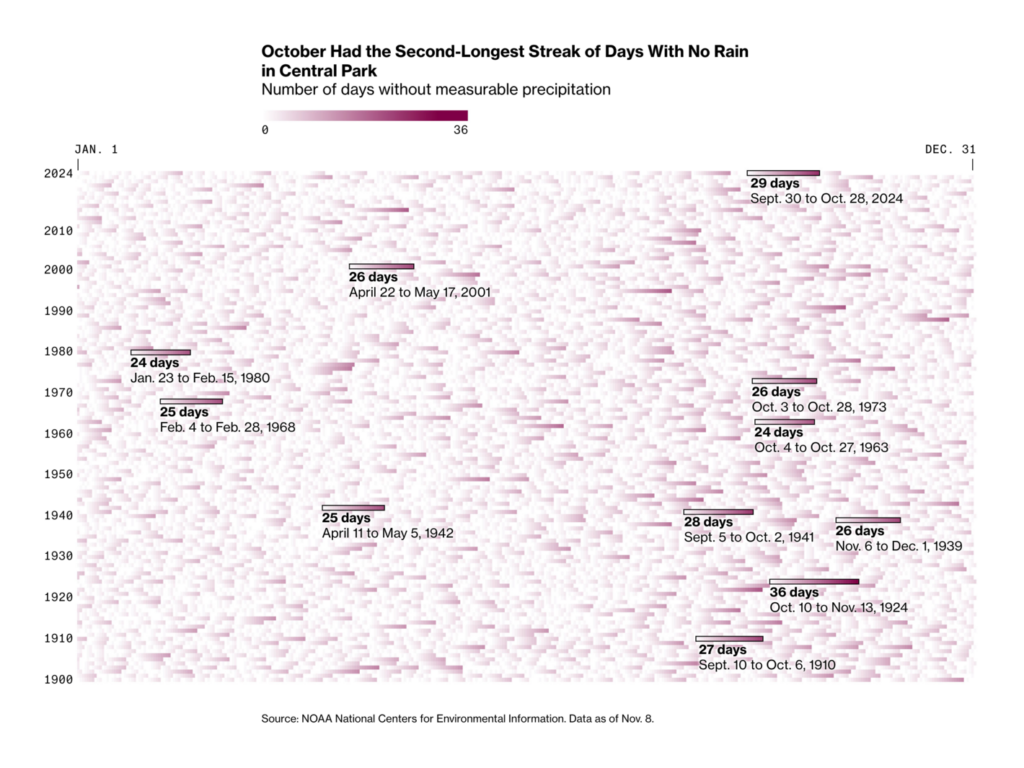
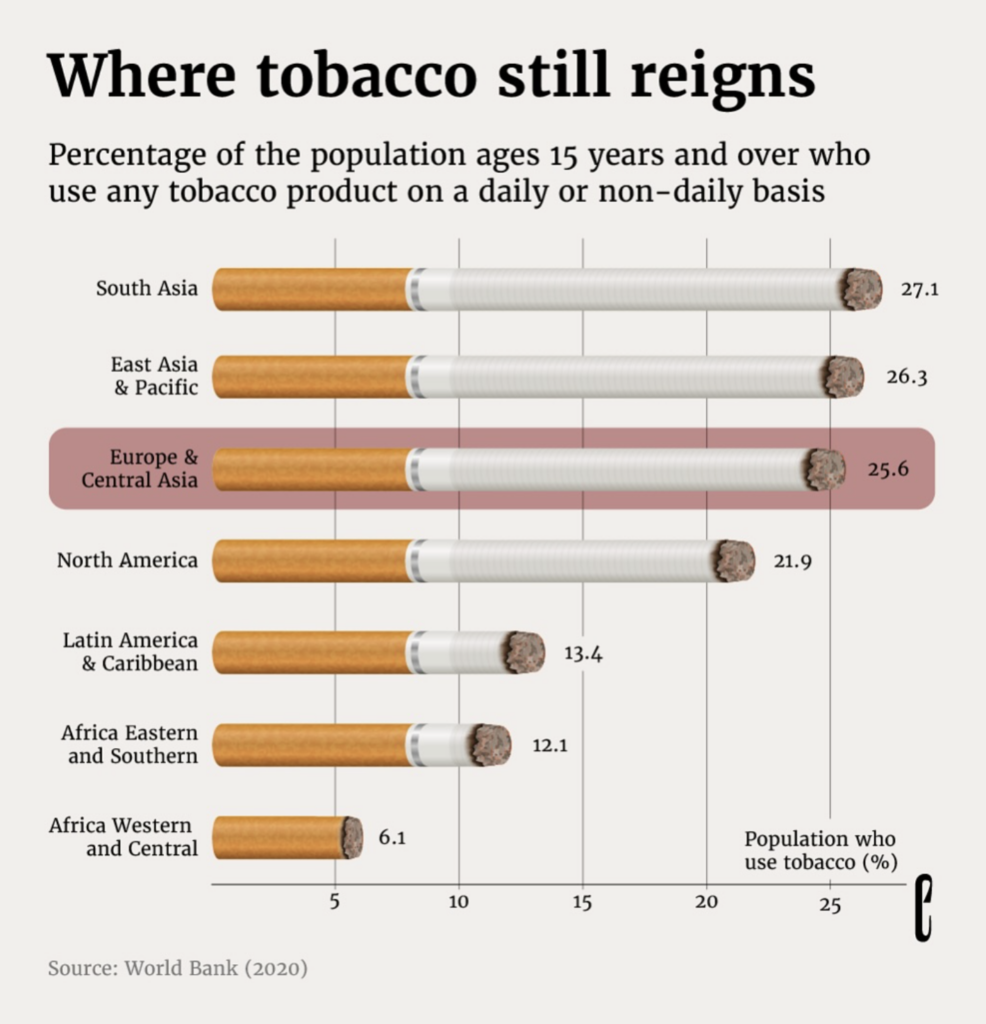
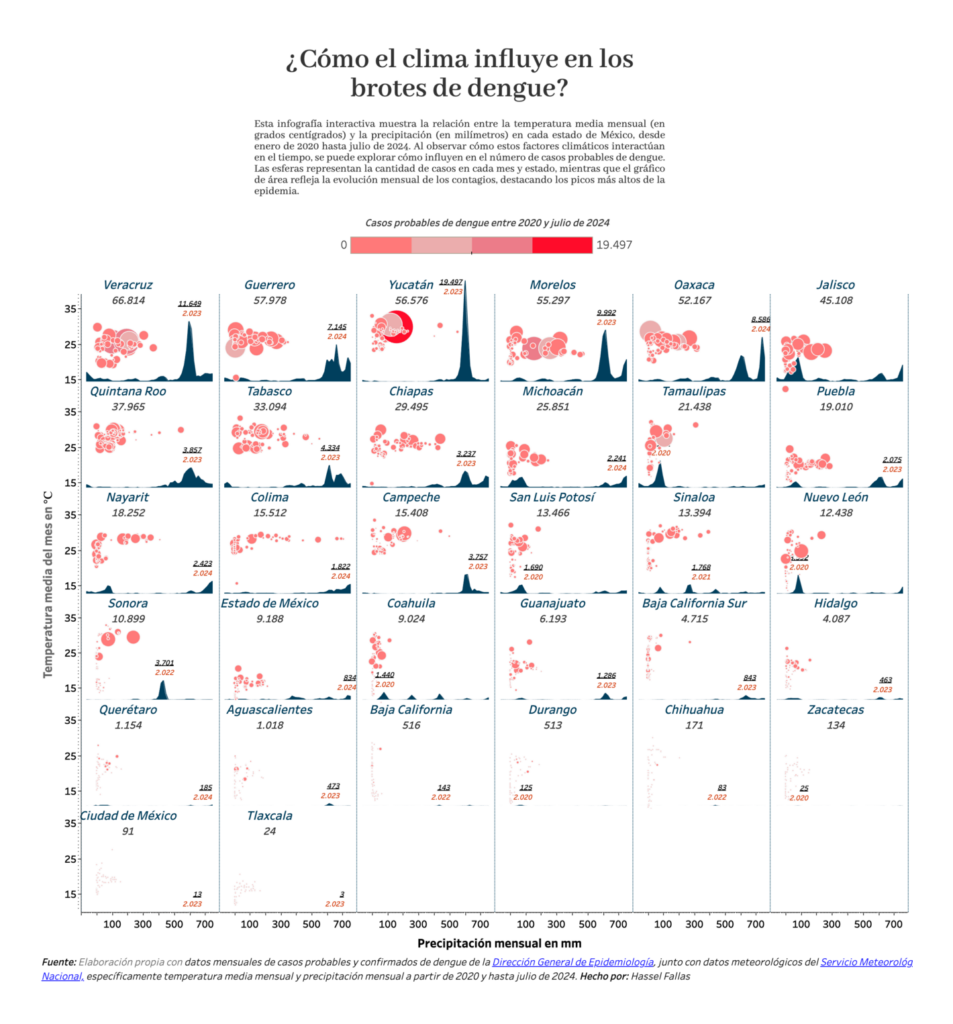
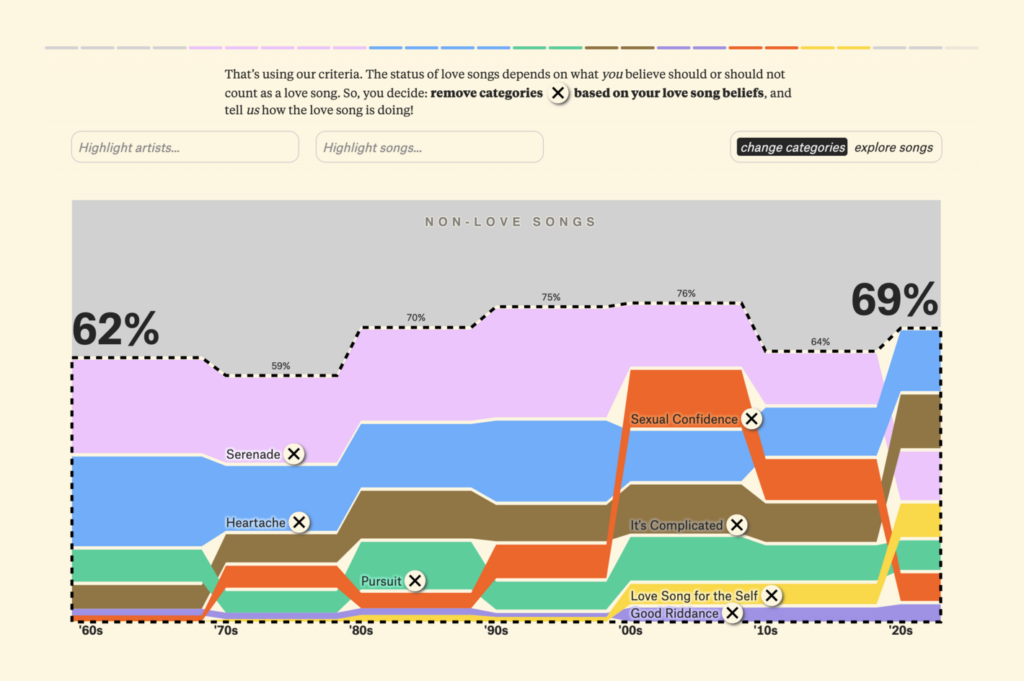
Finally, an extremely dry New York City, global tobacco consumption, dengue fever in Mexico, and the evergreen question, “Is the love song dead?”:
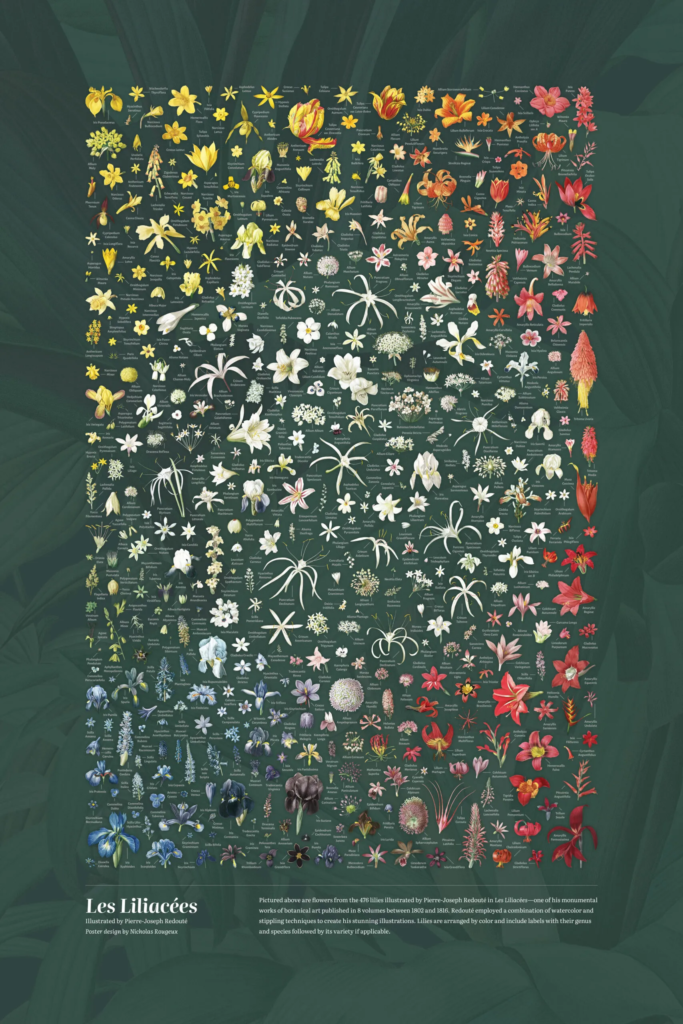
Nicholas Rougeux: Lilies & Roses. Restored illustrations of Pierre-Joseph Redouté, November 5 (Website, Making-of)Marco Cortella: “La miglior data visualization sulle elezioni USA 2024? […]” [Best data visualization on the 2024 U.S. election?], November 6 (LinkedIn)
Help us make this dispatch better! We’d love to hear which newsletters, blogs, or social media accounts we need to follow to learn about interesting projects, especially from less-covered parts of the world (Asia, South America, Africa). Write us at hello@datawrapper.de or leave a comment below.
(she/her) is a working student on Datawrapper’s Communications team. She creates the Data Vis Dispatch to keep data visualization enthusiasts up to date on exciting new projects. When she’s not working, she studies interface design, and when she’s not studying, she’s planning a festival stage or soldering light installations. Vivien lives in Potsdam.


Comments