We want to enable everyone to create beautiful charts, maps, and tables. New to data visualization? Or do you have specific questions about us? You'll find all the answers here.
The best of last week’s big and small data visualizations
Rose Mintzer-Sweeney
Welcome back to the 170th edition of the Data Vis Dispatch! Every week, we publish a collection of the best small and large data visualizations we find, especially from news organizations — to celebrate data journalism, data visualization, simple charts, elaborate maps, and their creators.
Recurring topics this week include elections, the lack of elections, and suspicious events at sea.
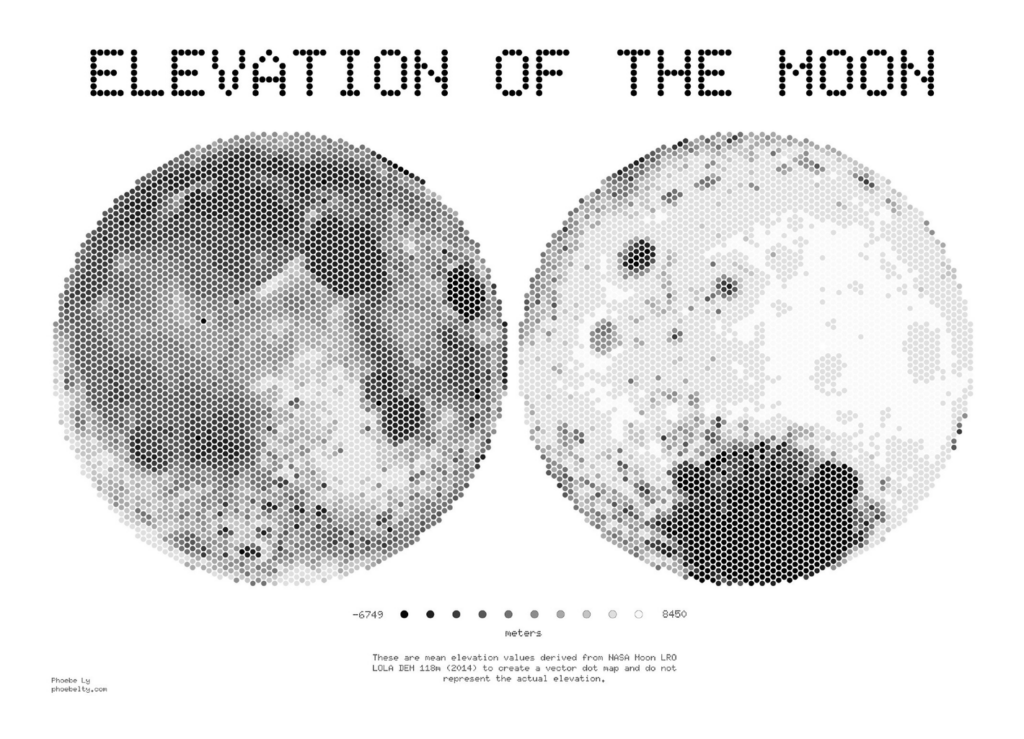
This week’s Dispatch is taking us to the moon!
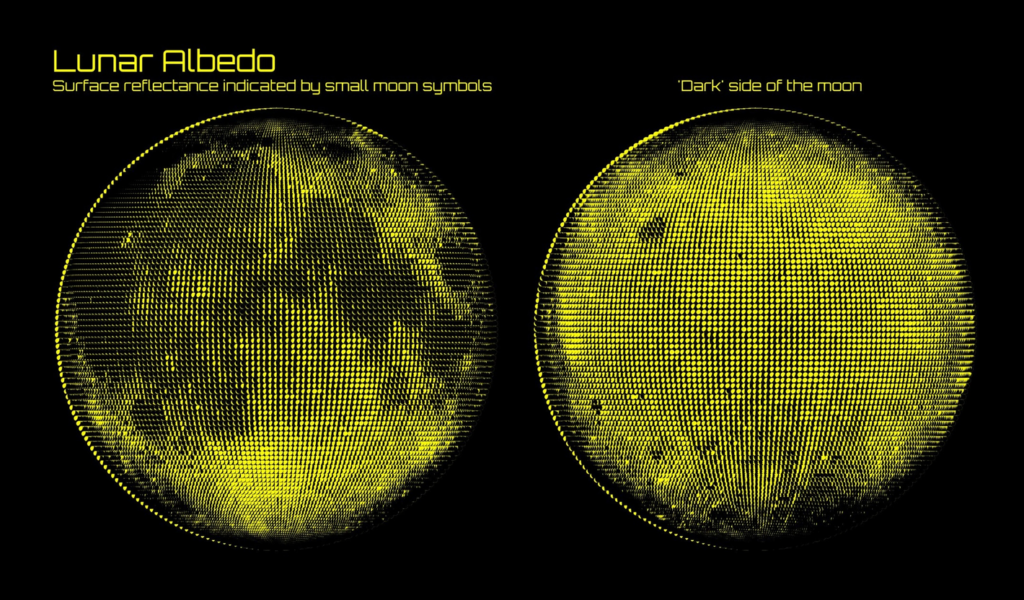
Phoebe Ly: “Elevation of the Moon with only circular shapes, even the typography,” November 24 (Bluesky)Jo Wood: “I thought I’d make life difficult for myself with this one by being strict about only 2 colours. No grey scales; no 2 colours + background colour. Just 2. Halftone dots made up of mini moons to map a big moon,” November 22 (Bluesky)
And more great contributions to the #30daymapchallenge:
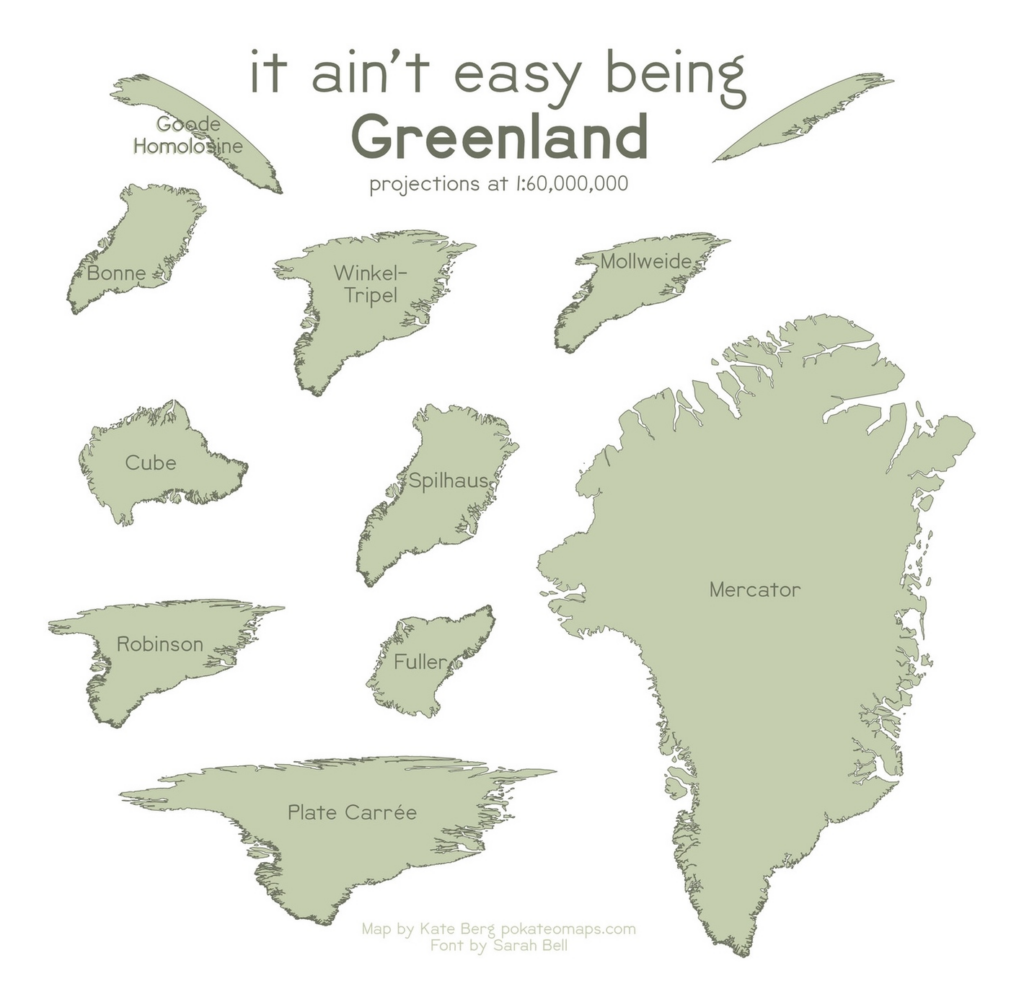
Mapbox: “Today’s highlight is the ‘Haring’ Map, a stylistic tribute to the vibrant, energetic styles of pop artist Keith Haring, created by Mapbox map designer Stephen Kennedy. This stylish map showcases the power of typography in visual storytelling,” November 19 (Tweet, Map)koriander: “Every Lindenstraße in Germany. The image includes all ways of OpenStreetMap within Germany that have the tag name = Lindenstraße. As of today, they number 9,259 […],” November 23 (Mastodon)Kate Berg: “Did You Know That It Ain’t Easy Being Greenland?” November 26 (Bluesky)Koen Van den Eeckhout: “Sorry officer, I had an irresistible urge… to make this visual. I’m not participating in the #30DayMapChallenge this year, but maybe I’ll submit it as my entry for day 7: vintage style!” November 22 (Bluesky)Atlas Guo: “Sharing this 3D rendered graphic of #LEGO #cartogram of #USPresidentialElection 2024, with two photos of the physical map,” November 19 (Bluesky)
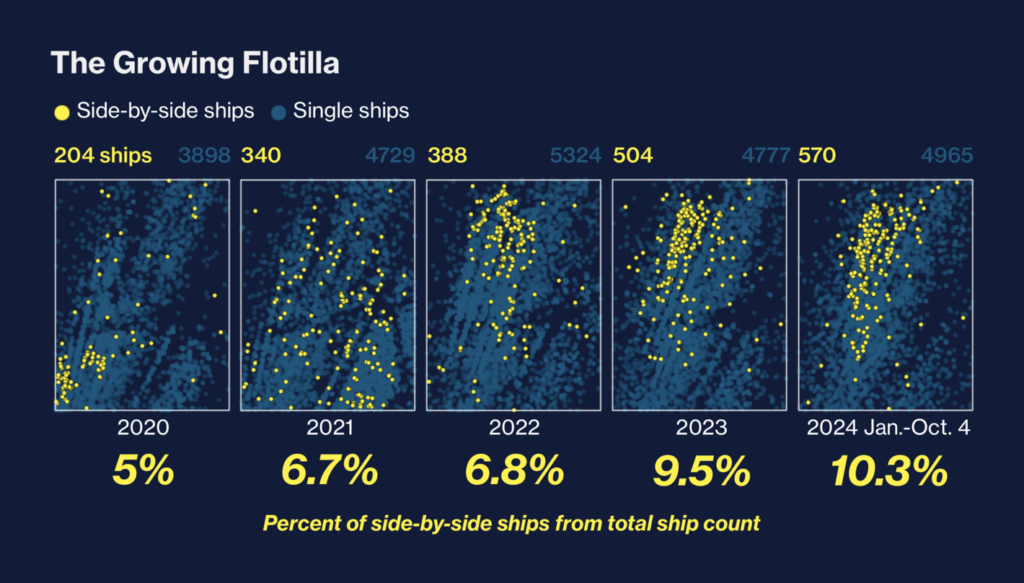
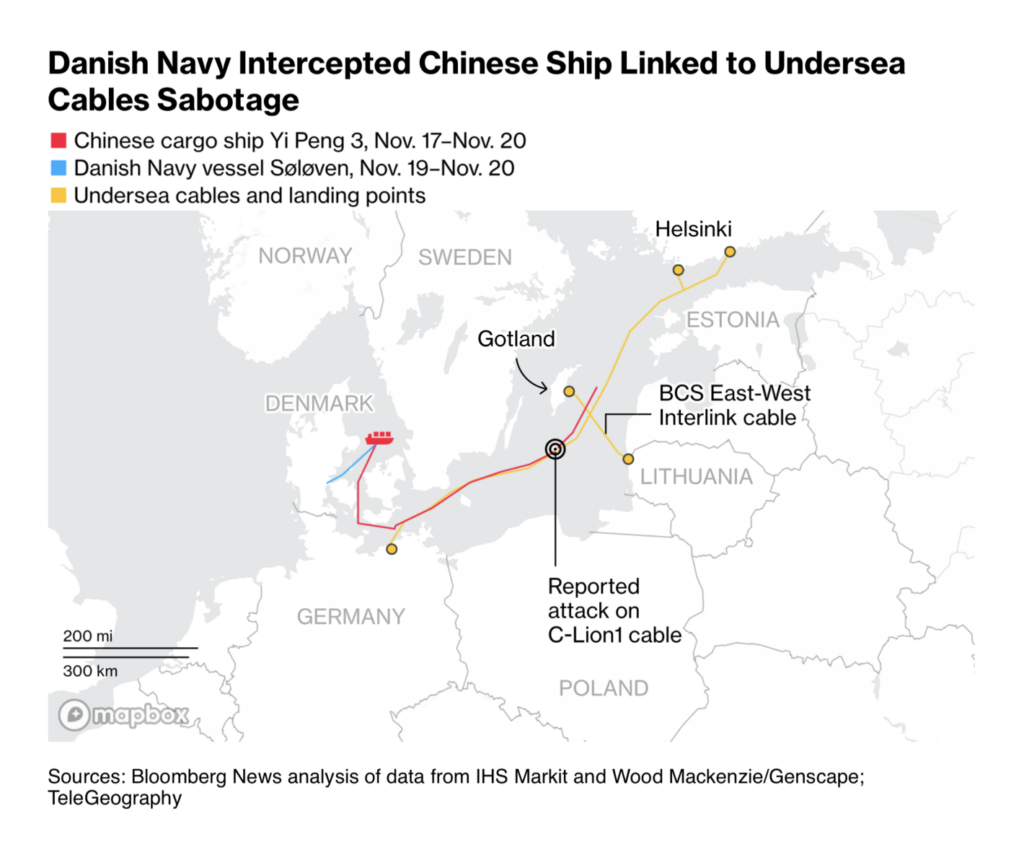
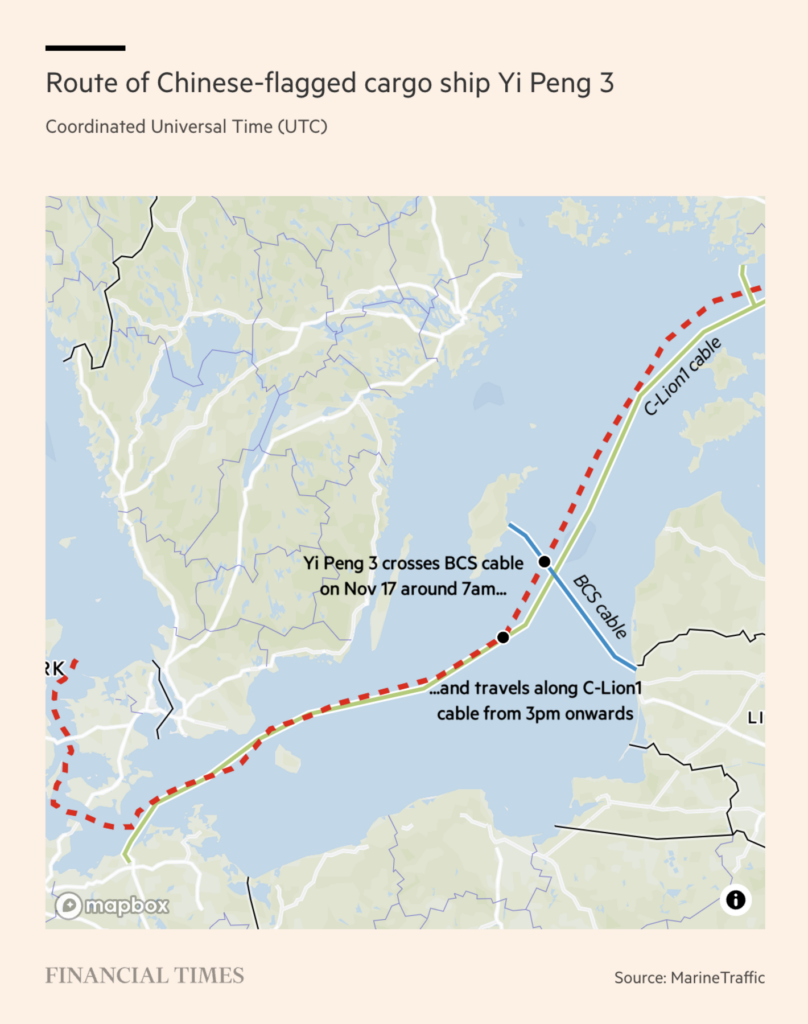
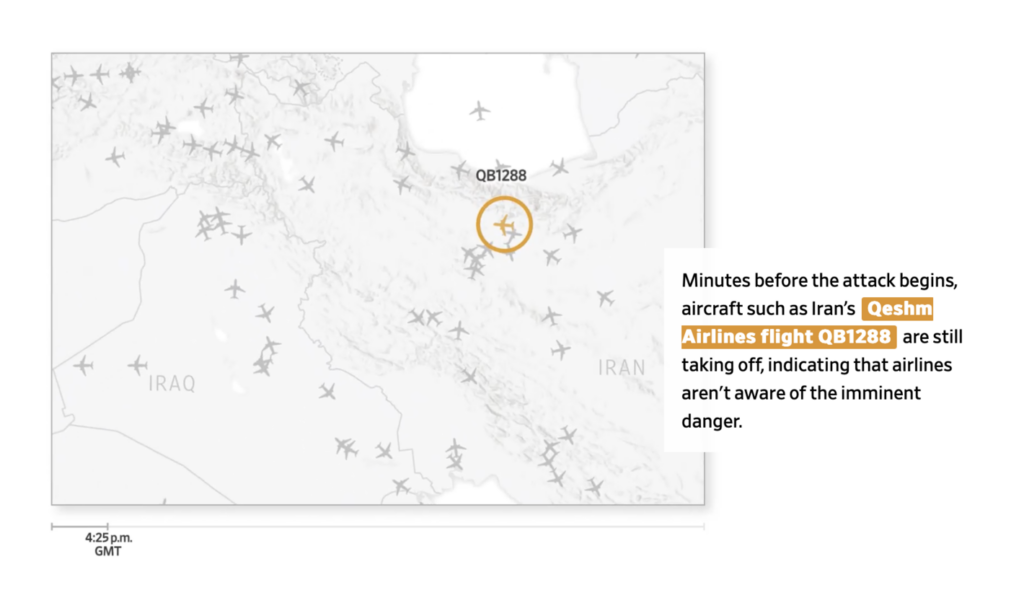
These maps in particular showed fishy goings-on at sea:
Help us make this dispatch better! We’d love to hear which newsletters, blogs, or social media accounts we need to follow to learn about interesting projects, especially from less-covered parts of the world (Asia, South America, Africa). Write us at hello@datawrapper.de or leave a comment below.
(she/her, @rosemintzers) is a data vis writer on Datawrapper's communications team. She likes words, numbers, pictures, and all possible combinations of the same. Rose lives in Berlin.


Comments