Data Vis Dispatch, October 10

The best of last week’s big and small data visualizations

Welcome back to the 113th edition of Data Vis Dispatch! Every week, we’ll be publishing a collection of the best small and large data visualizations we find, especially from news organizations — to celebrate data journalism, data visualization, simple charts, elaborate maps, and their creators.

Recurring topics this week include elections, rising costs around the world, and war between Israel and Hamas.

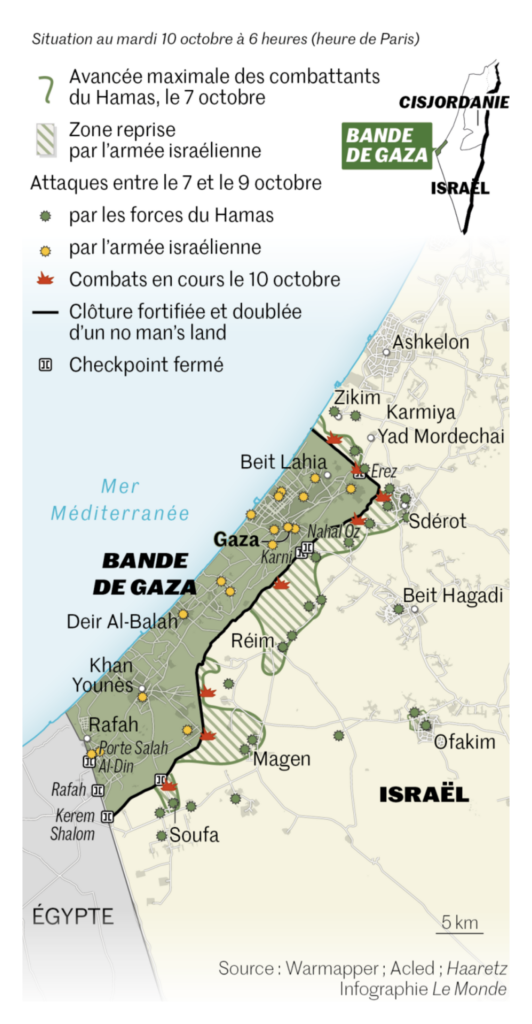
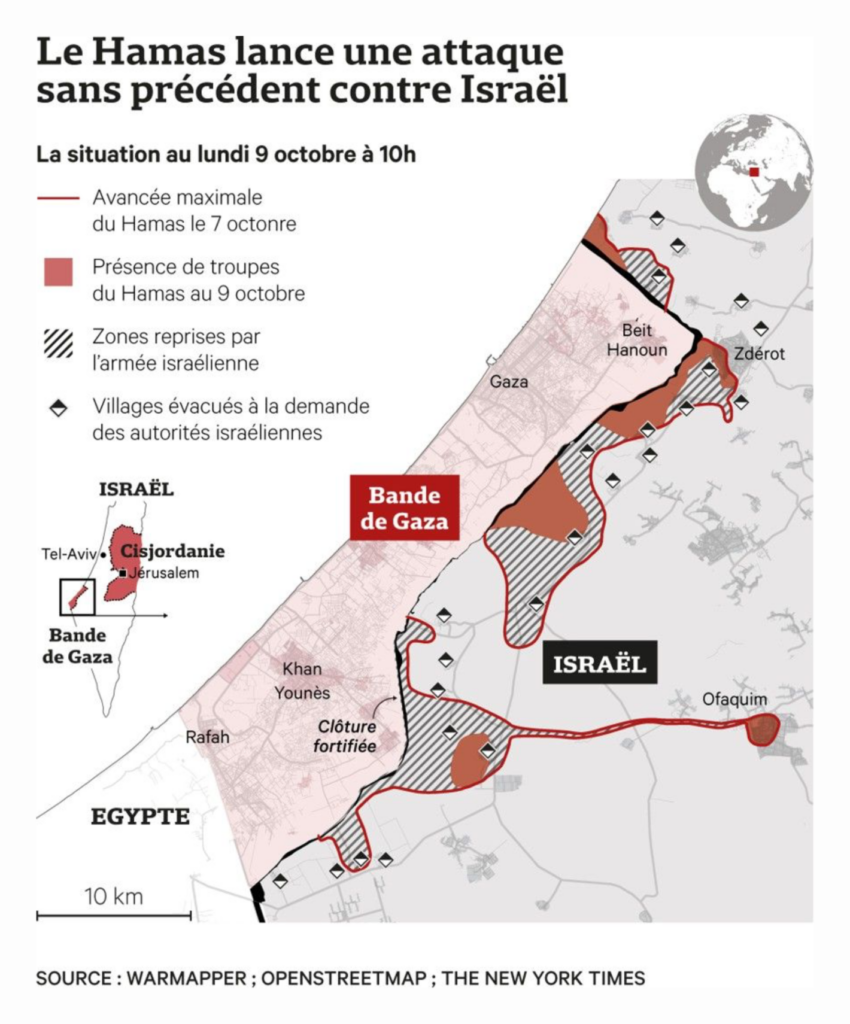
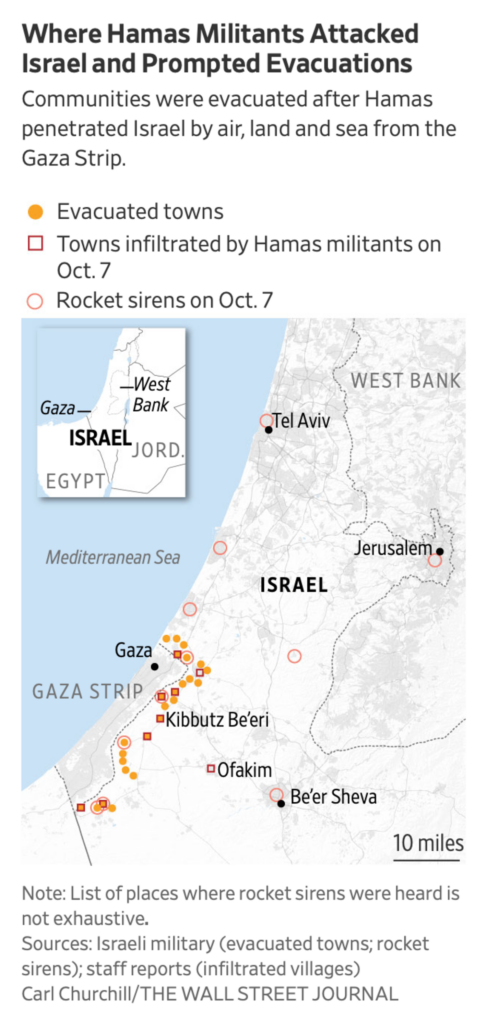
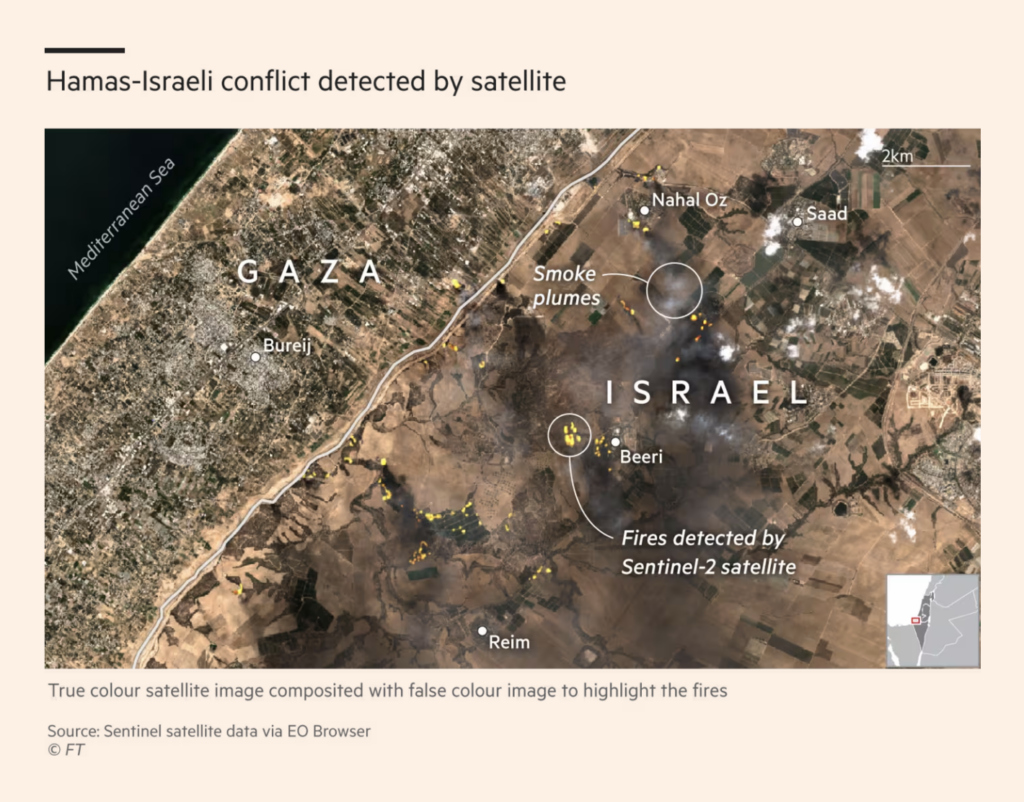
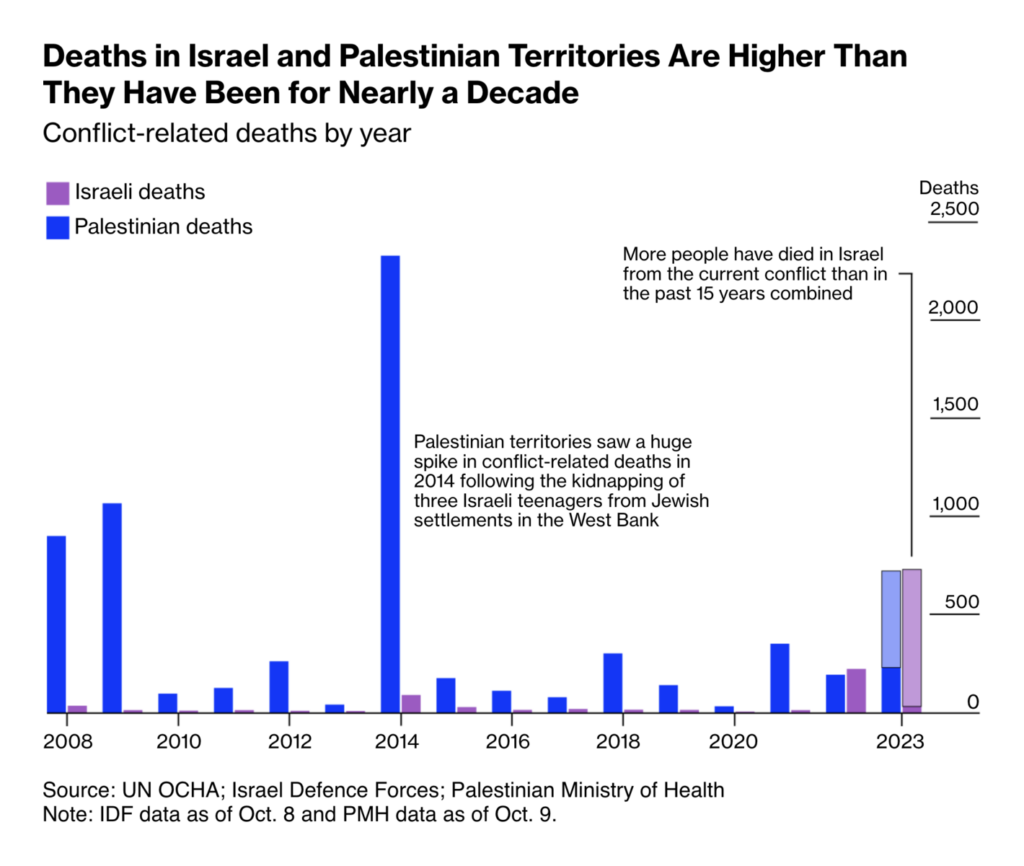
Israel and Gaza have been at war after a surprise offensive by Hamas beginning Saturday morning. We saw many maps visualize the course of this attack and the Israeli response:

Le Monde: Guerre Israël-Gaza : notre carte pour comprendre la situation autour de la bande de Gaza, October 10
Les Echos: Attaque du Hamas : Israël impose un « siège complet » à la bande de Gaza, October 9
The Wall Street Journal: Israel Launches Barrage of Attacks on Gaza, October 9
Financial Times: Israel death toll from Hamas attack exceeds 700, October 9
Bloomberg: A Fractured Israel Unites Around a Singular Goal: Crush the Enemy, October 9

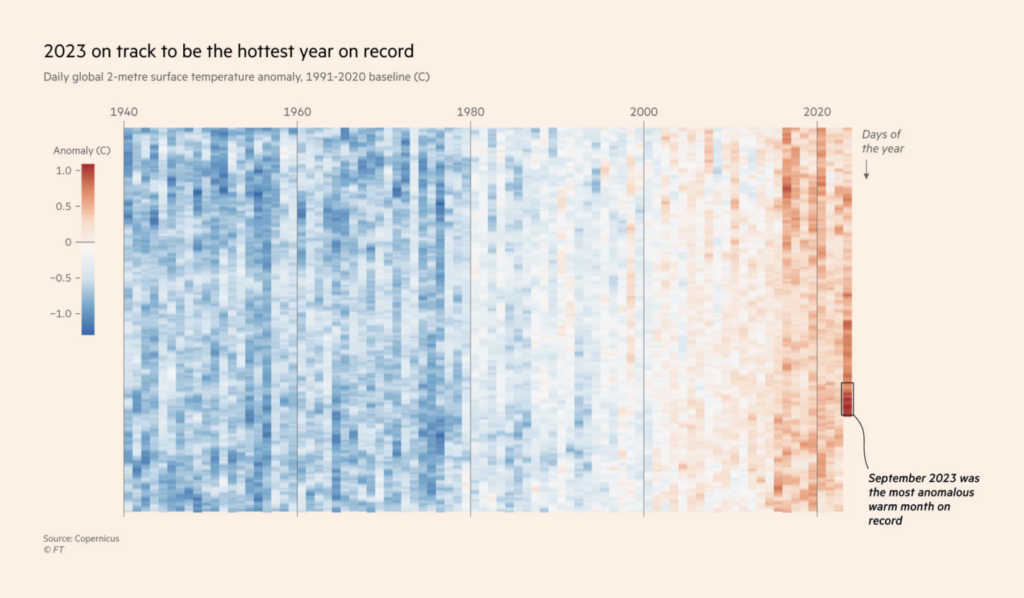
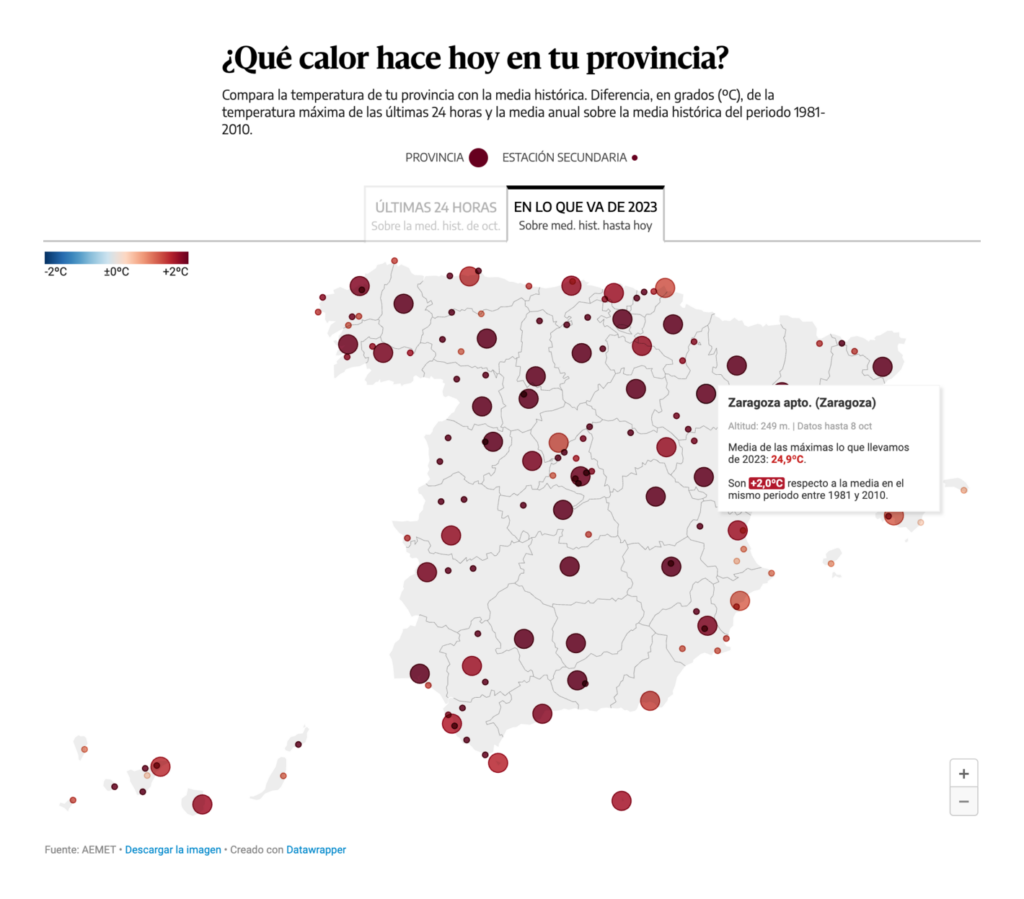
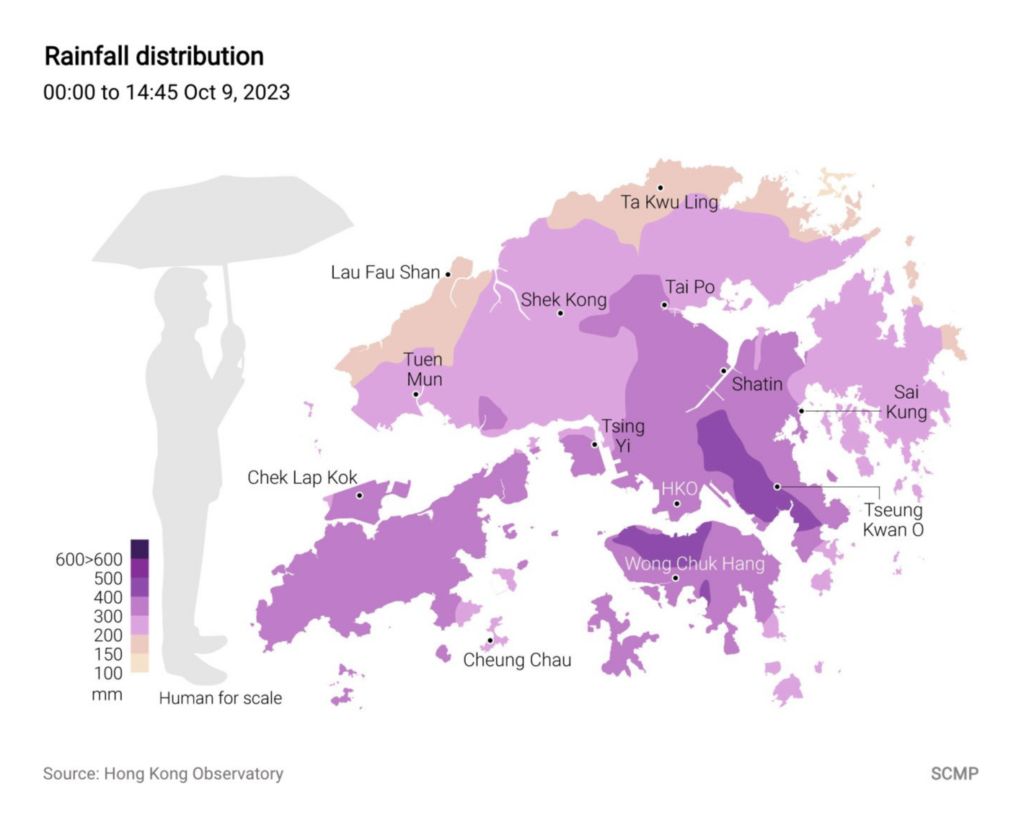
We all had a warm September — at least I did. No wonder that many visualizations were created on the topic of heat:

Financial Times: Climate monitor records hottest ever September by ‘extraordinary’ 0.5C margin, October 6
elDiario.es: El mapa de un año de calor récord: compara la temperatura de cada día con la media histórica de tu provincia, October 6

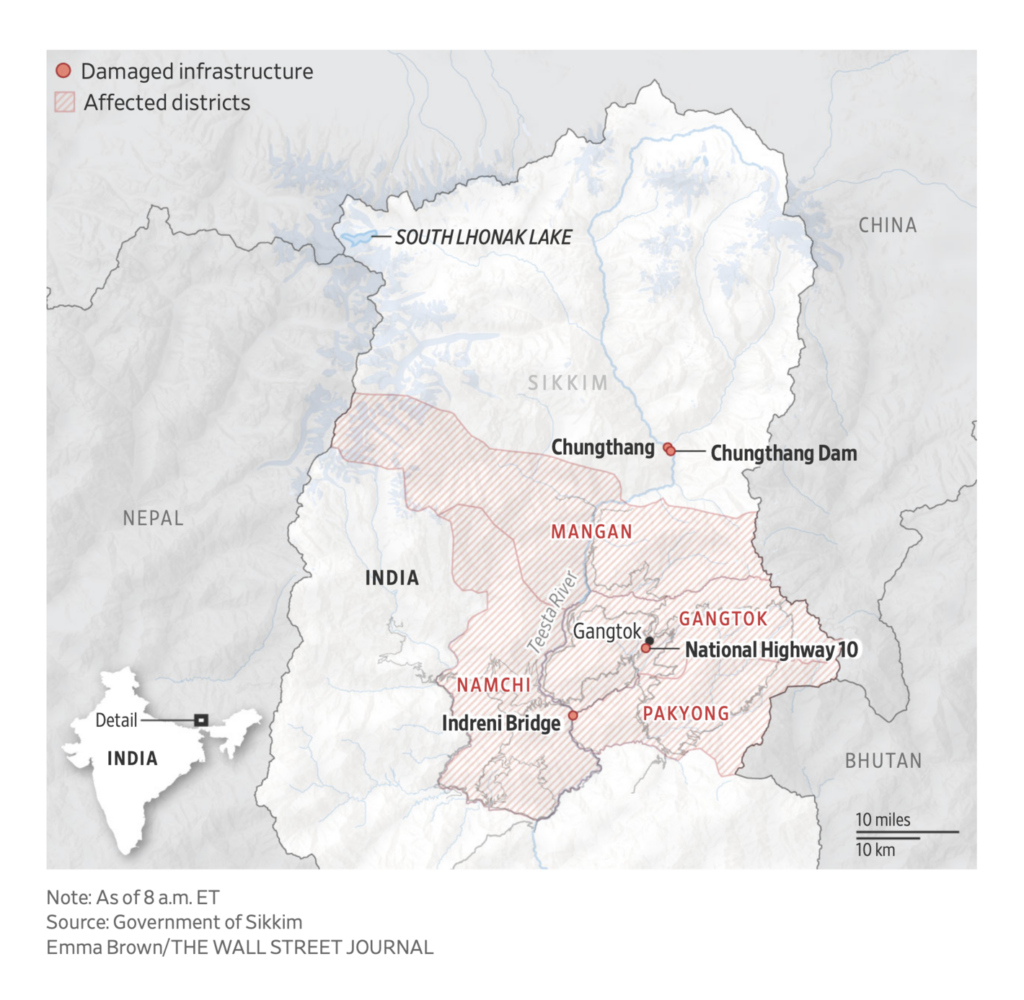
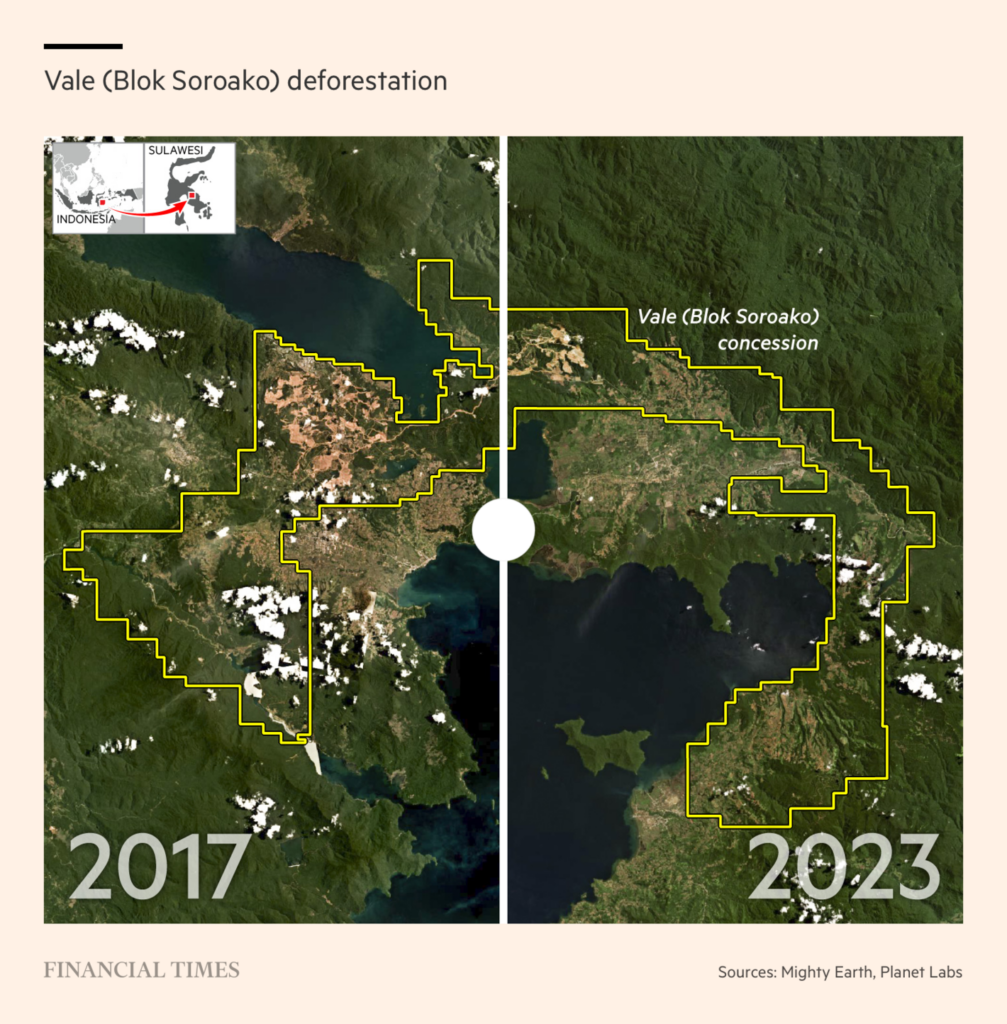
But we also found other environmental topics, including those dealing with environmental disasters:

The Wall Street Journal: Himalayan Lake Bursts in India, Leaving Dozens Dead and Missing, October 5
SCMP Graphics: “Rainy day in HK,” October 9 (Tweet)
Financial Times: Nickel miners linked to devastation of Indonesian forests, October 8

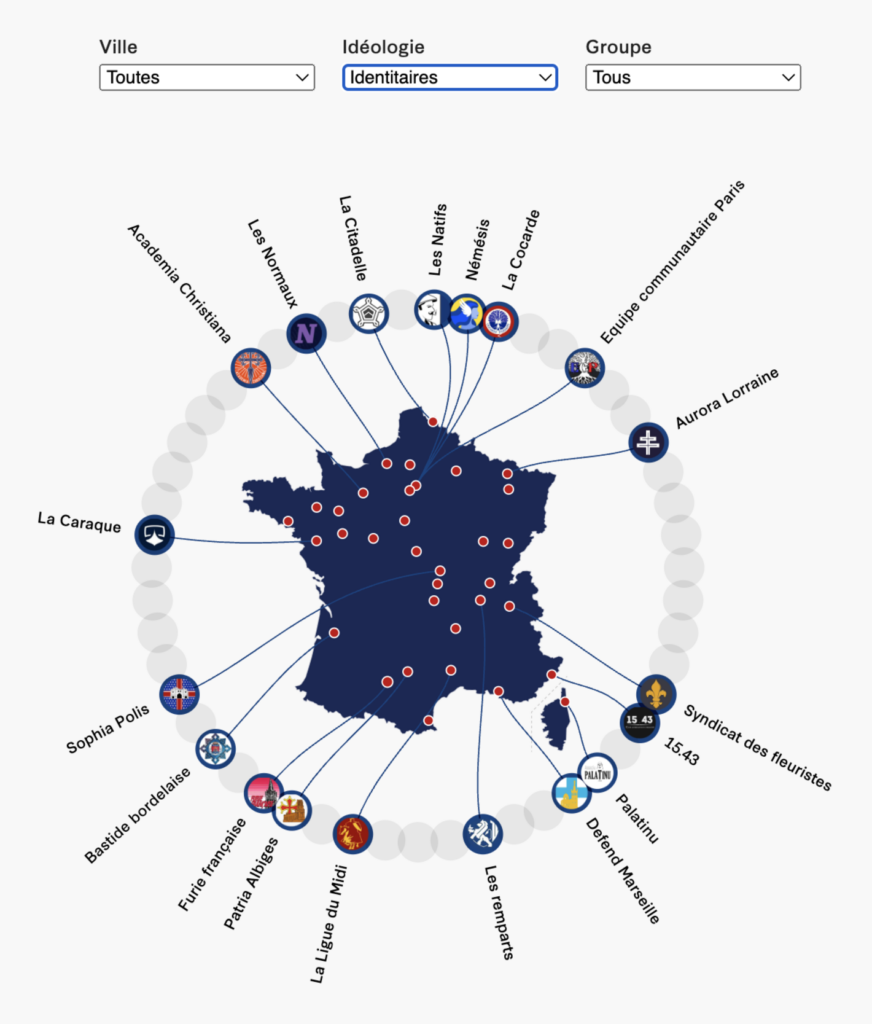
The results of state elections in Germany, the upcoming national elections in Argentina, and a chart of right-wing groups in France all tell a similar story of the political shift to the right:

Zeit Online: Alle Ergebnisse der Landtagswahl in Bayern – live, October 9
Der Spiegel: Schwarz und Blau leuchten in Hessen kräftig – Rot, Grün und Gelb verblassen, October 9
La Nación: Monitor del debate, October 8
Libération: La carte interactive des groupuscules d’extrême droite en France : une mouvance omniprésente, October 3

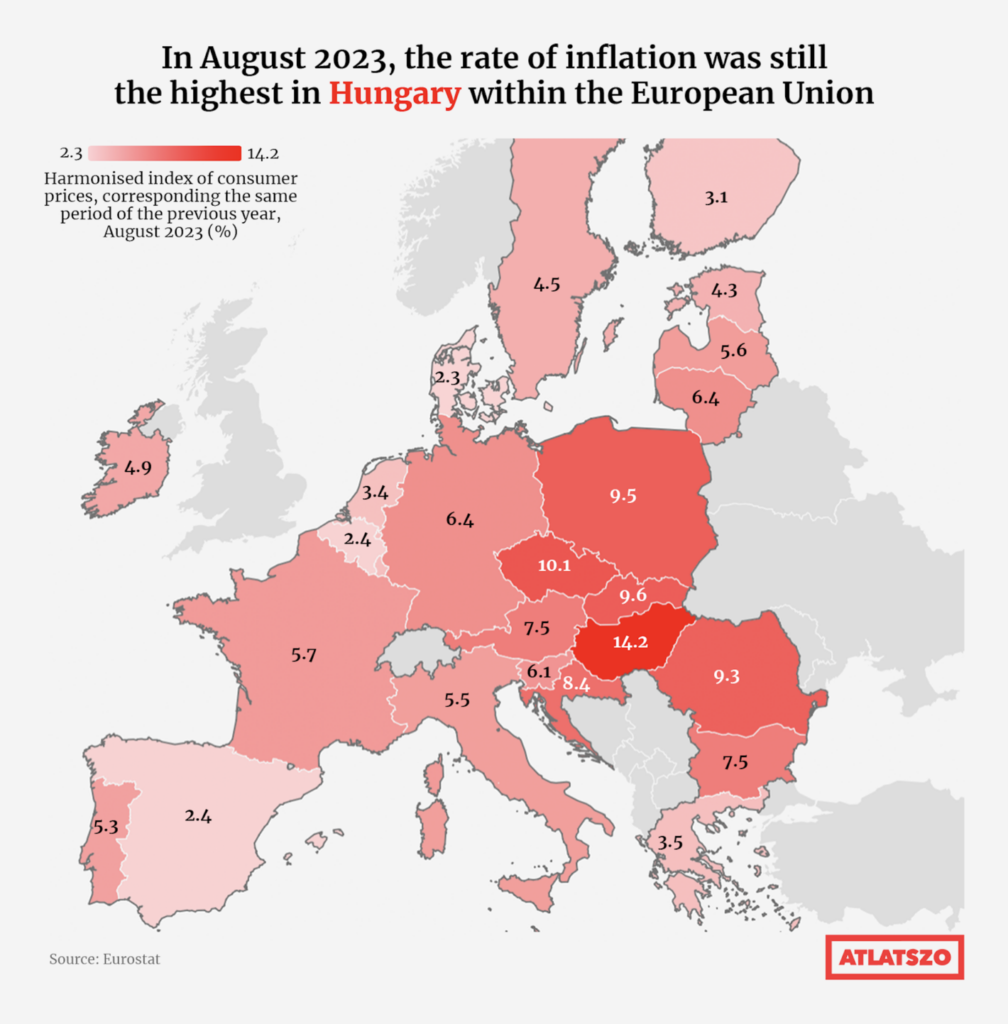
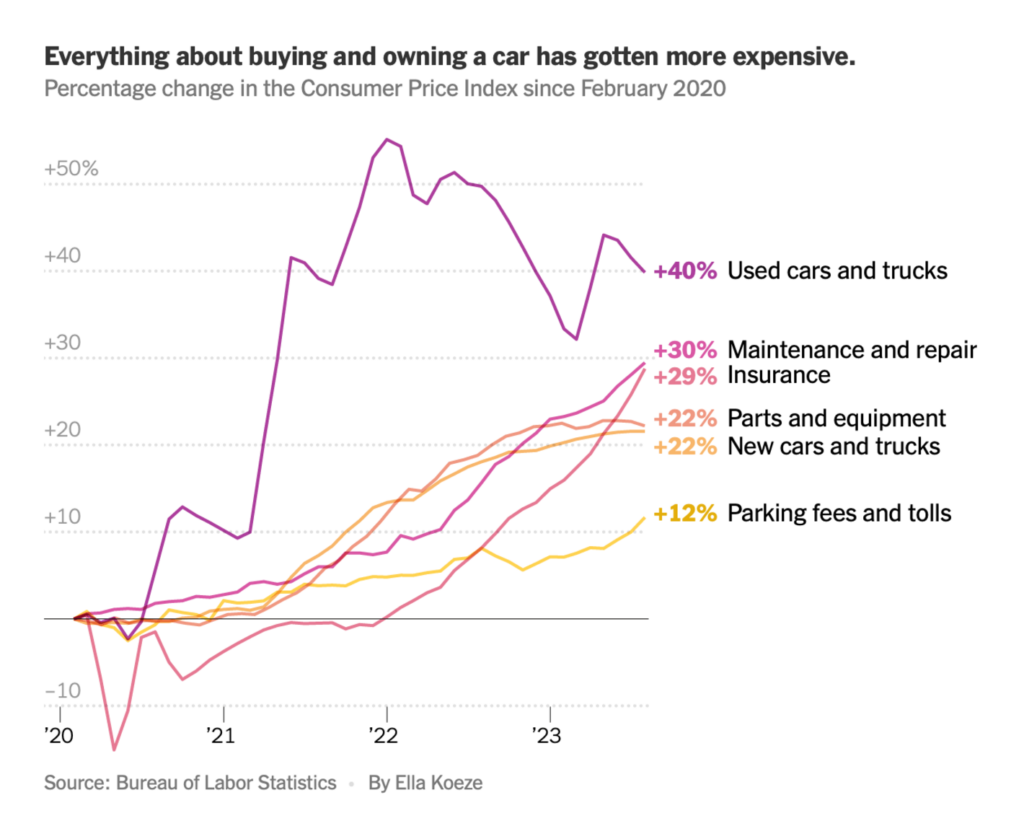
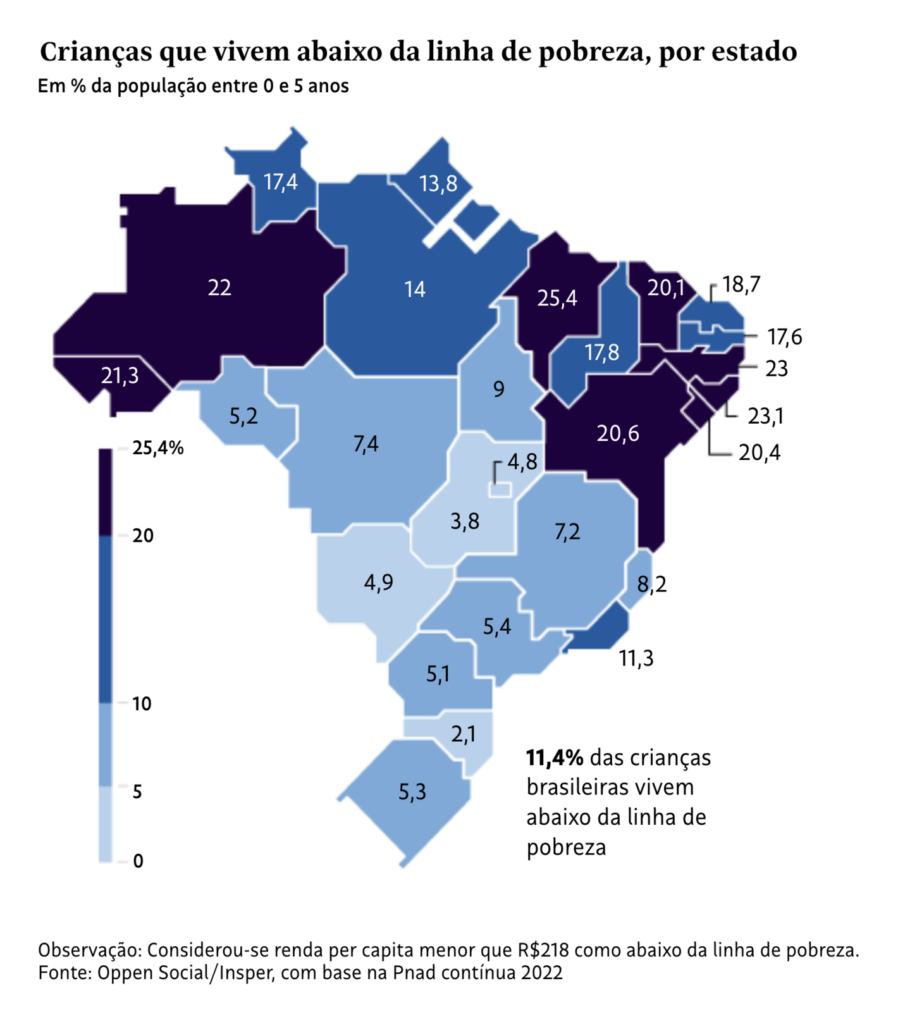
And visualizations from around the world show: Everything is getting more expensive:

Átlátszó: Is high inflation in Hungary really caused by the war in Ukraine?, October 9
The New York Times: How the Costs of Car Ownership Add Up, October 6
Folha de S.Paulo: Brasil precisa dar urgência a políticas públicas para a primeira infância, October 6
Les Echos: De 1.000 à 3.000 milliards en 20 ans : l’explosion de la dette publique expliquée en graphiques, October 3

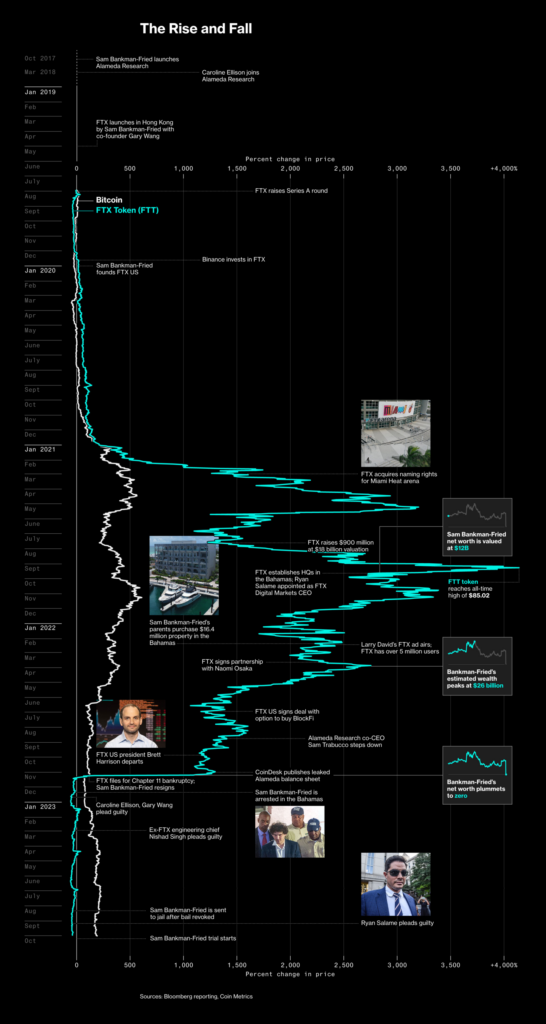
More from the world of finance: Two visualizations dealt with the theft of money from customers of the crypto trading platform FTX:

Bloomberg: From $26 Billion to Bust: Sam Bankman-Fried’s Astonishing Rise and Fall, October 3
The Wall Street Journal: Here’s How FTX Executives Secretly Spent $8 Billion in Customer Money October 7

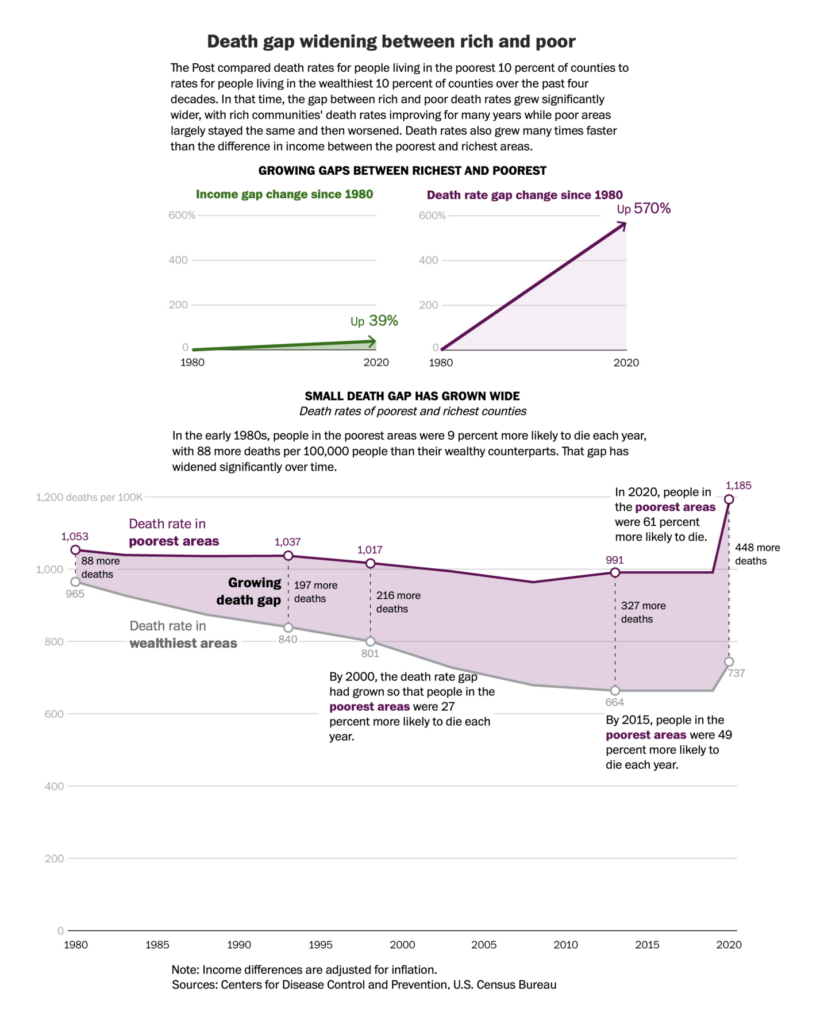
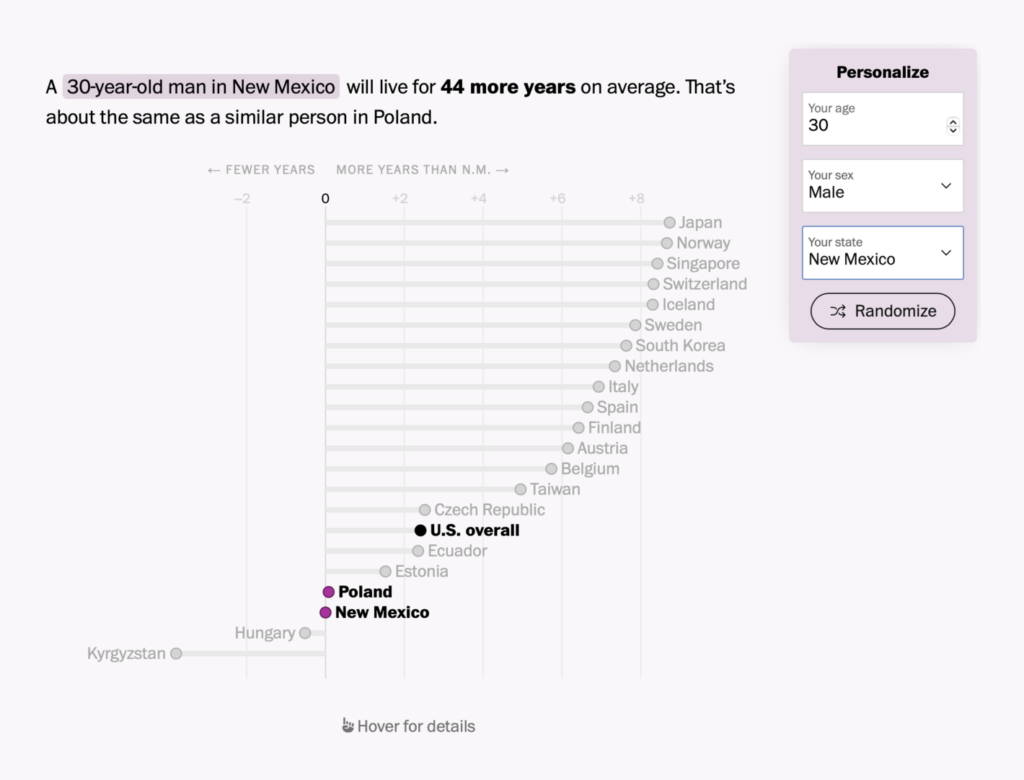
The Washington Post released a small series about America’s life expectancy crisis:

The Washington Post: America’s epidemic of chronic illness is killing us too soon, October 3
The Washington Post: Compare your life expectancy with others around the world, October 3
The Washington Post: How red-state politics are shaving years off American lives, October 3

And two beautifully animated stories brought maps to life:

Andy Woodruff: Eclipse 2024, October 5
The Straits Times: Why the haze has reached Singapore’s shores again, October 7

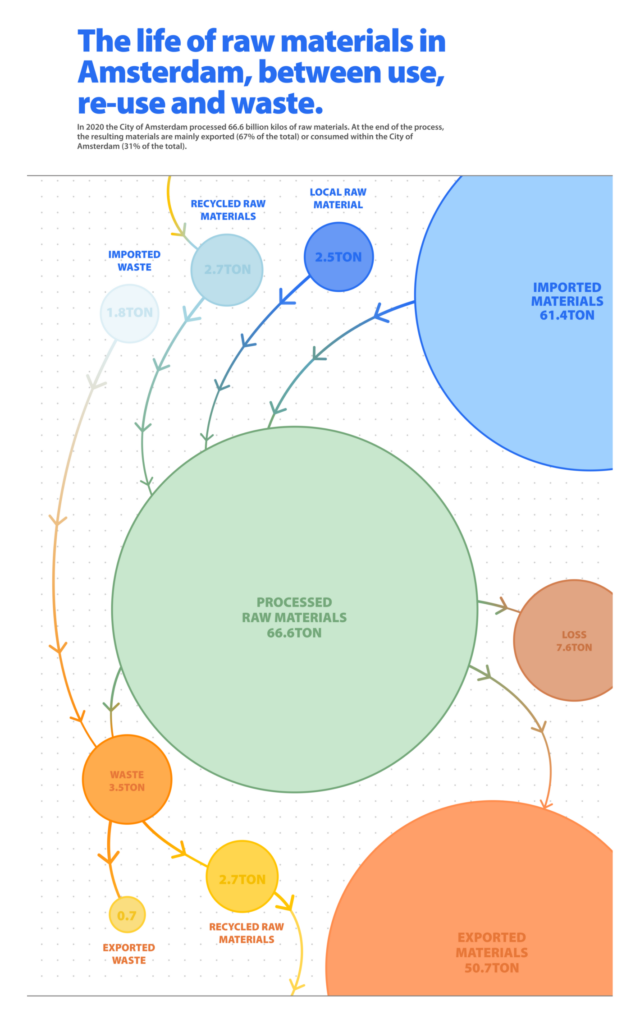
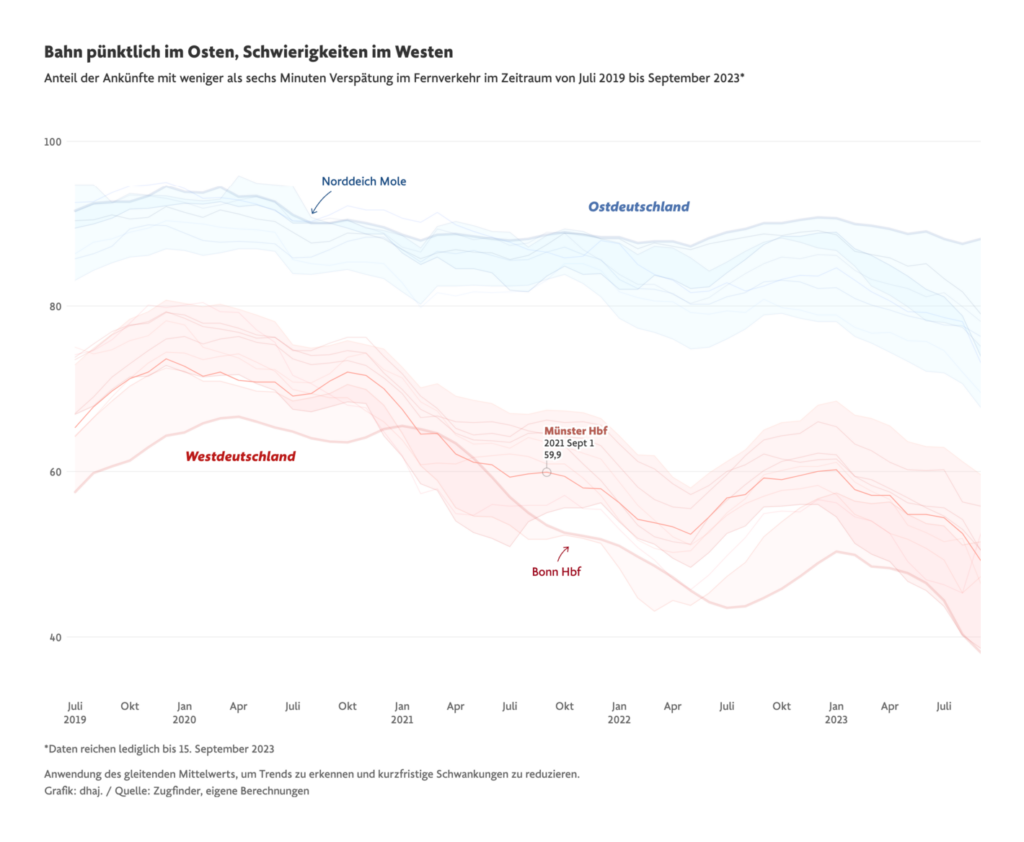
Other visualizations ranged from the use of raw materials in Amsterdam to “Am I already too old for the Nobel Prize in Physics?” to differences in public transport across Germany:

European Commission: Open data as an enabler to regional development and better cohesion in Europe, October 9
San Francisco Chronicle: Charts show extremely detailed look into California’s changing population, October 9
The Economist: At what age do you hit the peak of your career?, October 6
Frankfurter Allgemeine Zeitung: Endstation Bahnhof, October 5

What else we found interesting

The Straits Times: The MOH Cancer Drug List: What it means to you, October 6
The Straits Times: How the ICA foils attempts to smuggle contraband into Singapore, October 5

Applications are open for…


Help us make this dispatch better! We’d love to hear which newsletters, blogs, or social media accounts we need to follow to learn about interesting projects, especially from less-covered parts of the world (Asia, South America, Africa). Write us at hello@datawrapper.de or leave a comment below.

Want the Dispatch in your inbox every Tuesday? Sign up for our Blog Update newsletter!

Comments