This article is brought to you by Datawrapper, a data visualization tool for creating charts, maps, and tables. Learn more.
Data Vis Dispatch, October 18
The best of last week’s big and small data visualizations

Welcome back to the 64th edition of Data Vis Dispatch! Every week, we’ll be publishing a collection of the best small and large data visualizations we find, especially from news organizations — to celebrate data journalism, data visualization, simple charts, elaborate maps, and their creators.
Recurring topics this week include protests in Iran, an energy crisis in Europe, and the Communist Party Congress in China.
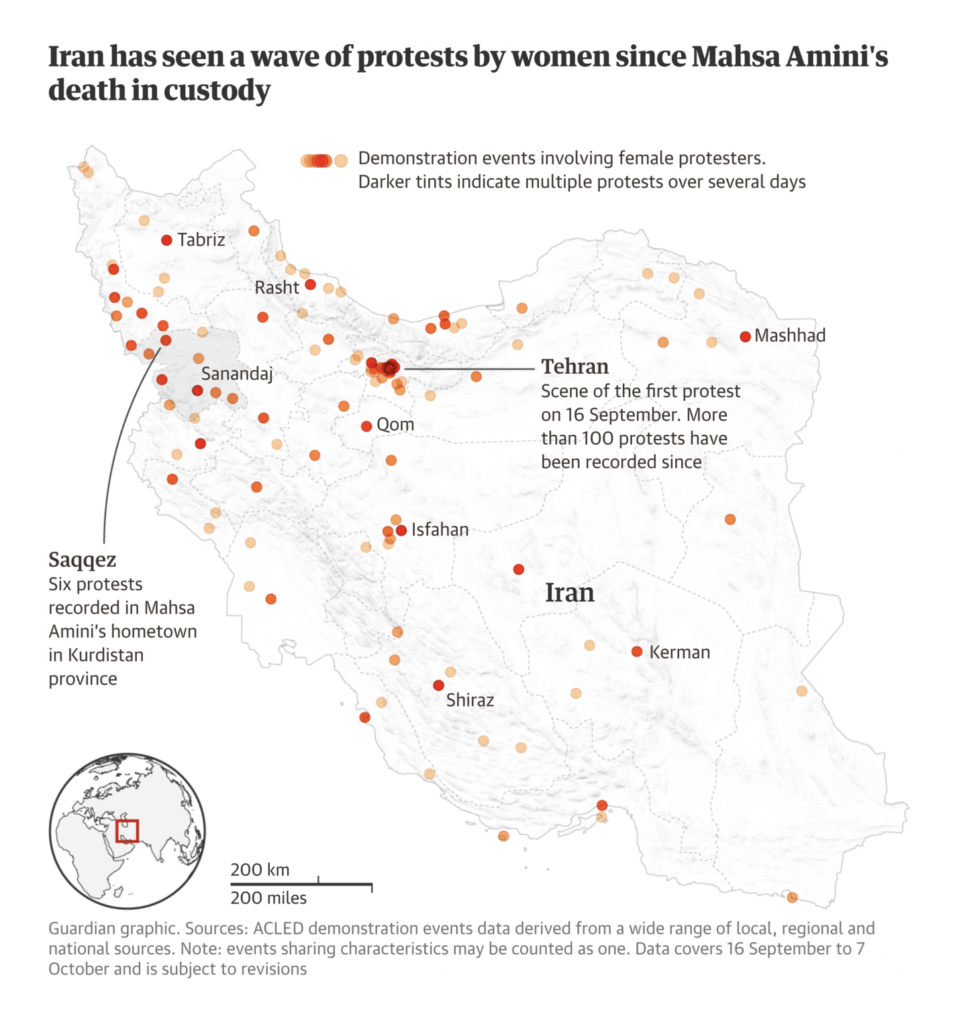
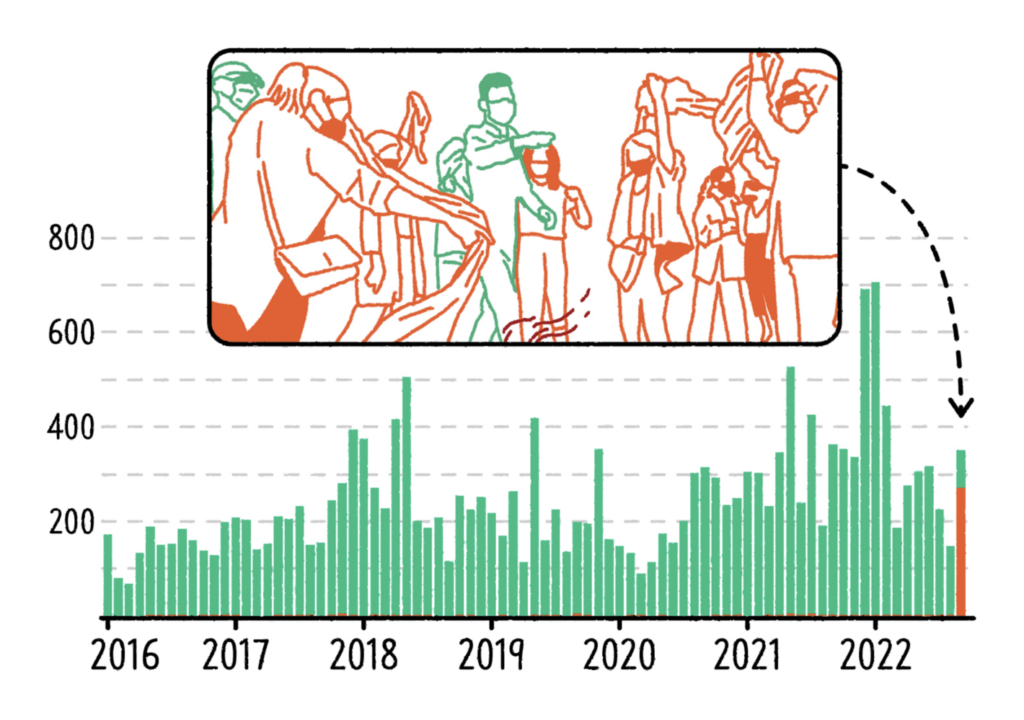
The ongoing wave of protests in Iran is notable for being led mostly by women:
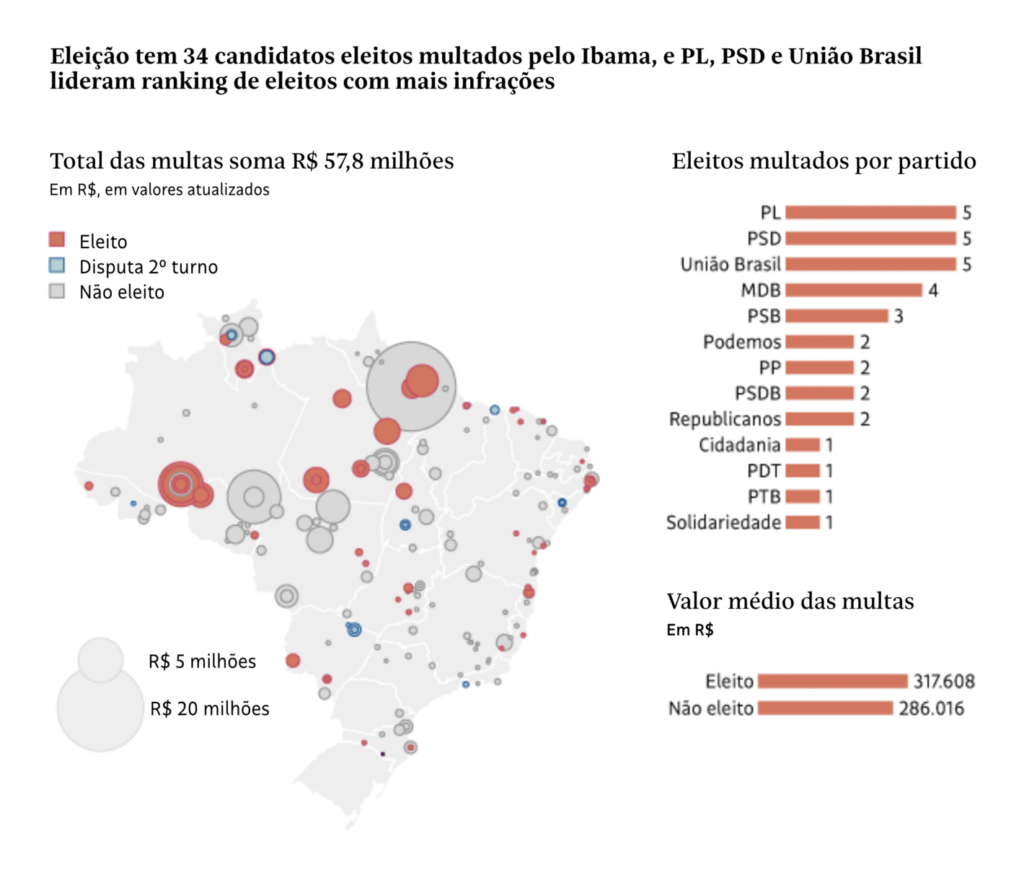
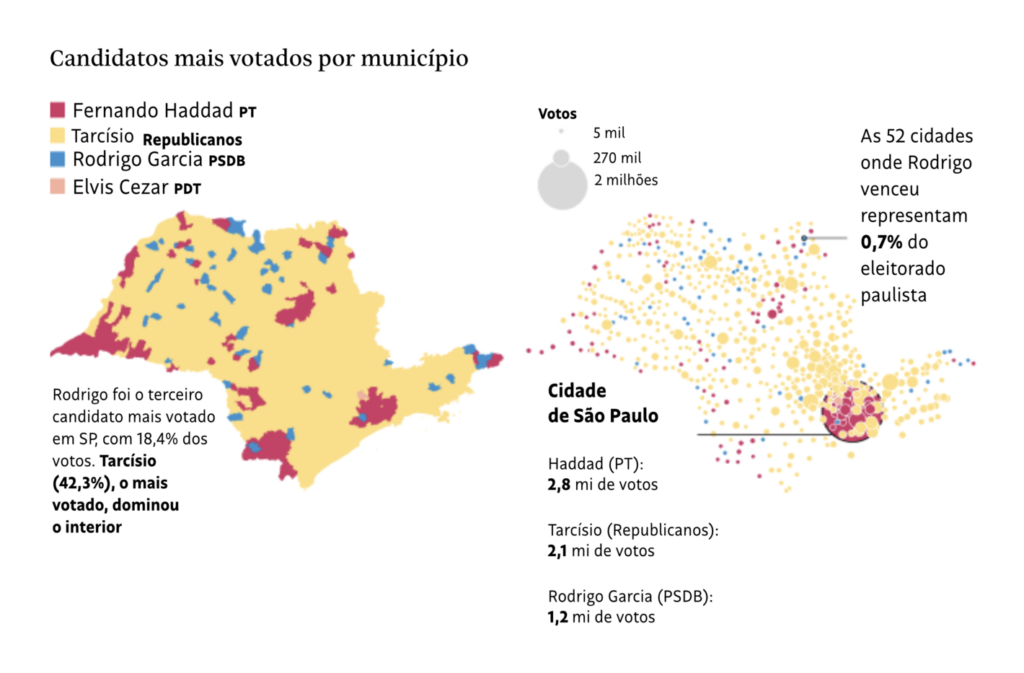
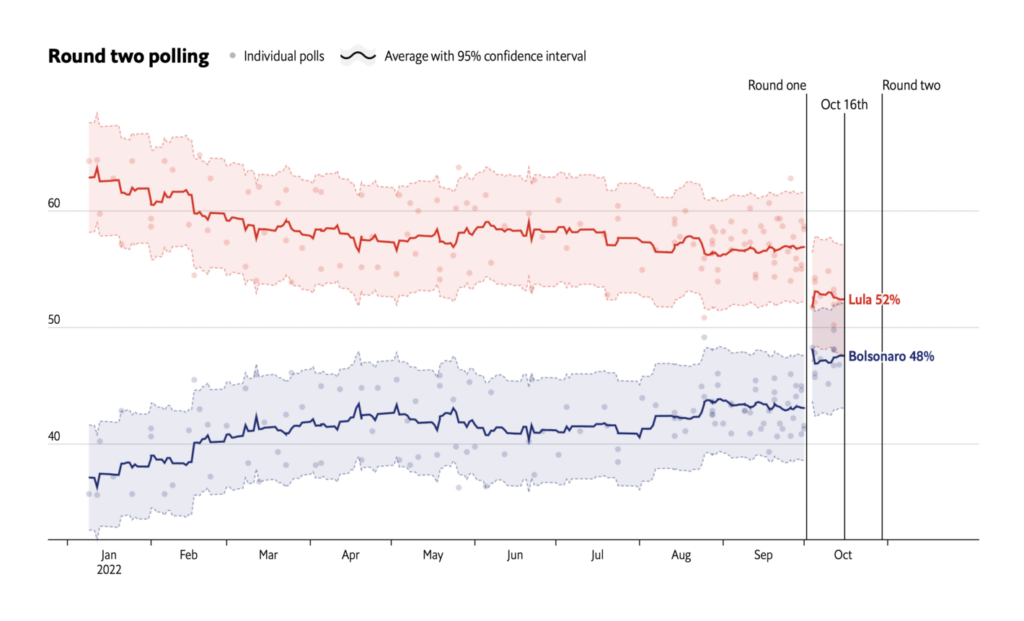
This week’s charts went deeper on the elections in Brazil::
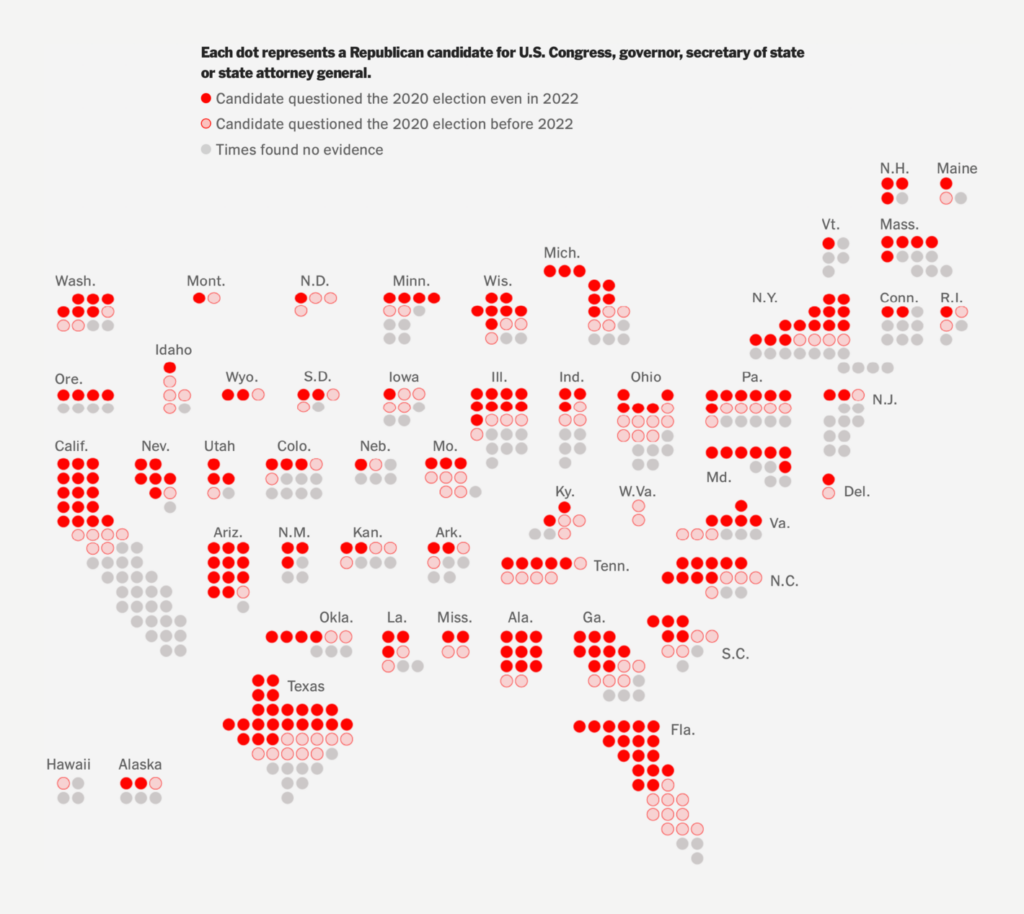
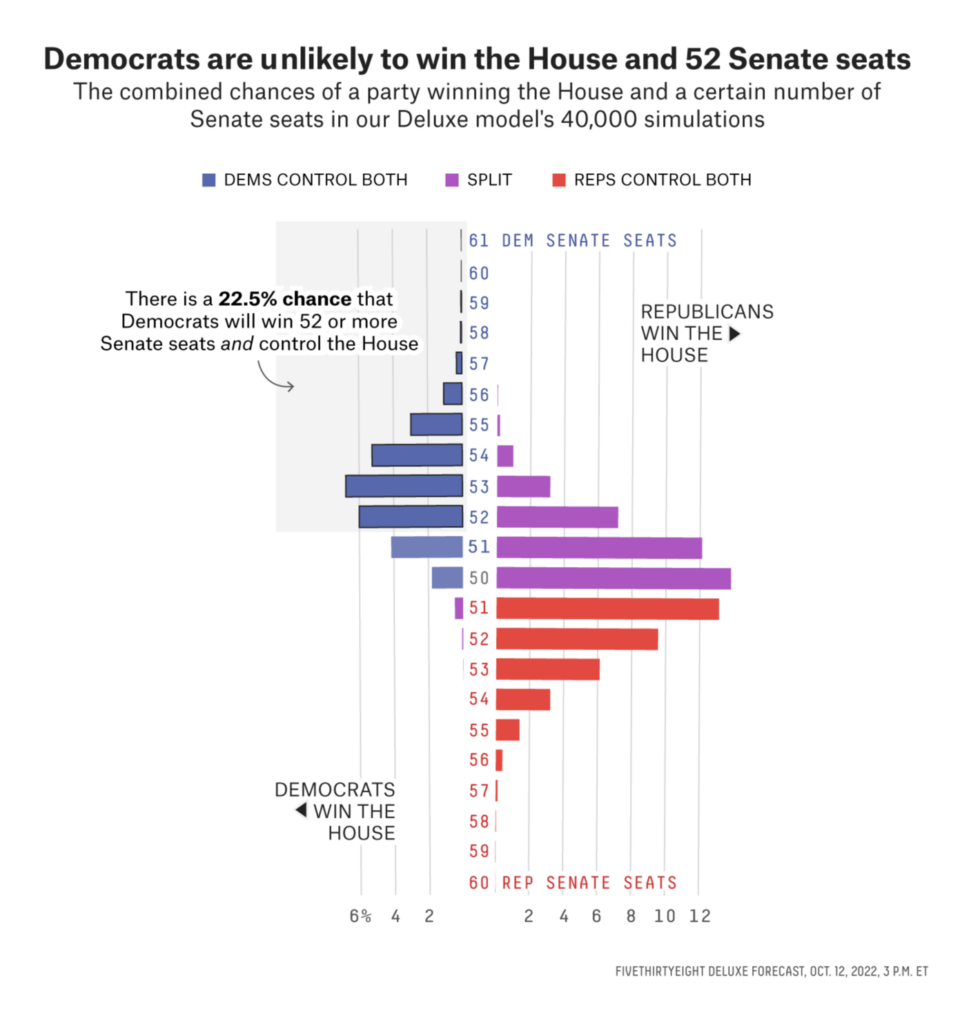
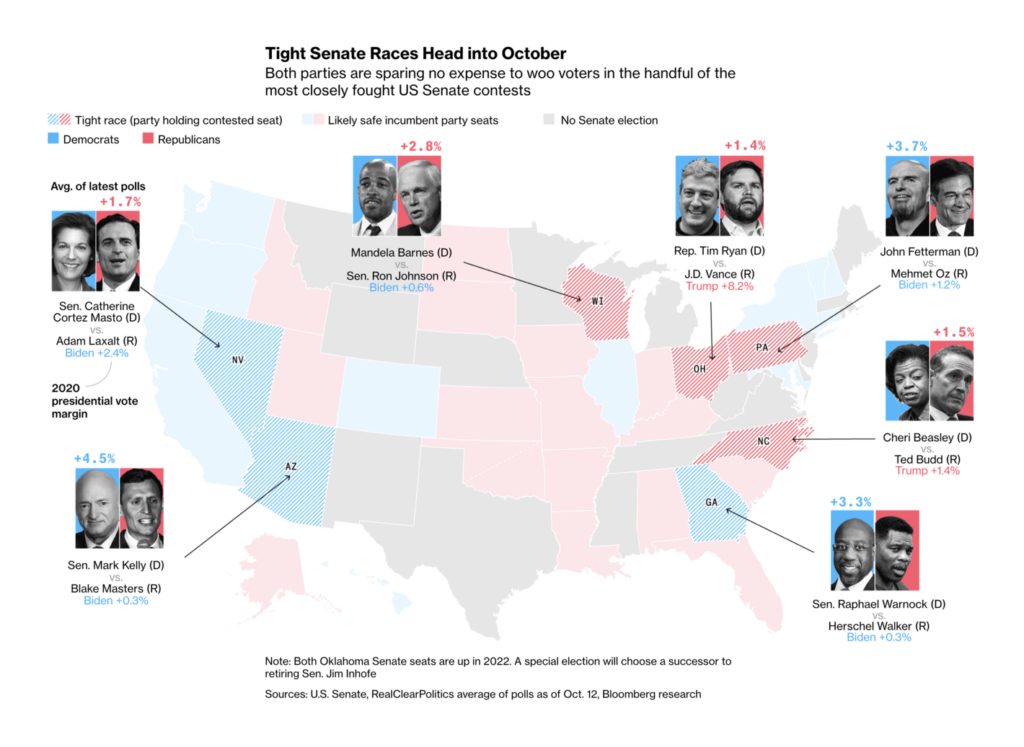
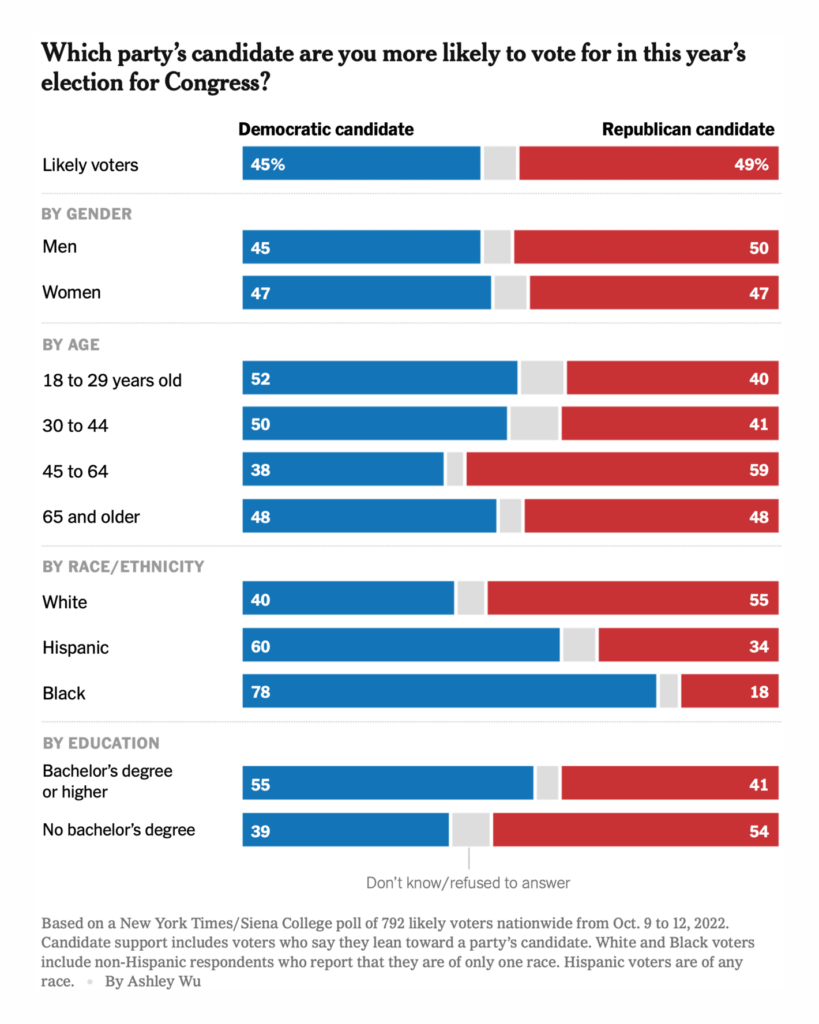
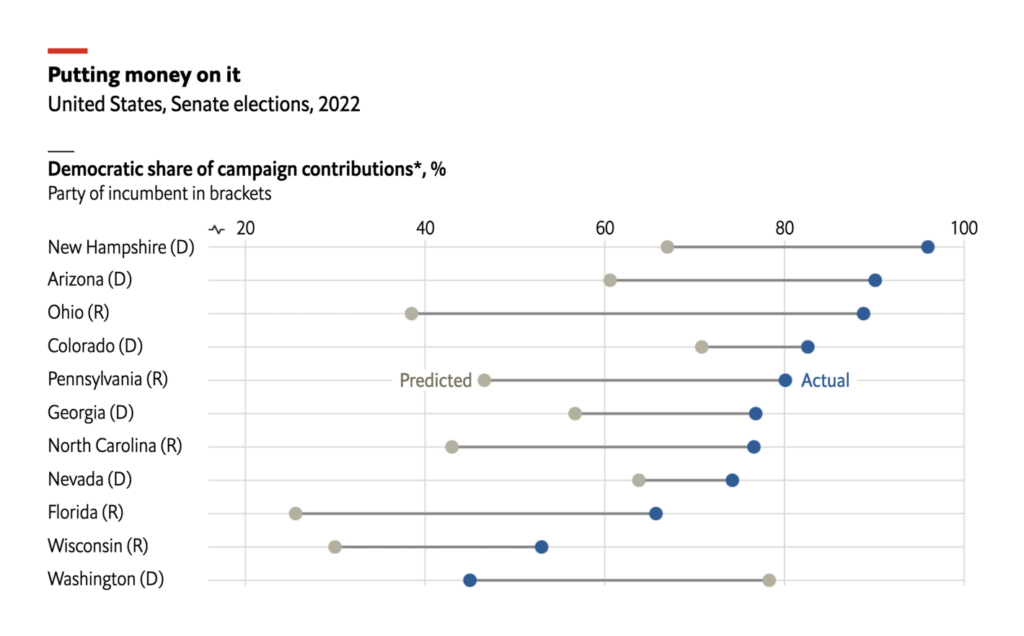
And of course midterms are approaching in the United States:
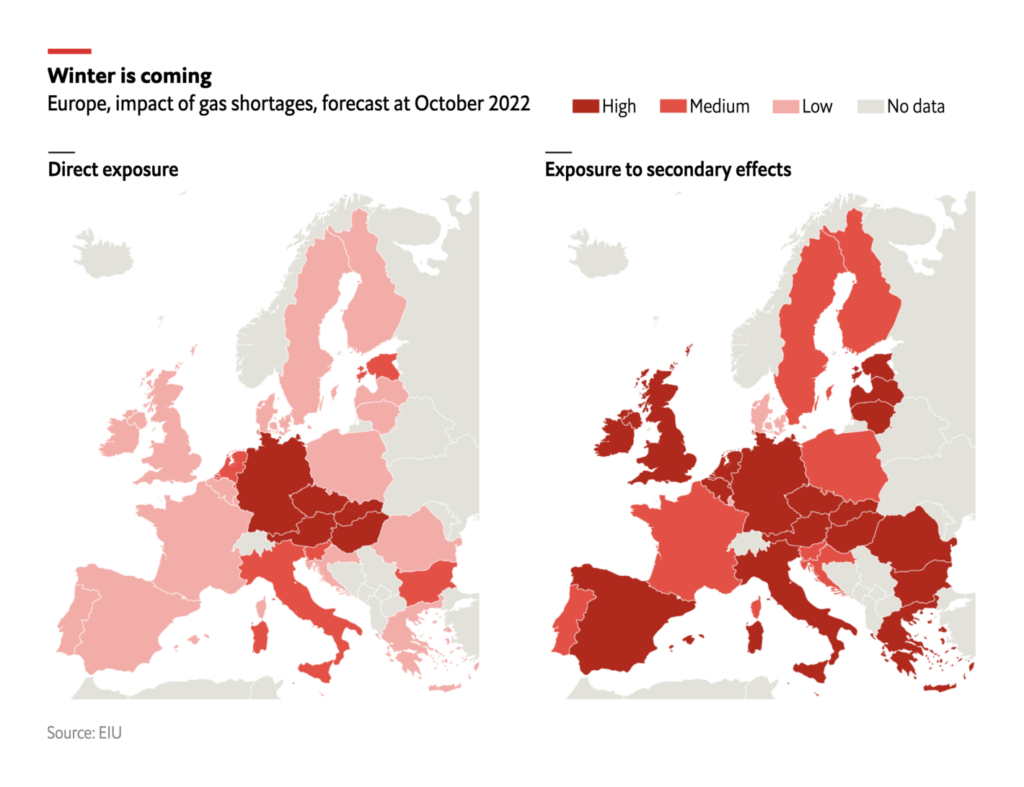
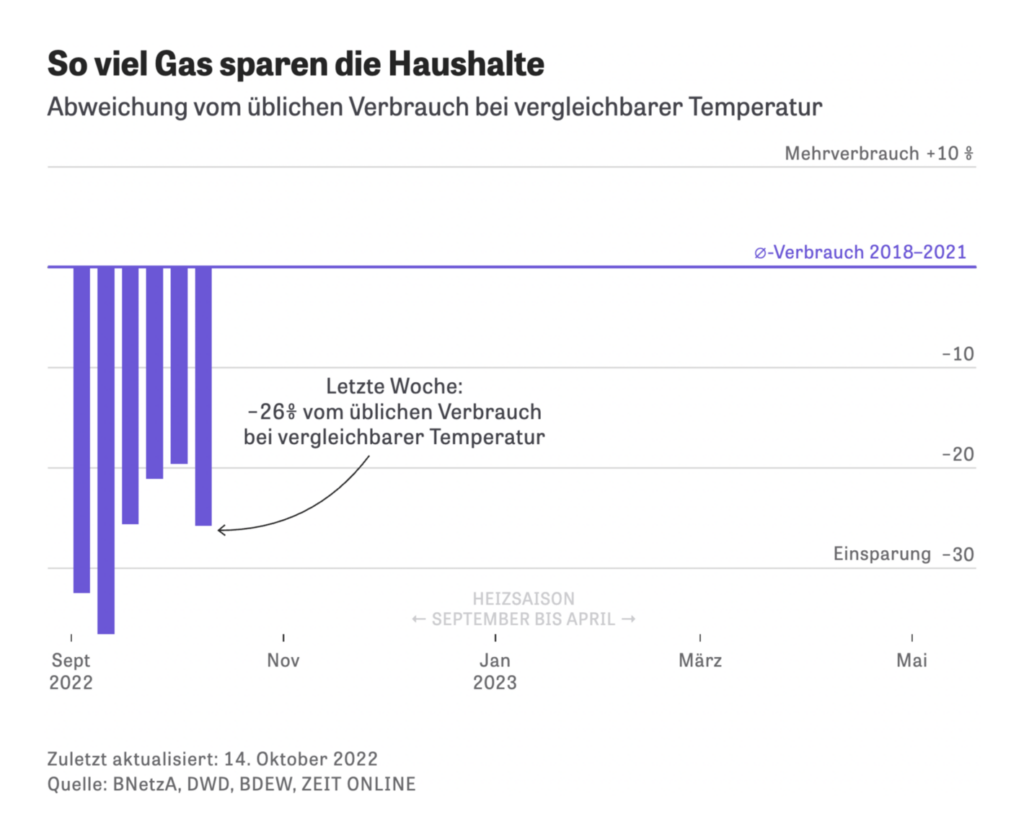
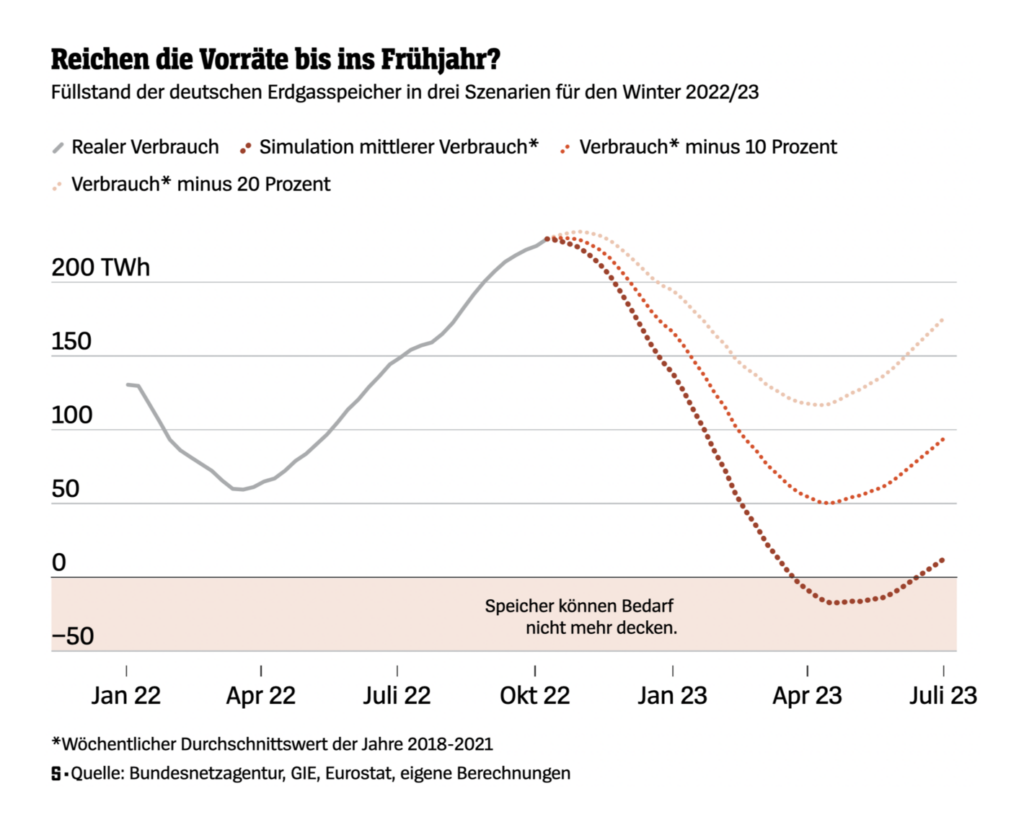
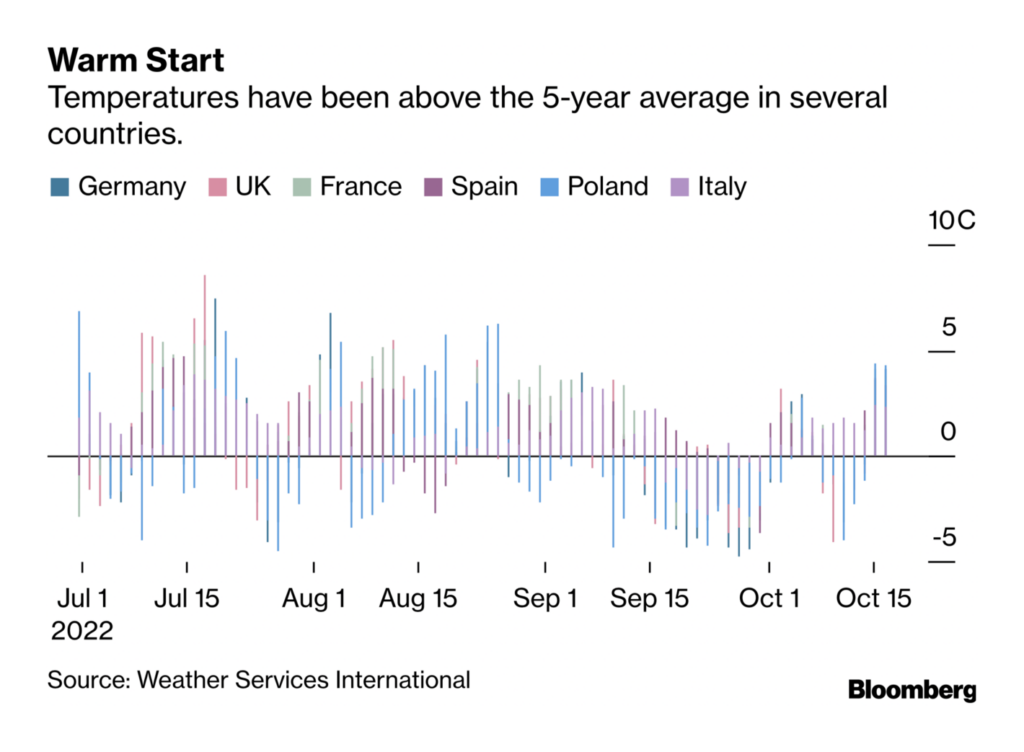
Here in Germany, the topic of the week is a looming energy crisis — and whether enough is being done to prepare for winter:
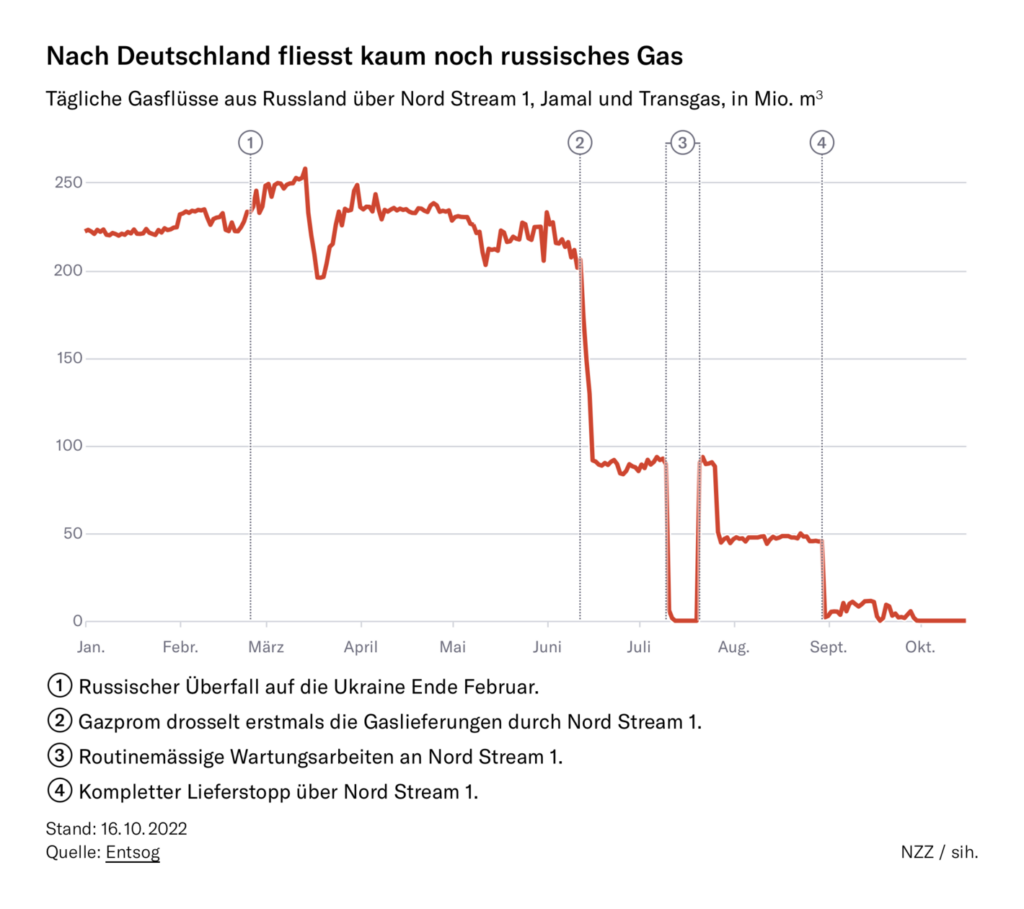
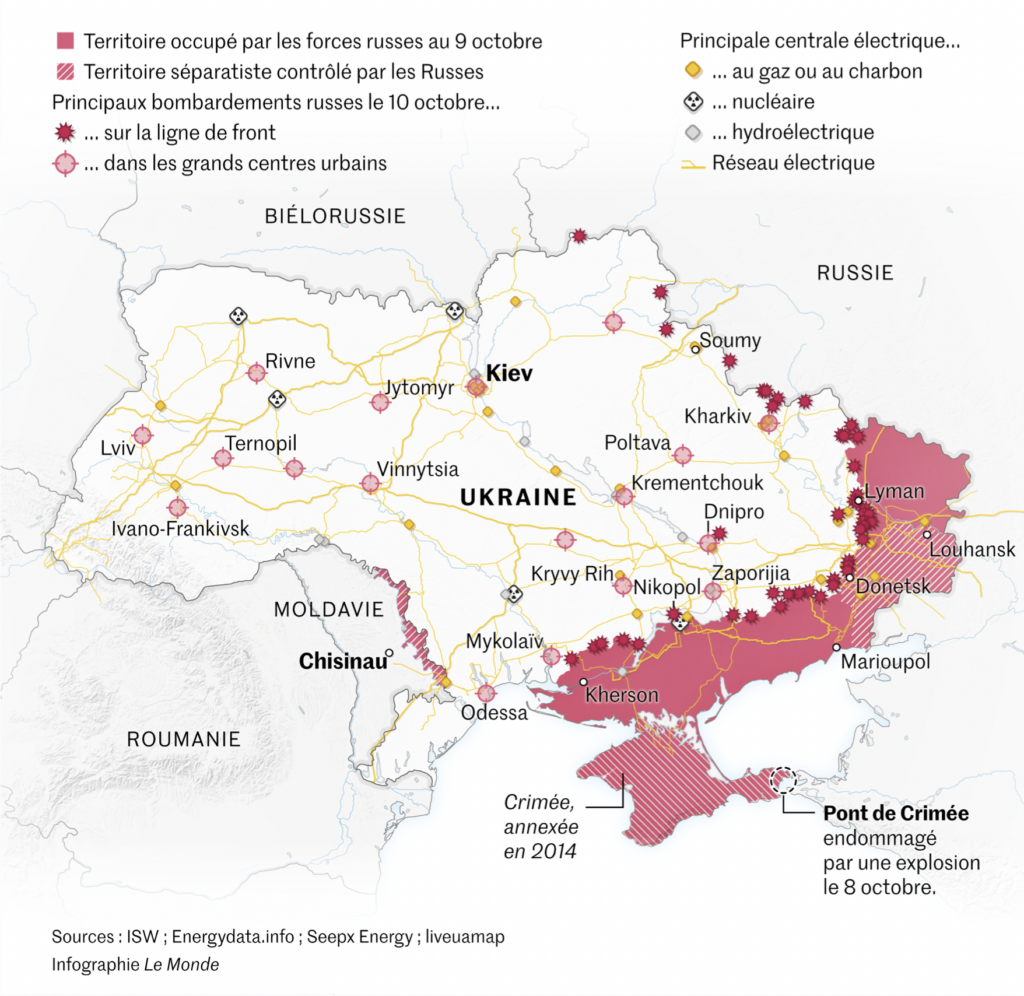
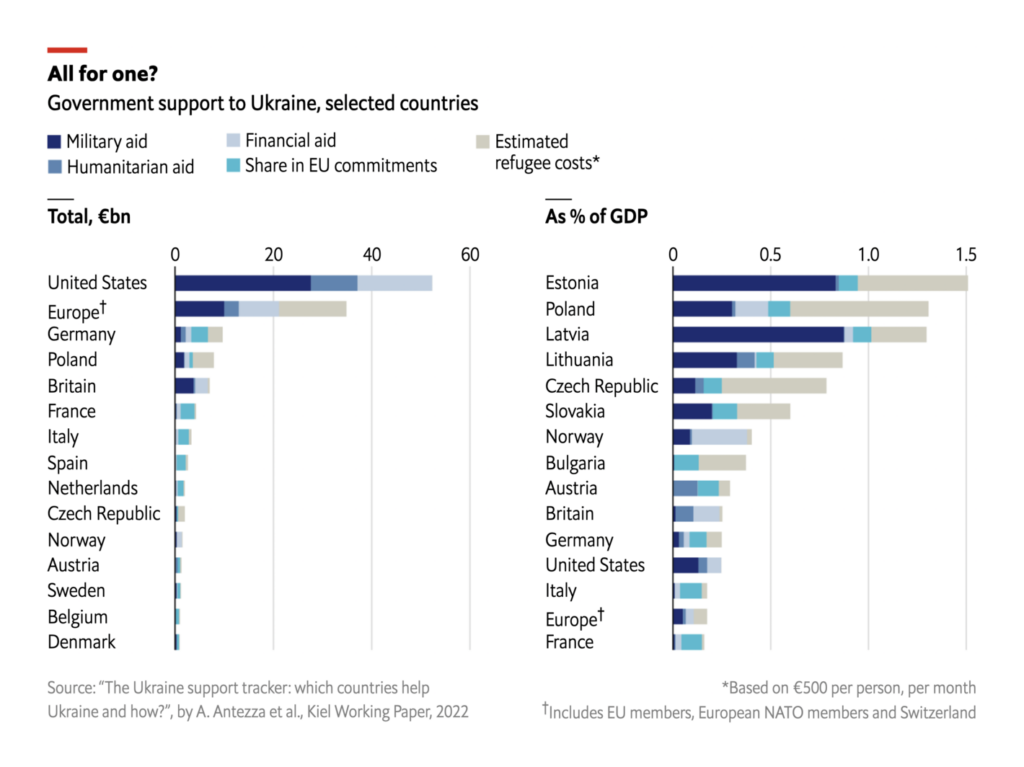
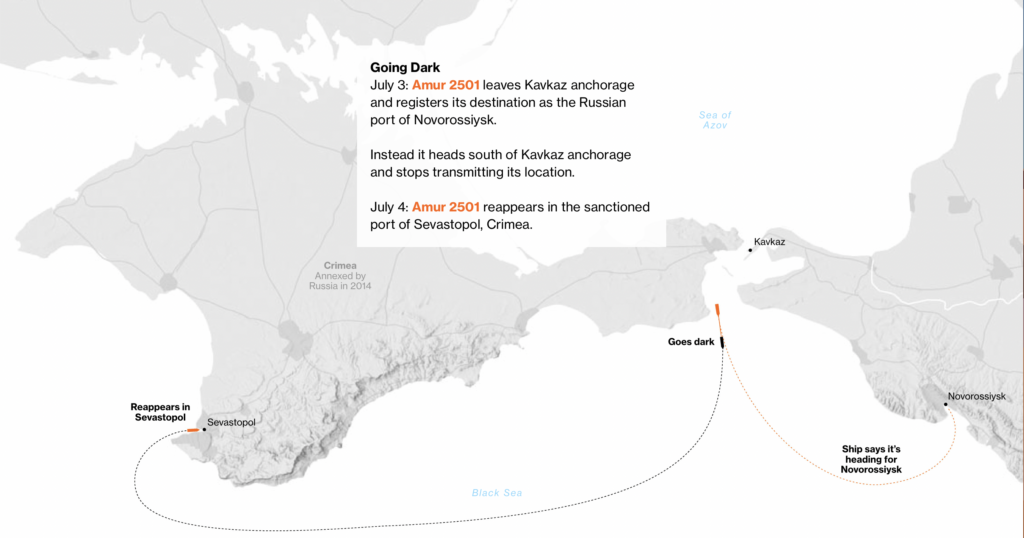
No one can talk about energy in Europe without speaking of the war in Ukraine:
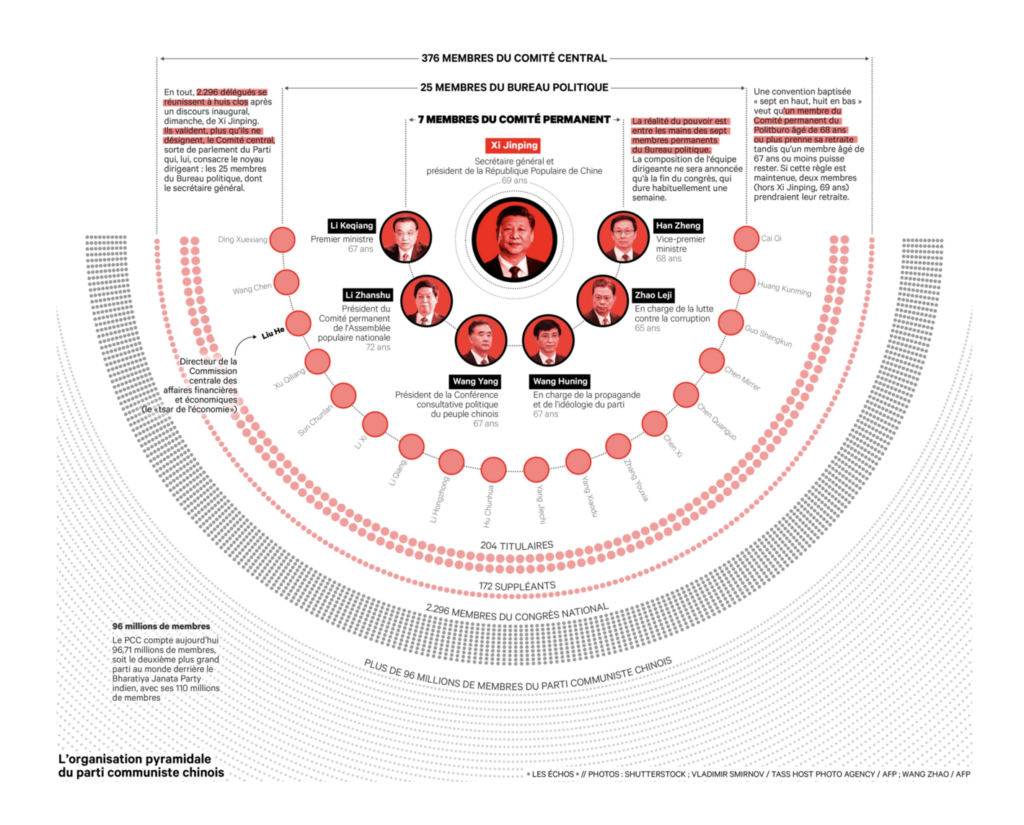
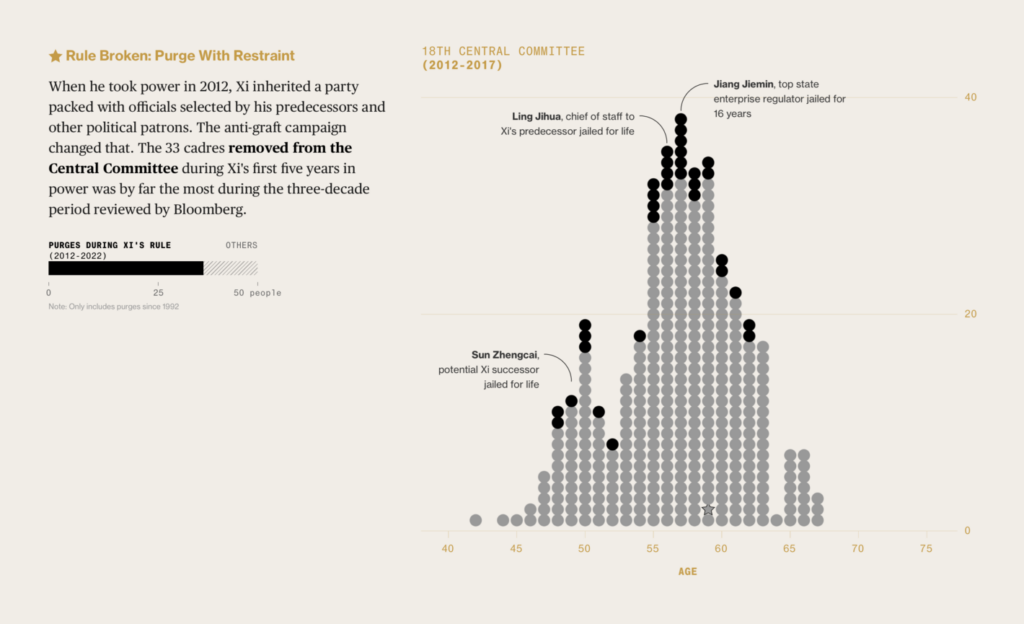
Meanwhile in China, it was the beginning of the 20th Communist Party Congress:
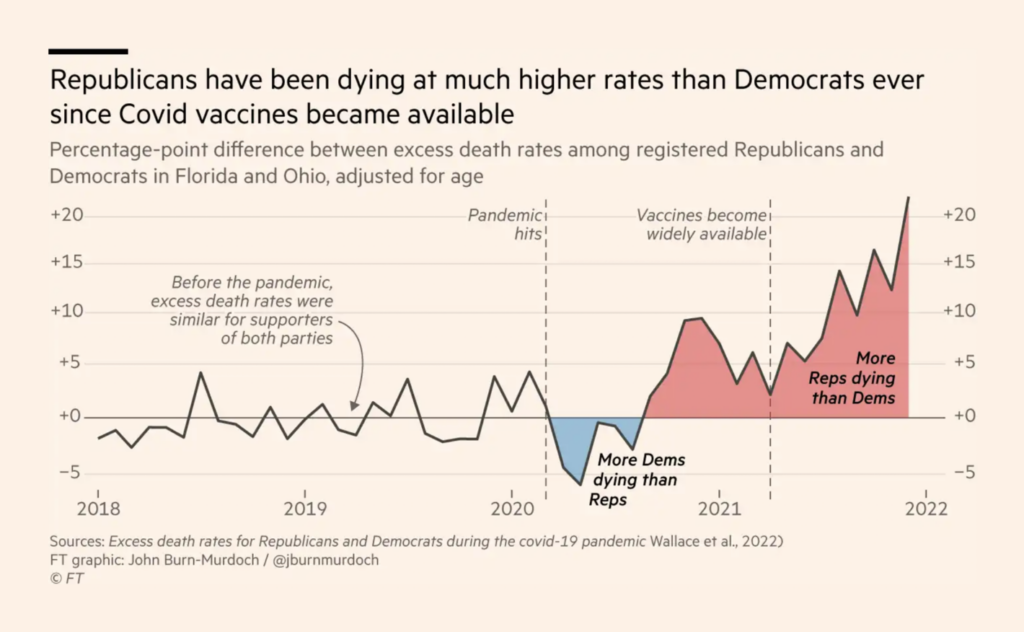
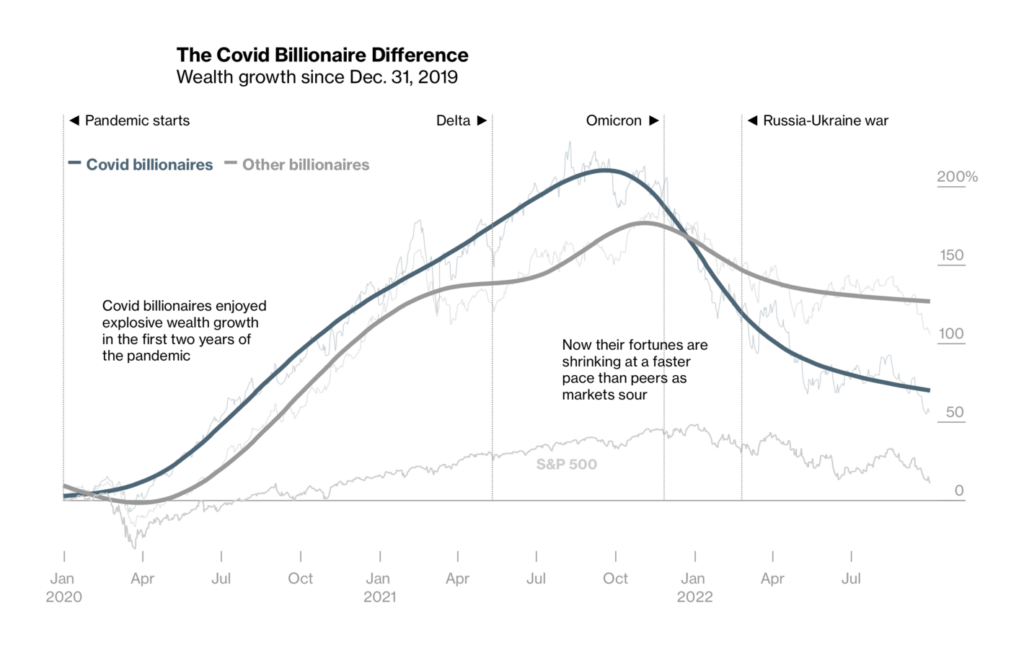
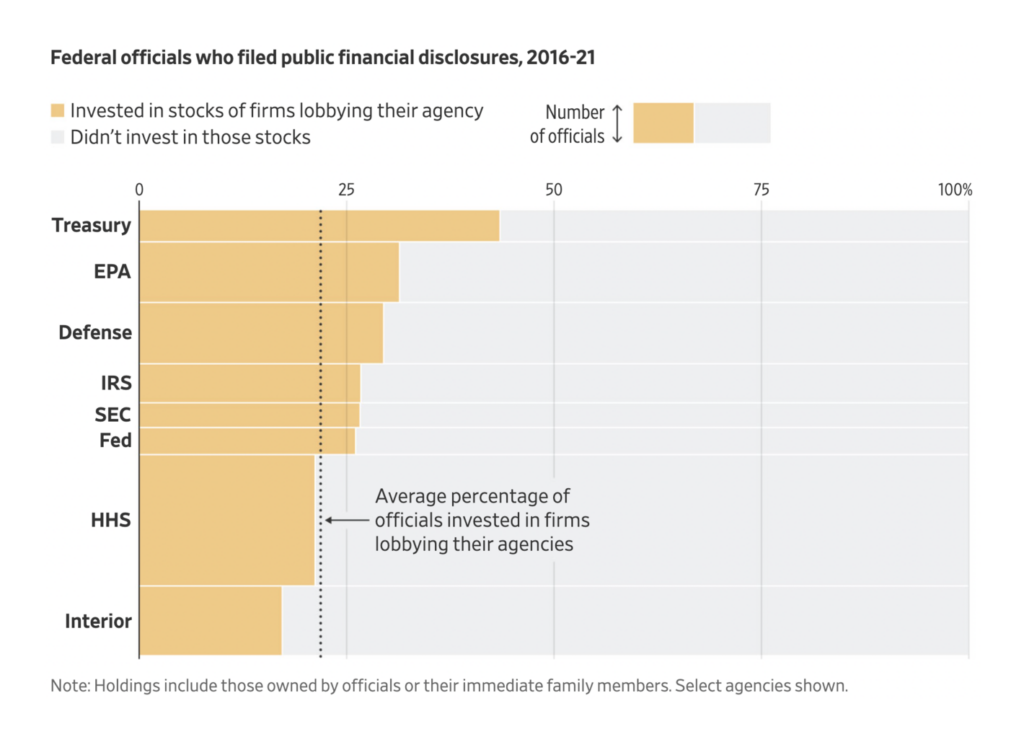
COVID charts dealt with politics and profits:
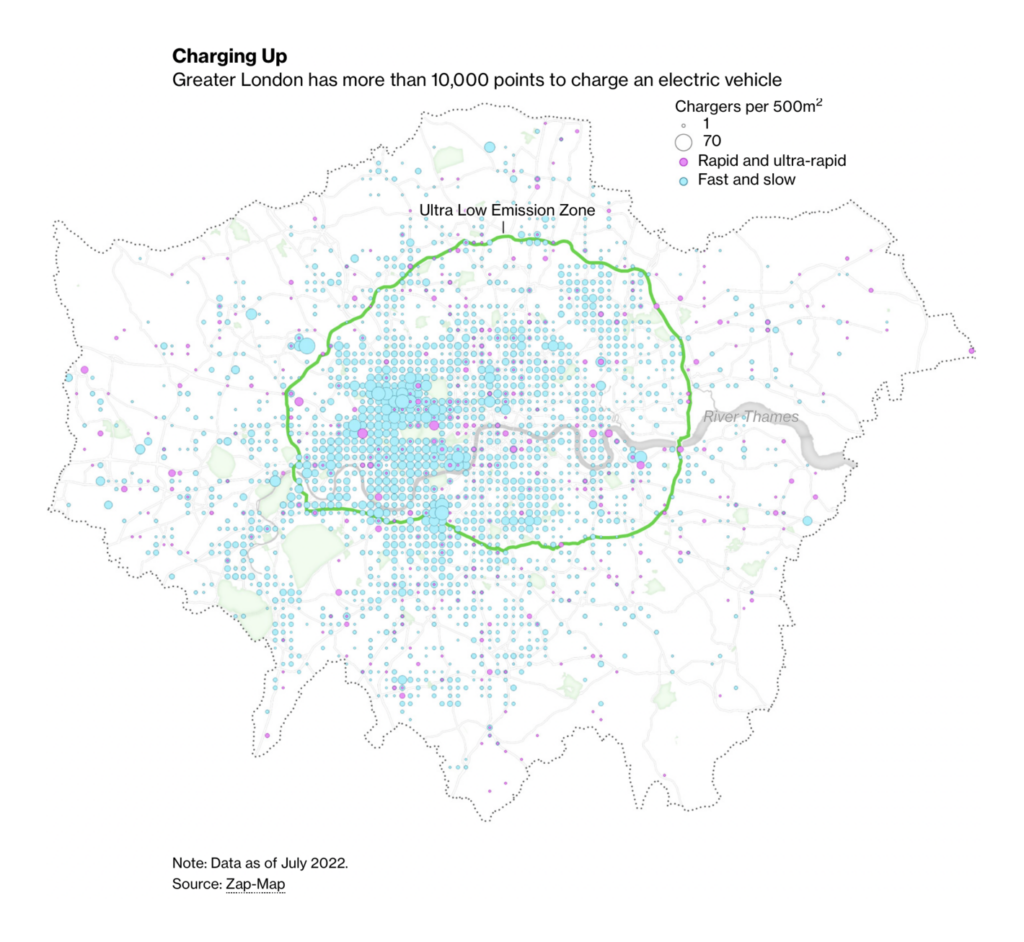
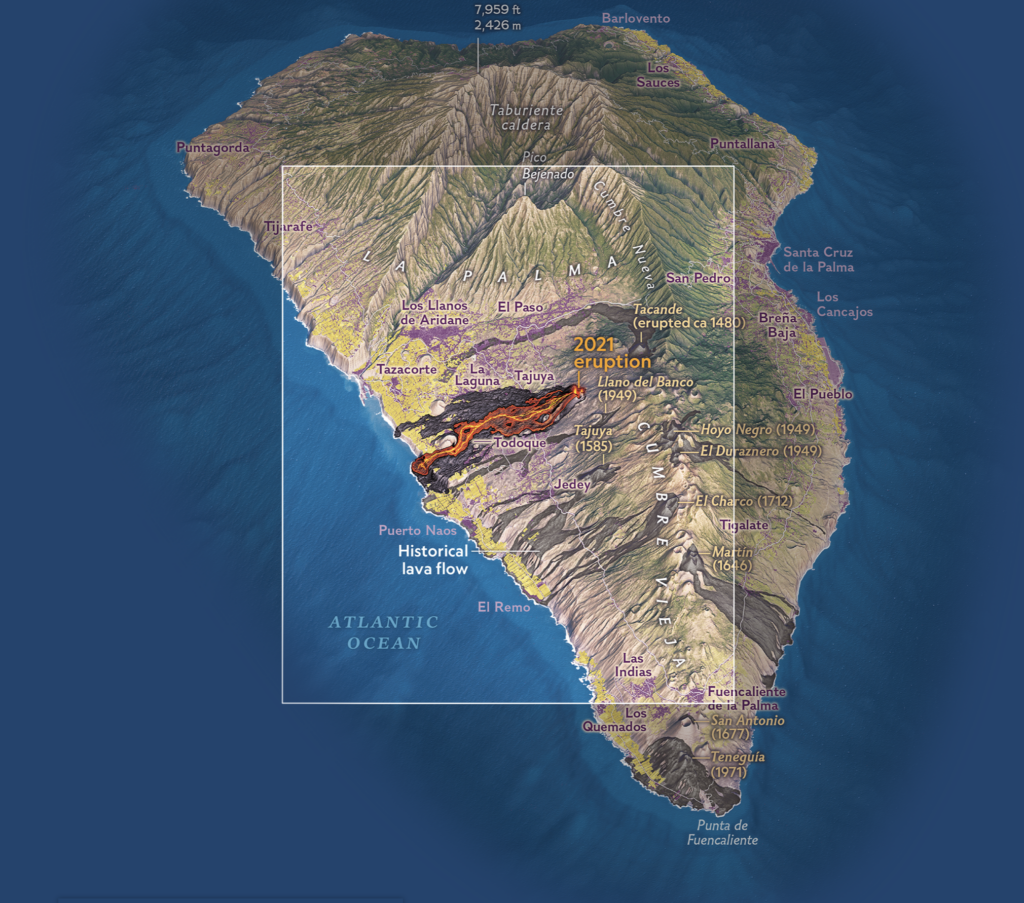
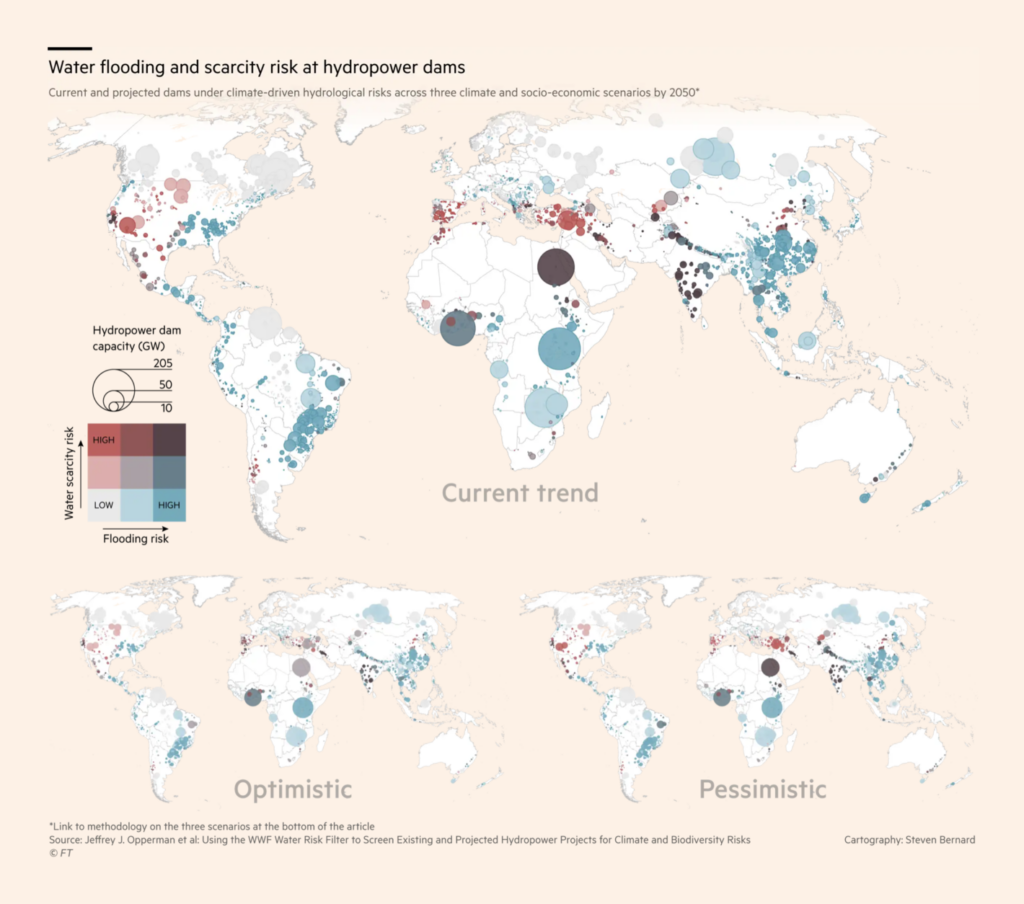
Maps covered topics from electric vehicles to dangerous dams:
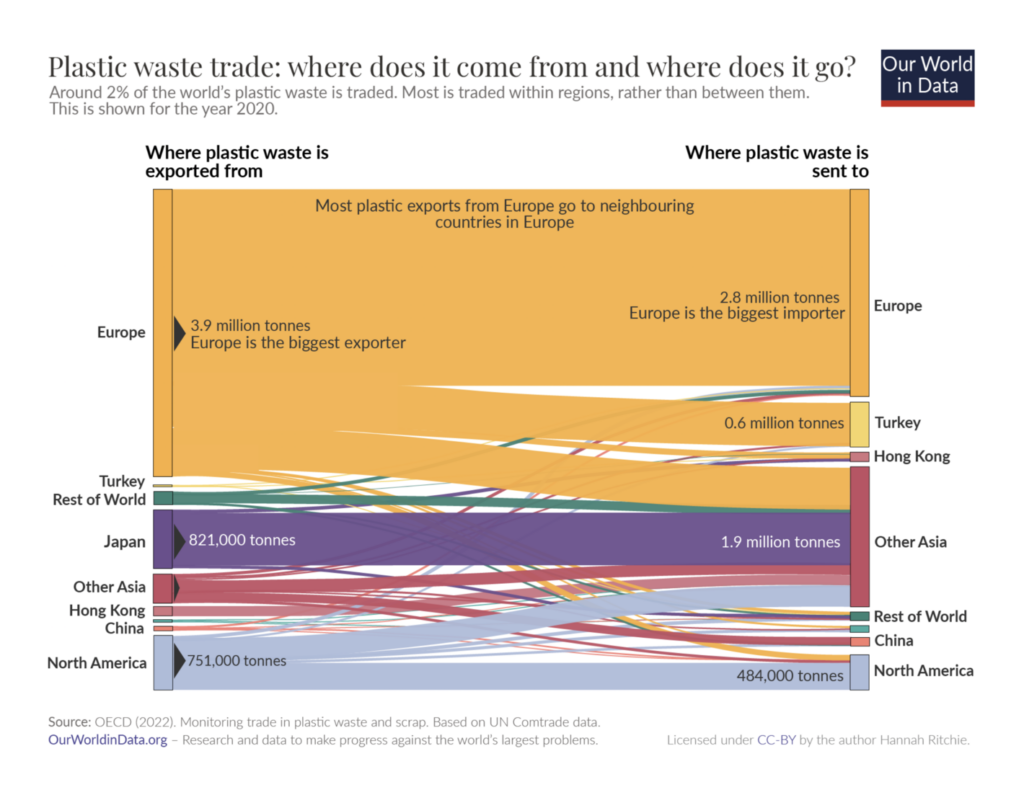
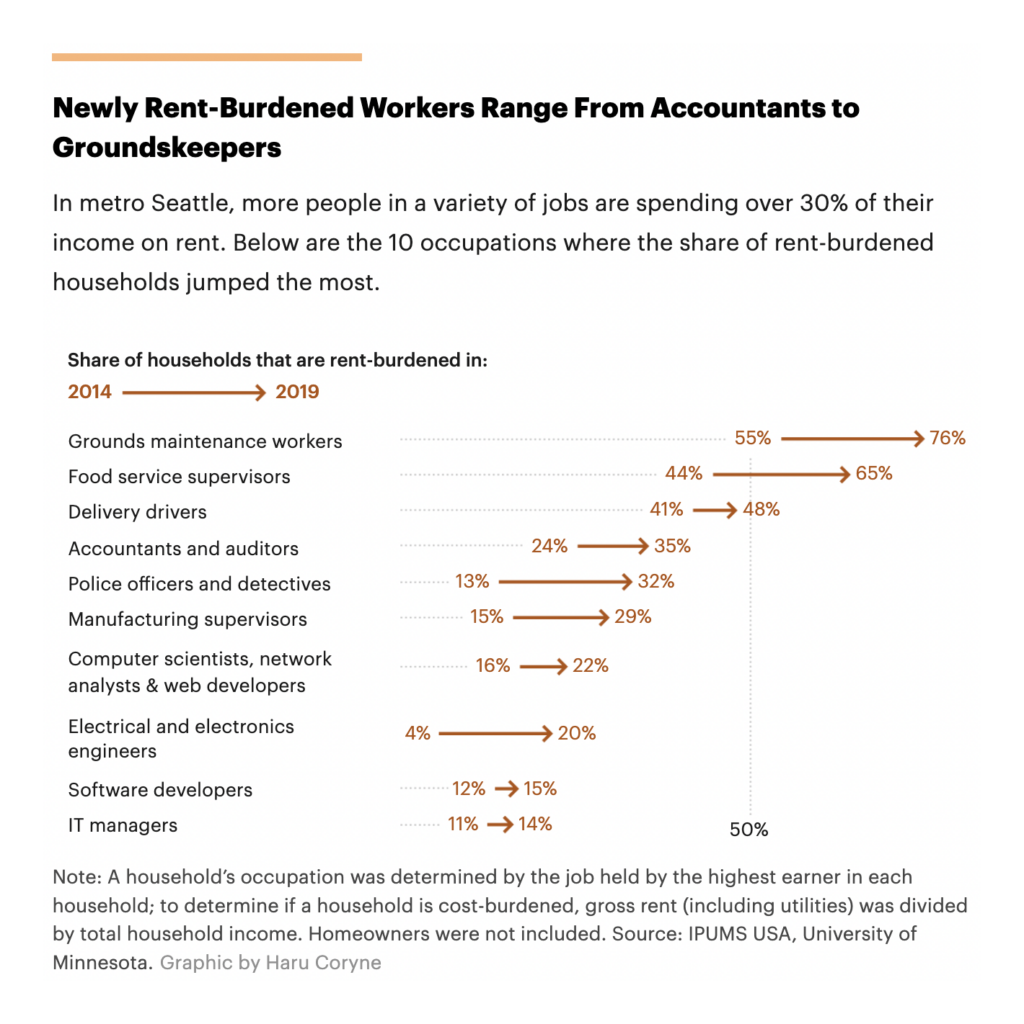
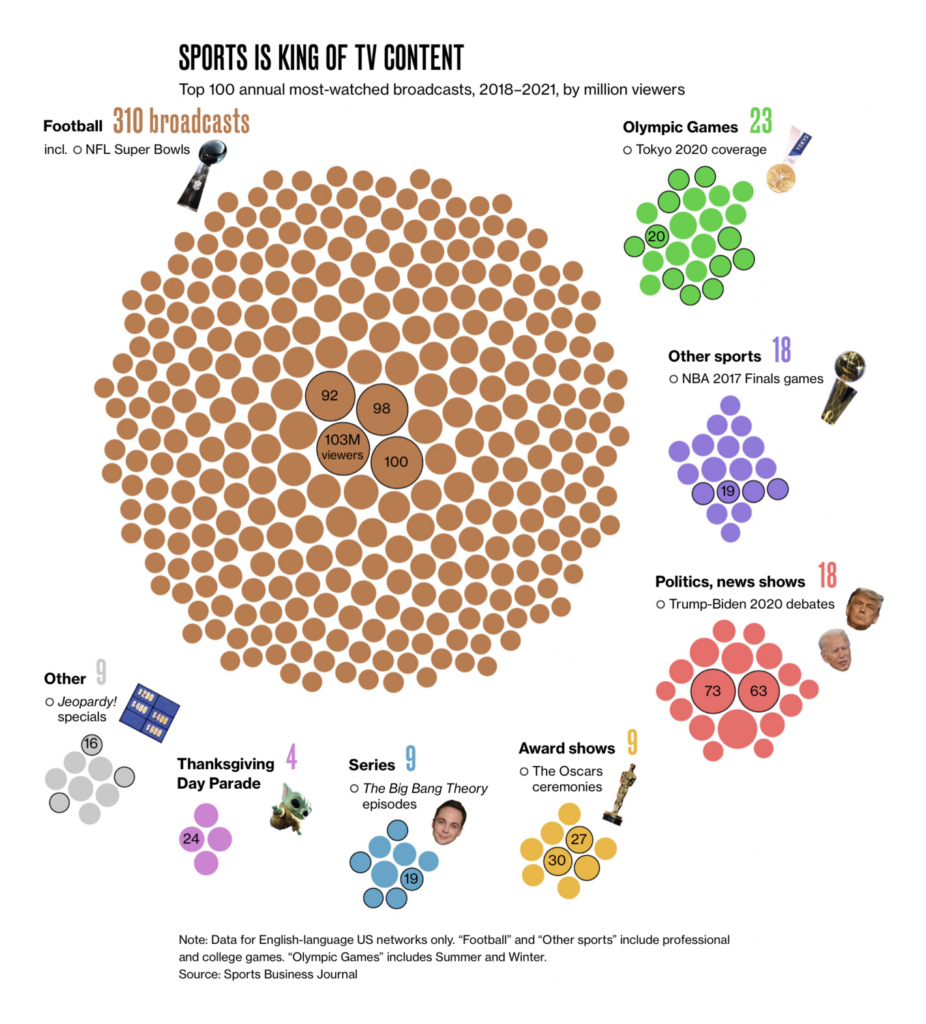
While other charts tackled everything from plastic waste to rent burdens to sports:

What else we found interesting


Applications are open for…
- A graphics/multimedia editor fo the weather team at The New York Times
- A data visualization developer at Reuters (Singapore)
- A graphics intern at Scientific American
Help us make this dispatch better! We’d love to hear which newsletters, blogs, or social media accounts we need to follow to learn about interesting projects, especially from less-covered parts of the world (Asia, South America, Africa). Write us at hello@datawrapper.de or leave a comment below.
Want the Dispatch in your inbox every Tuesday? Sign up for our Blog Update newsletter!


Comments