We want to enable everyone to create beautiful charts, maps, and tables. New to data visualization? Or do you have specific questions about us? You'll find all the answers here.
The best of last week’s big and small data visualizations
Vivien Serve
Welcome back to the 163rd edition of the Data Vis Dispatch! Every week, we publish a collection of the best small and large data visualizations we find, especially from news organizations — to celebrate data journalism, data visualization, simple charts, elaborate maps, and their creators.
Recurring topics this week include the anniversary of last year’s Hamas attack on Israel, the Brazilian elections, and teleportation.
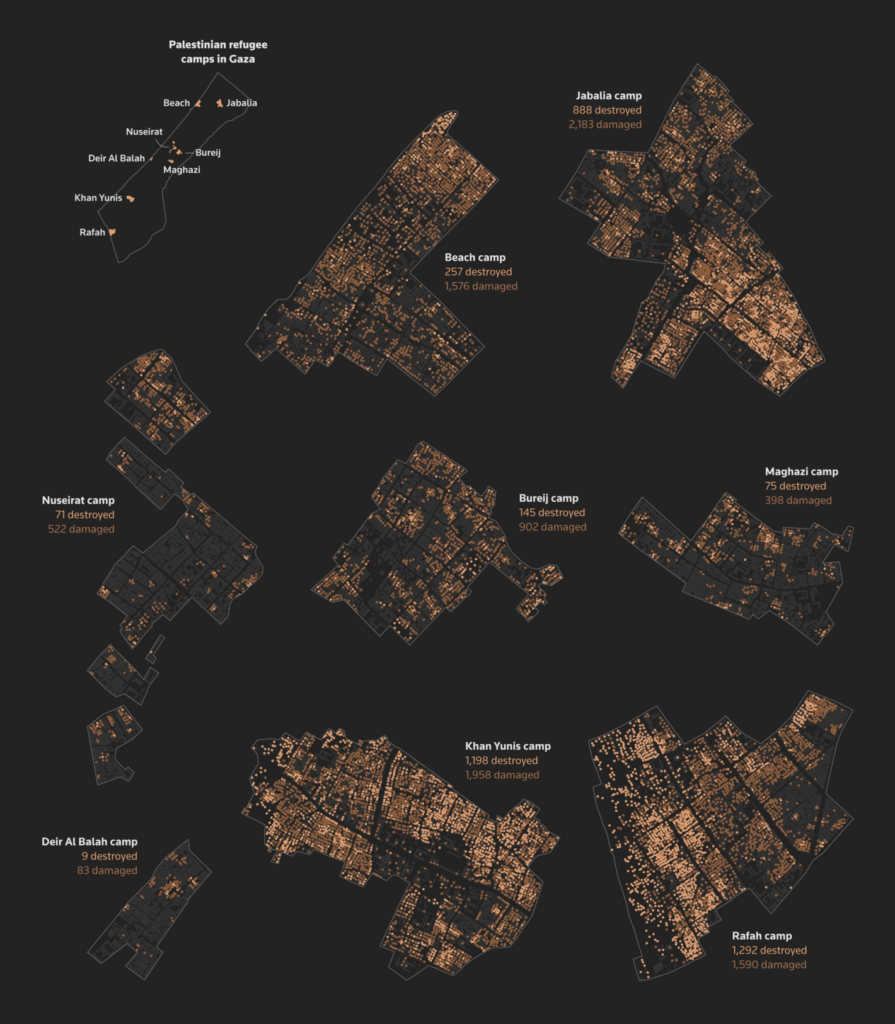
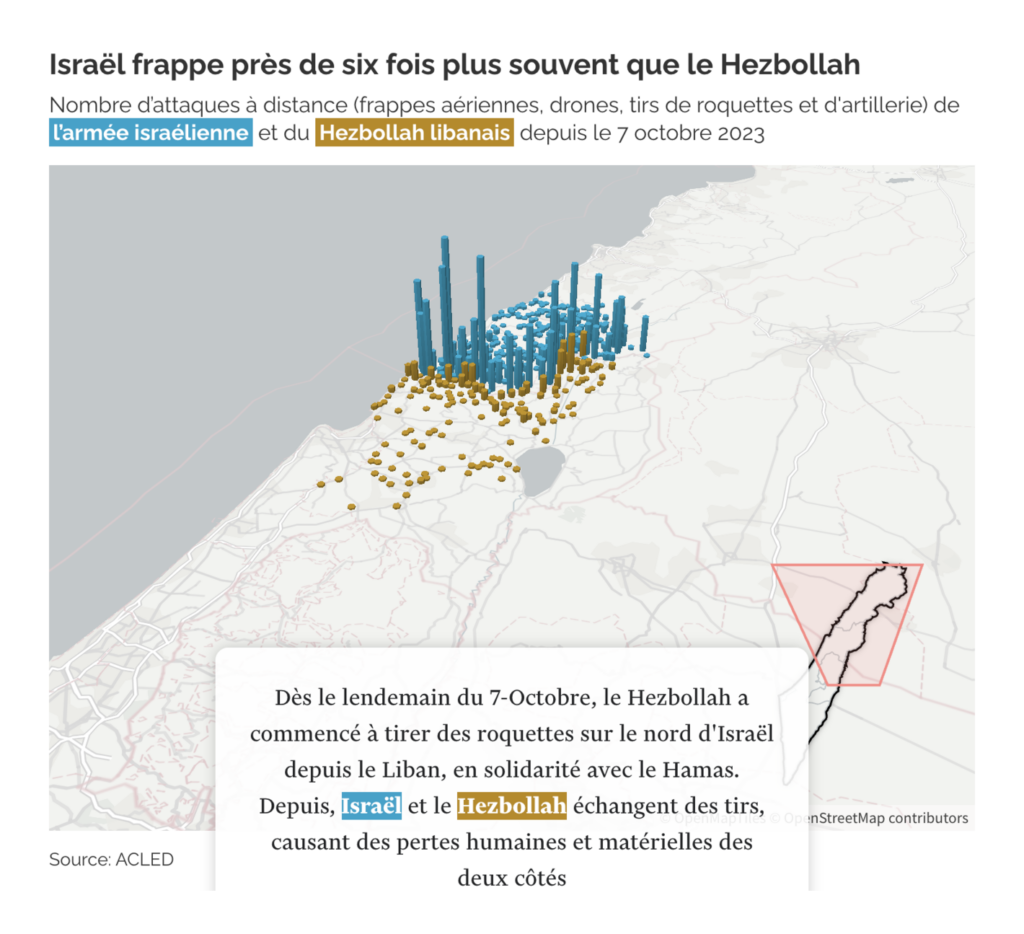
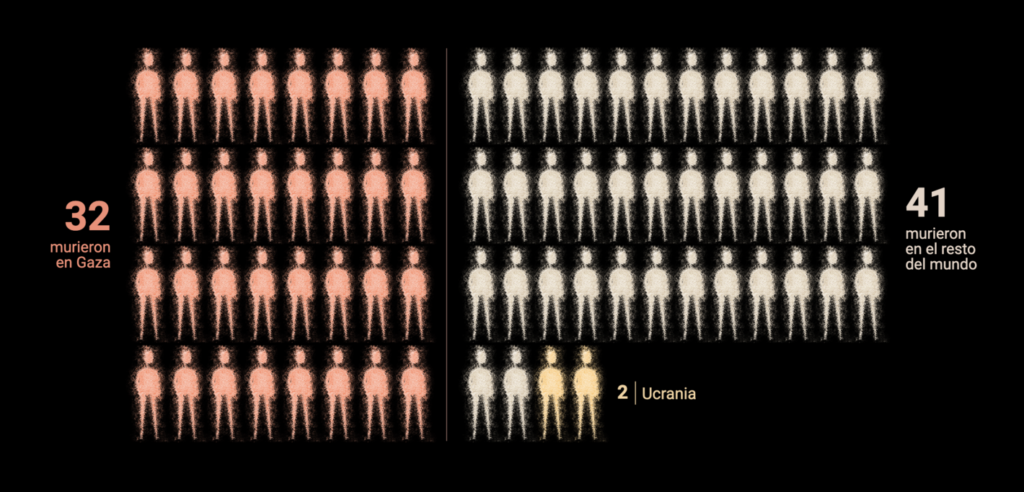
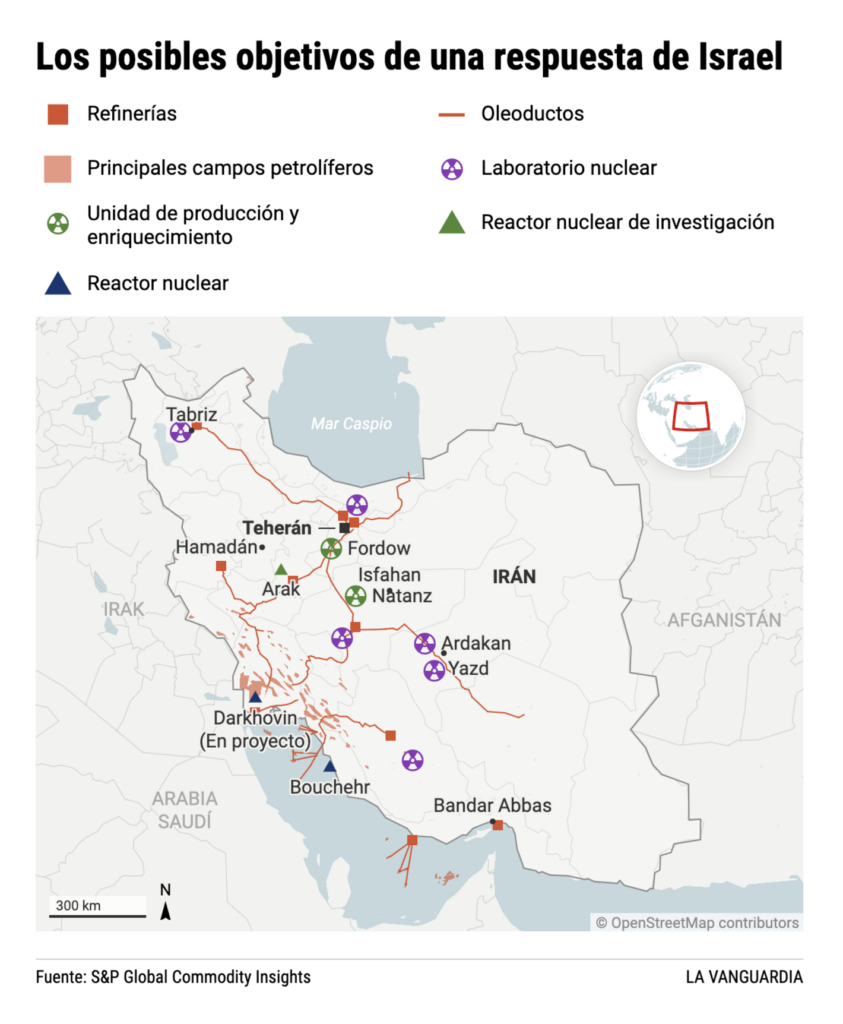
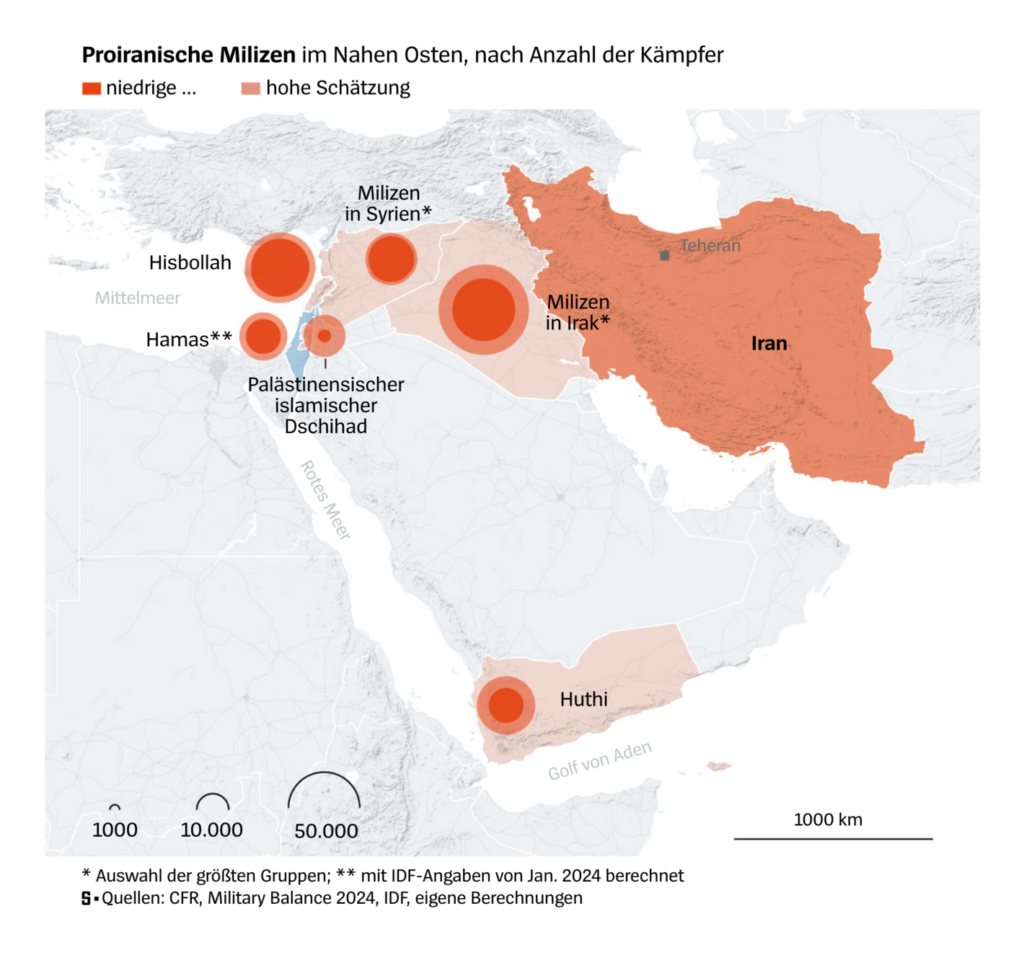
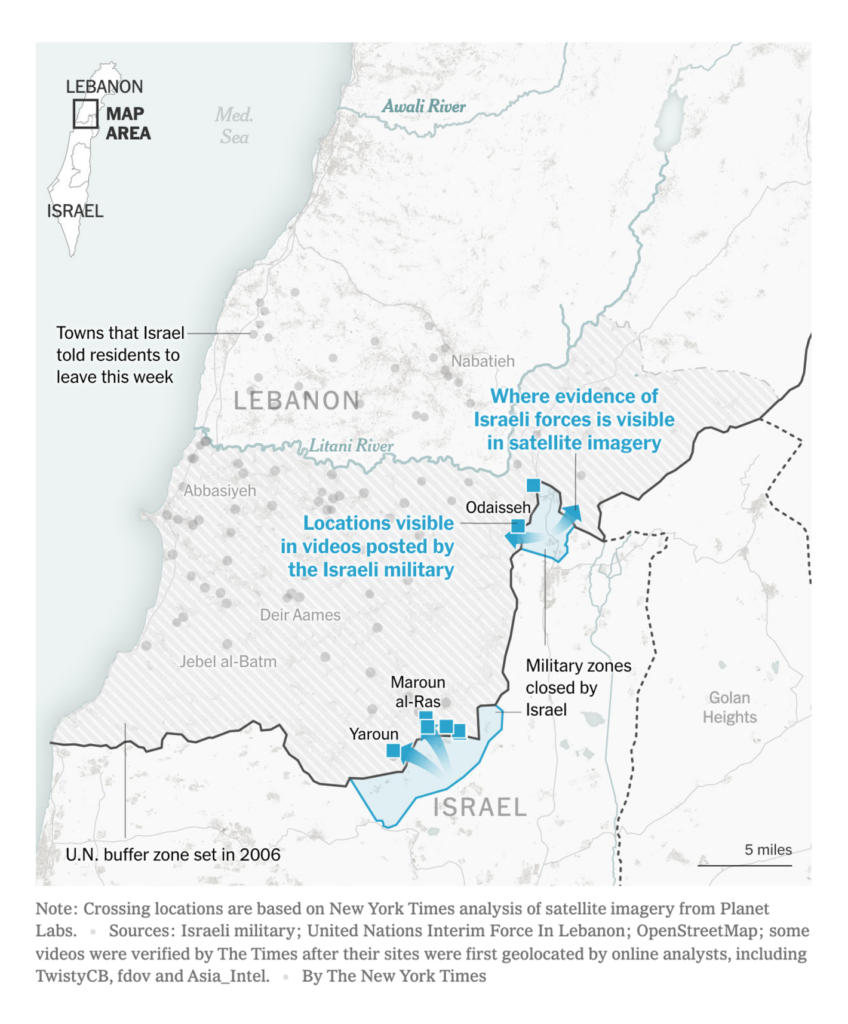
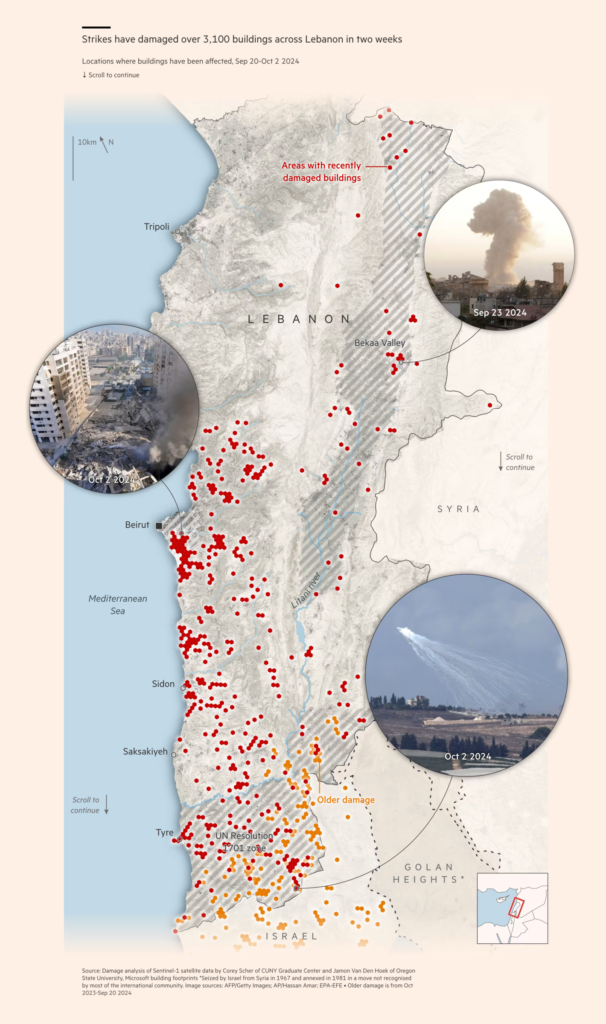
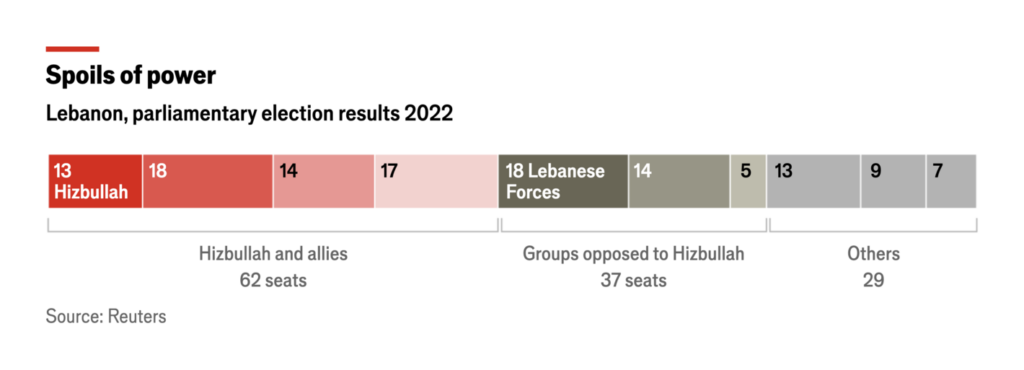
October 7 marked the one-year anniversary of Hamas’s attack on Israel, which set in motion a war that continues to engulf the region:
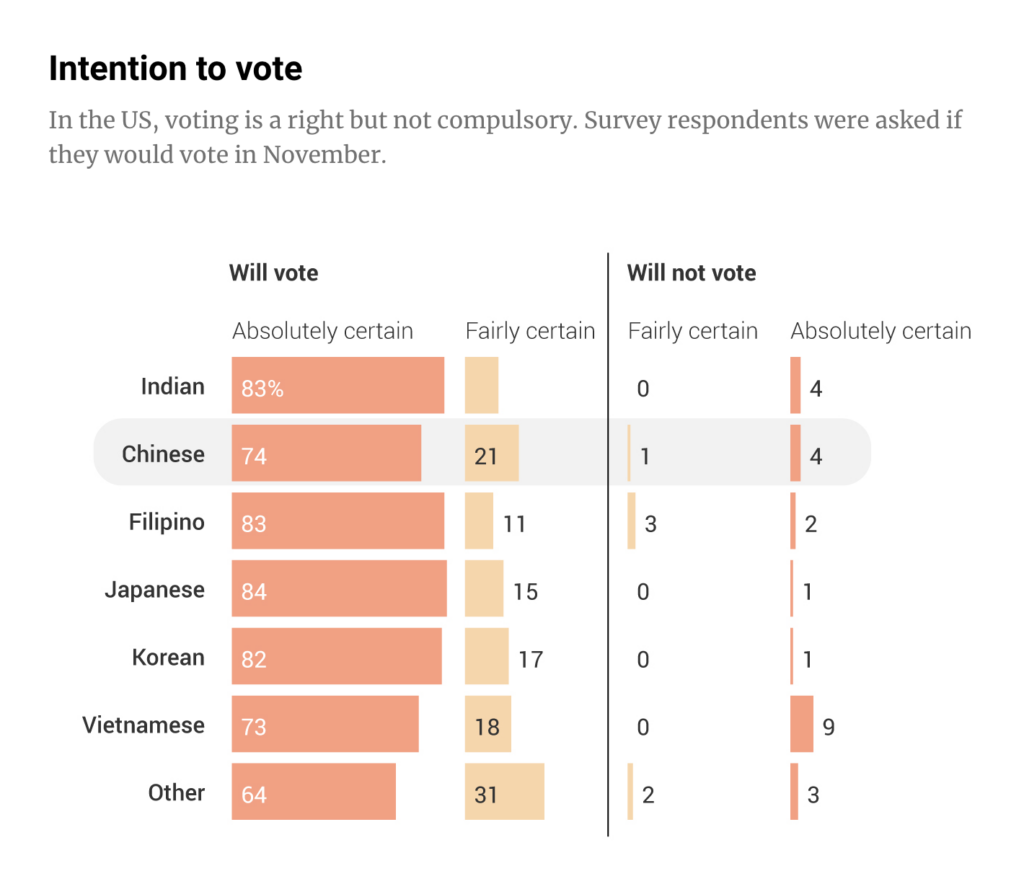
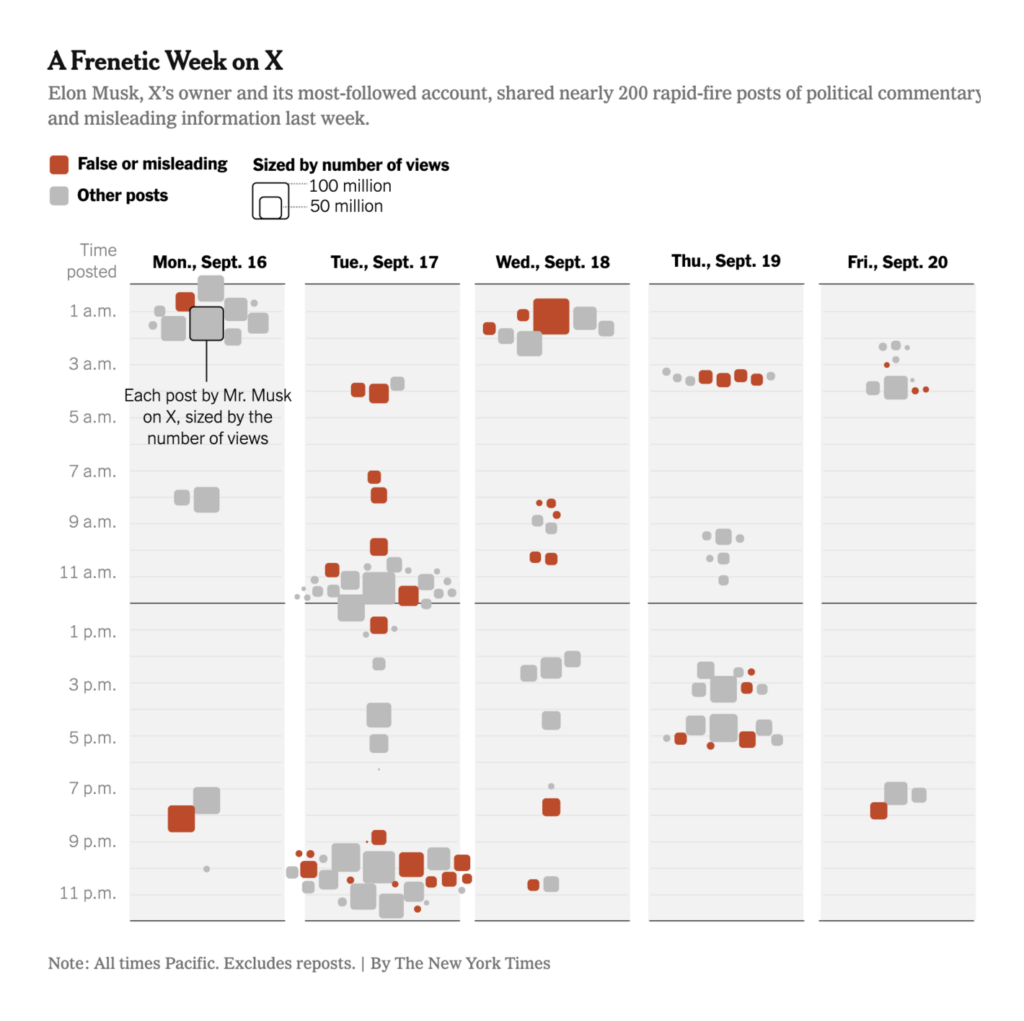
With just a month to go until Election Day in the U.S., two visualizations highlight the influence of Asian-American voters and… Elon Musk:
South China Morning Post: Rise of Asian-American voters in US elections, October 3 Sander van der Linden: “5 Days with @elonmusk! Almost a third of 171 posts last week were deemed false or misleading,” October 1 (Tweet, Article)
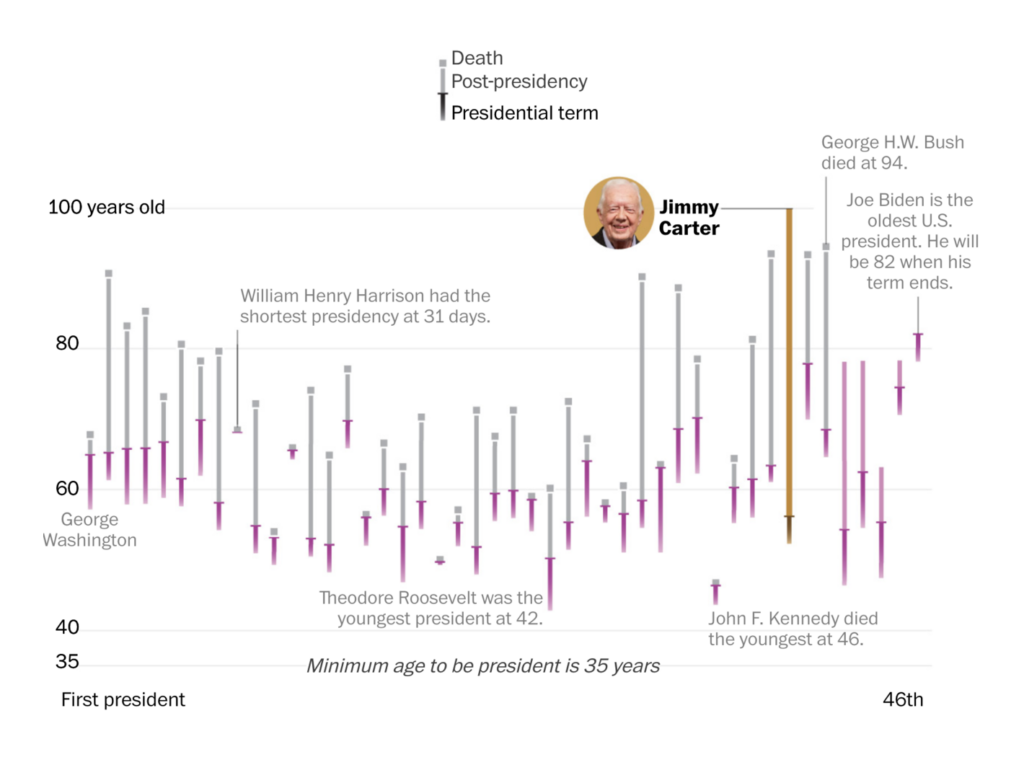
Not quite elections — Jimmy Carter is the first U.S. president to reach the age of 100. Did you know the odds of living to be that old? Less than 1%:
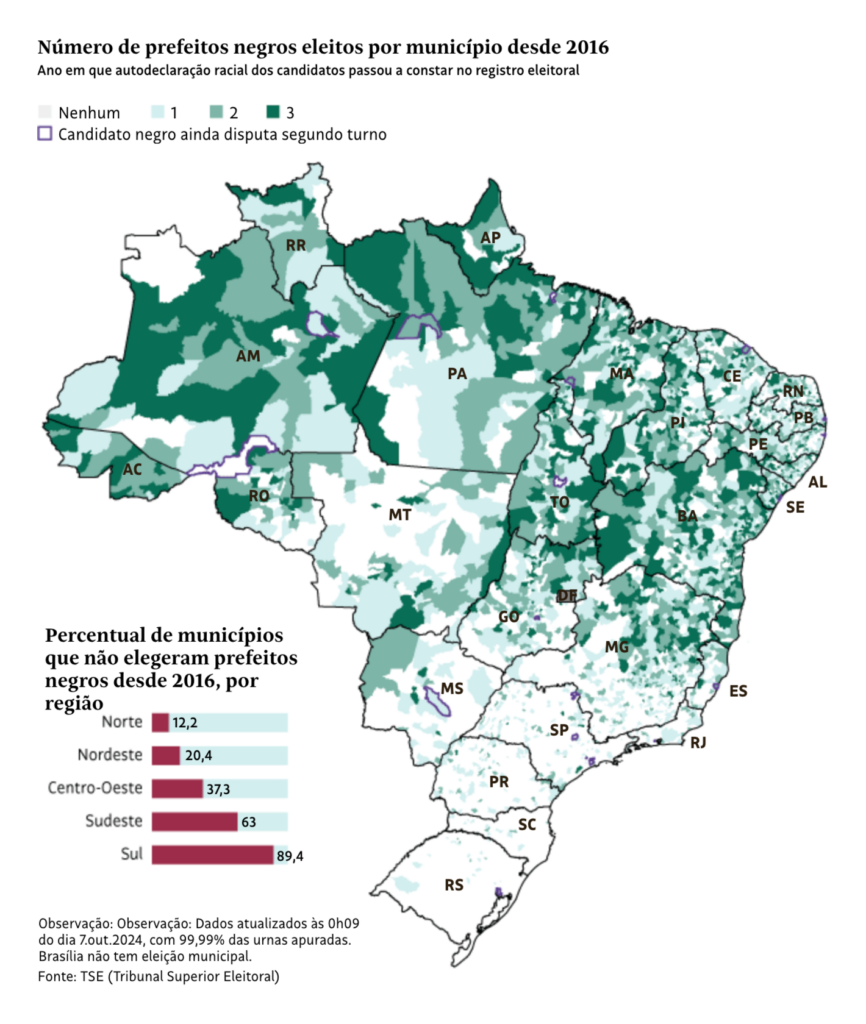
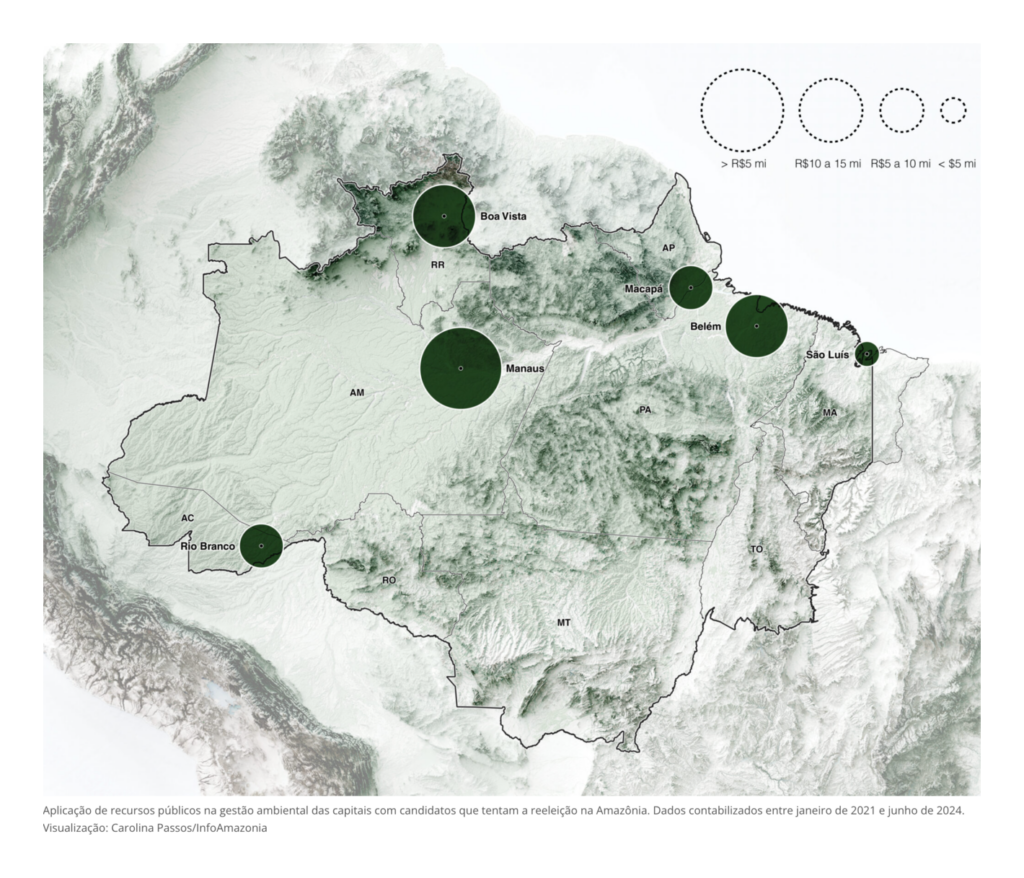
On October 6, Brazilians headed to the polls for municipal elections. Some, like the mayoral race in São Paulo, will be decided in a runoff on October 27. Visualizations covered the election of Black candidates and the outgoing administrations’ investment in environmental management:
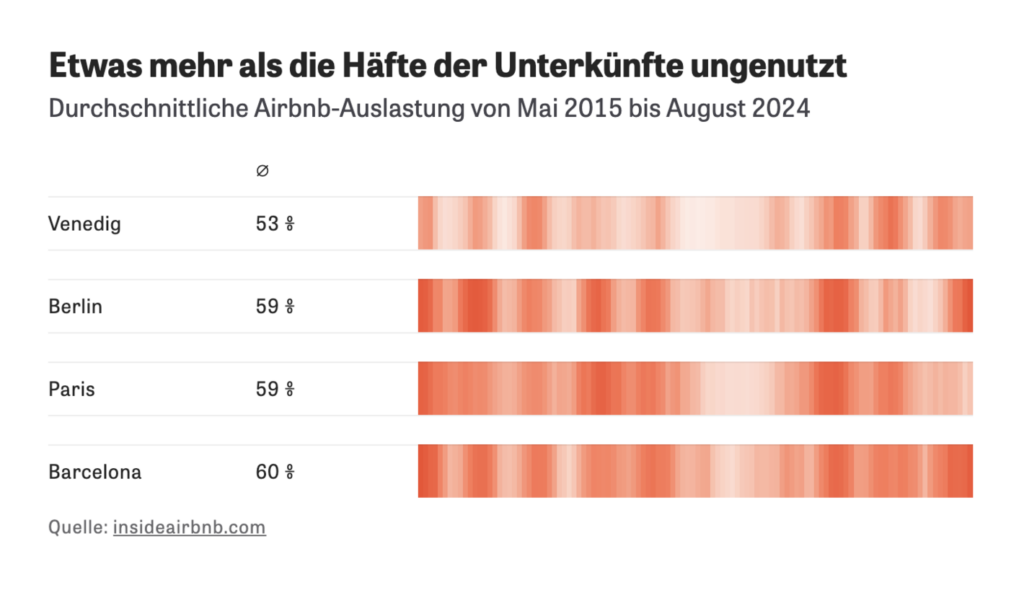
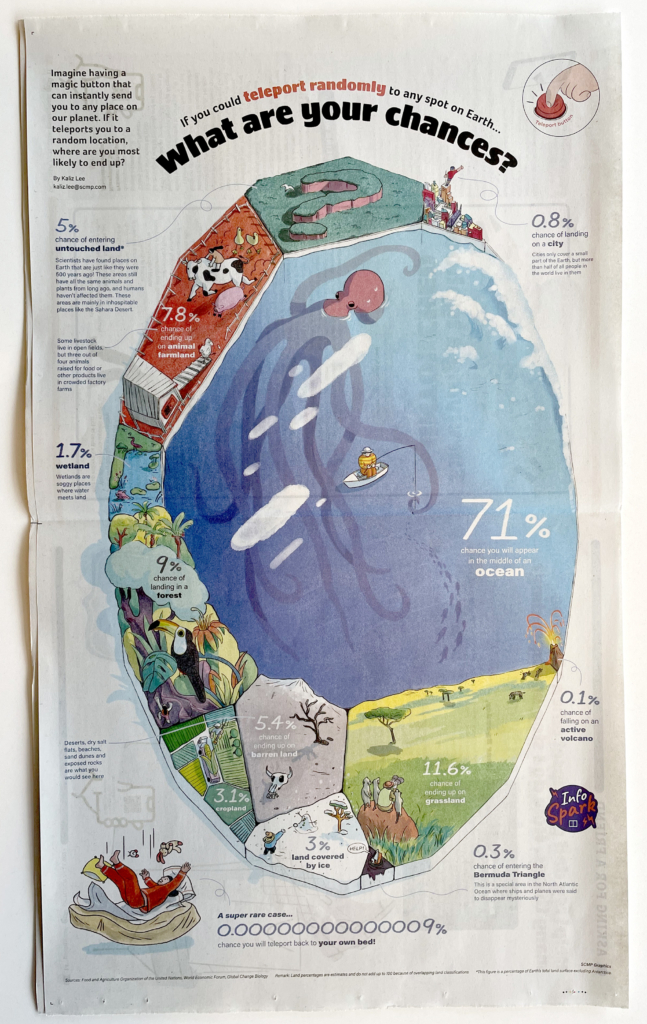
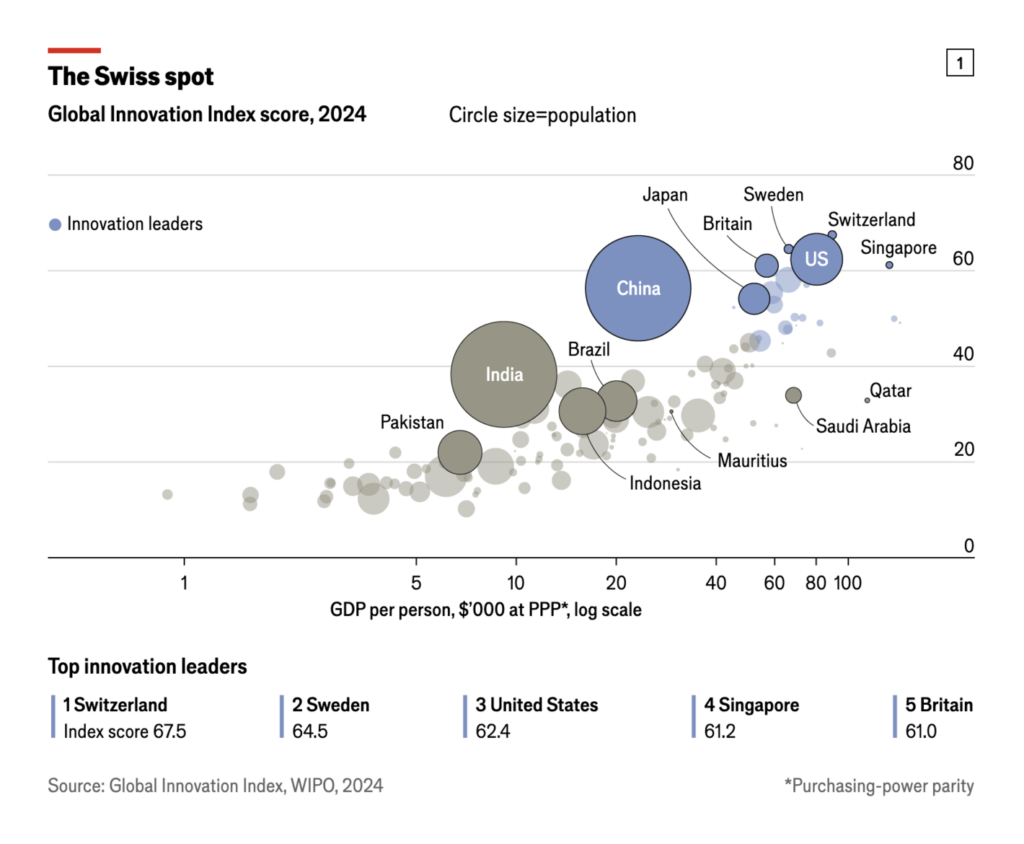
Last but not least, three visualizations that challenged our assumptions. What would you guess about how long most Airbnbs are actually used, where your chances of teleporting are highest, or which is the most innovative country on earth?
Zeit Online: Wie Airbnbs europäische Städte überfordern [Chart title: Slightly more than half of the accommodation unused], October 4 South China Morning Post: “Today Infospark is beautiful! find your copy to know what happens if you have a teleport button, by @KalizLee,” October 7 (Tweet) The Economist: The world’s most innovative country, October 3
Help us make this dispatch better! We’d love to hear which newsletters, blogs, or social media accounts we need to follow to learn about interesting projects, especially from less-covered parts of the world (Asia, South America, Africa). Write us at hello@datawrapper.de or leave a comment below.
(she/her) is a working student on Datawrapper’s Communications team. She creates the Data Vis Dispatch to keep data visualization enthusiasts up to date on exciting new projects. When she’s not working, she studies interface design, and when she’s not studying, she’s planning a festival stage or soldering light installations. Vivien lives in Potsdam.


Comments