We want to enable everyone to create beautiful charts, maps, and tables. New to data visualization? Or do you have specific questions about us? You'll find all the answers here.
The best of last week’s big and small data visualizations
Vivien Serve
Welcome back to the 160th edition of the Data Vis Dispatch! Every week, we publish a collection of the best small and large data visualizations we find, especially from news organizations — to celebrate data journalism, data visualization, simple charts, elaborate maps, and their creators.
Recurring topics this week include political division, floods, and basketball courts.
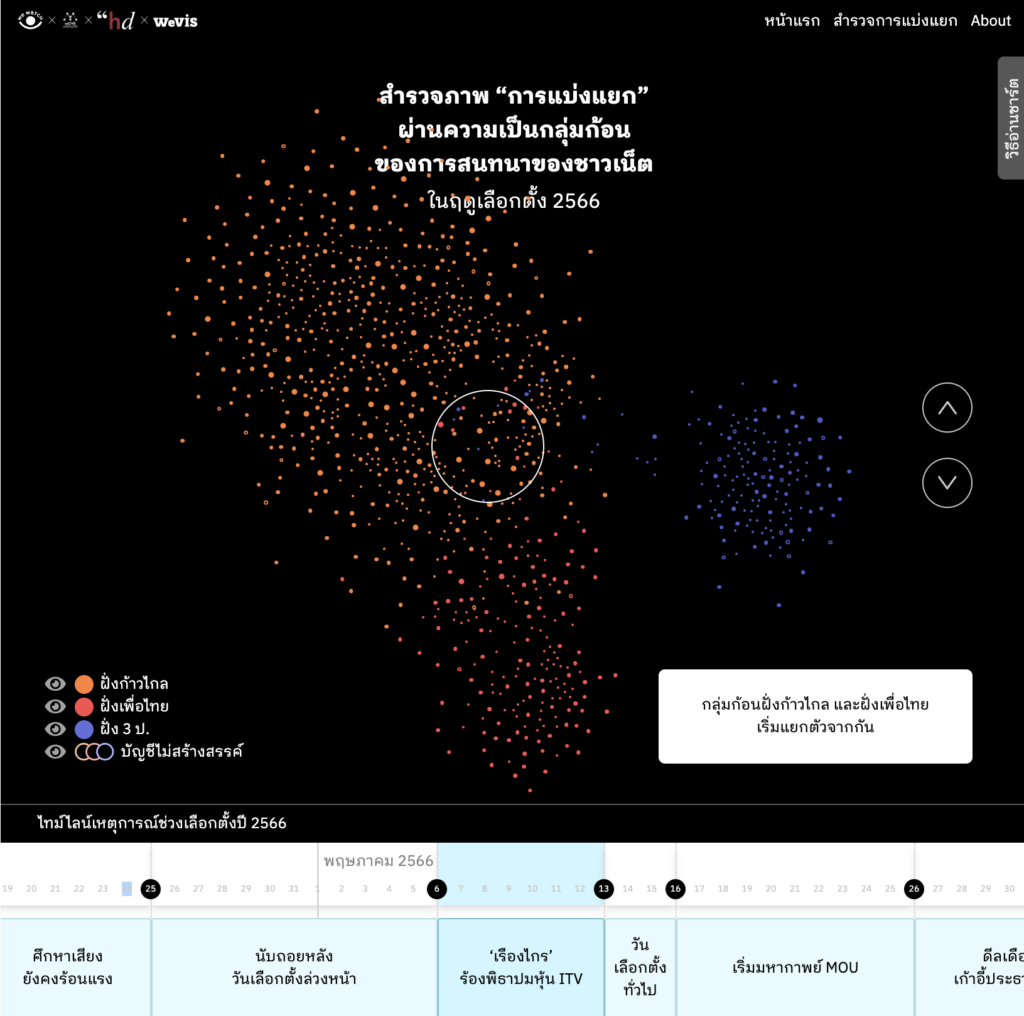
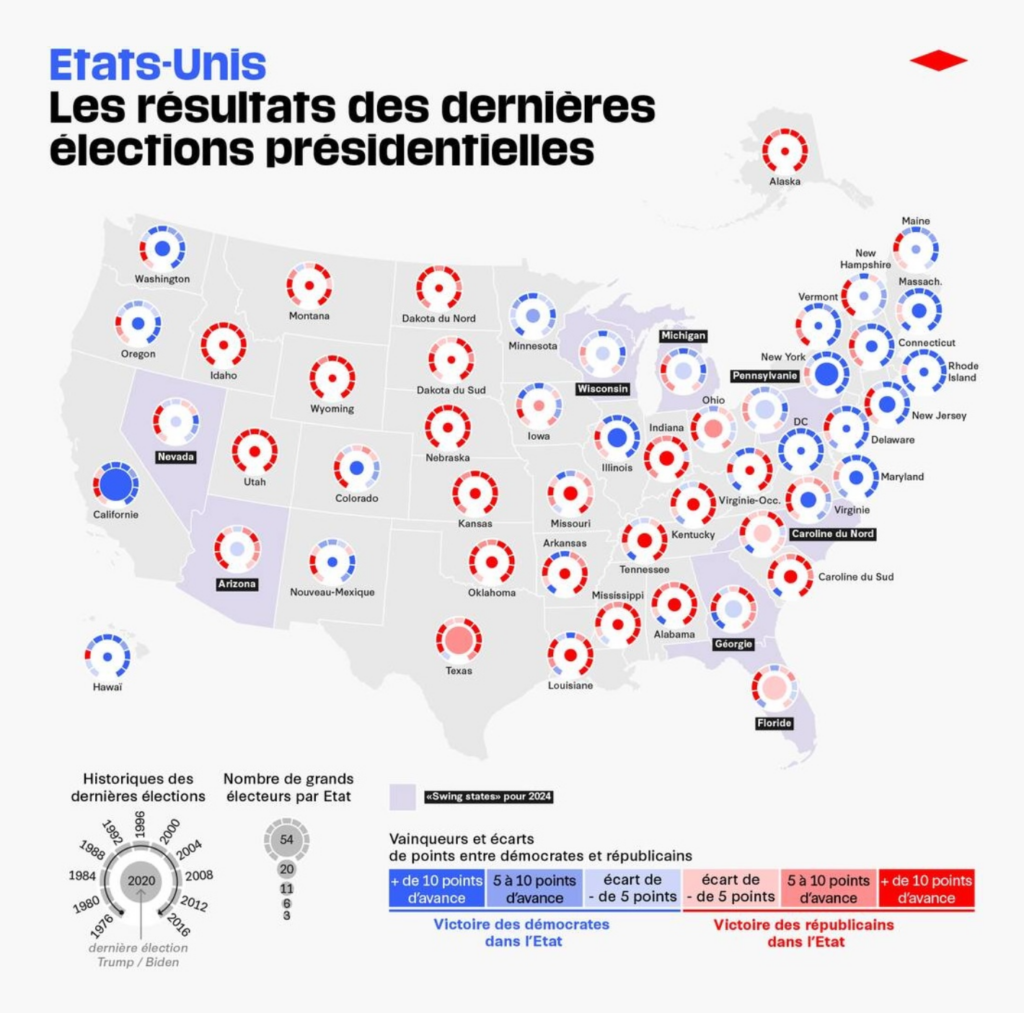
We talk a lot about elections in the Data Vis Dispatch, but today we’ll start with a deeper underlying theme that is often expressed in election results: the division in political conversations and the belief that political parties do not support the people of their country:
WeVis: YOU Can(‘t) Sit with US! เมื่อ “ฝั่งฝ่าย” เข้มข้น บทสนทนาก็ไม่ไปถึงไหน [YOU Can(‘t) Sit with US, When the “side” is intense, the conversation goes nowhere], September 16Juan Carlos de Jesús Ramírez González: “Qué Sensaciones Te Provoca La Política en el País” [How do you feel about politics in the country?], September 13 (Behance Post)
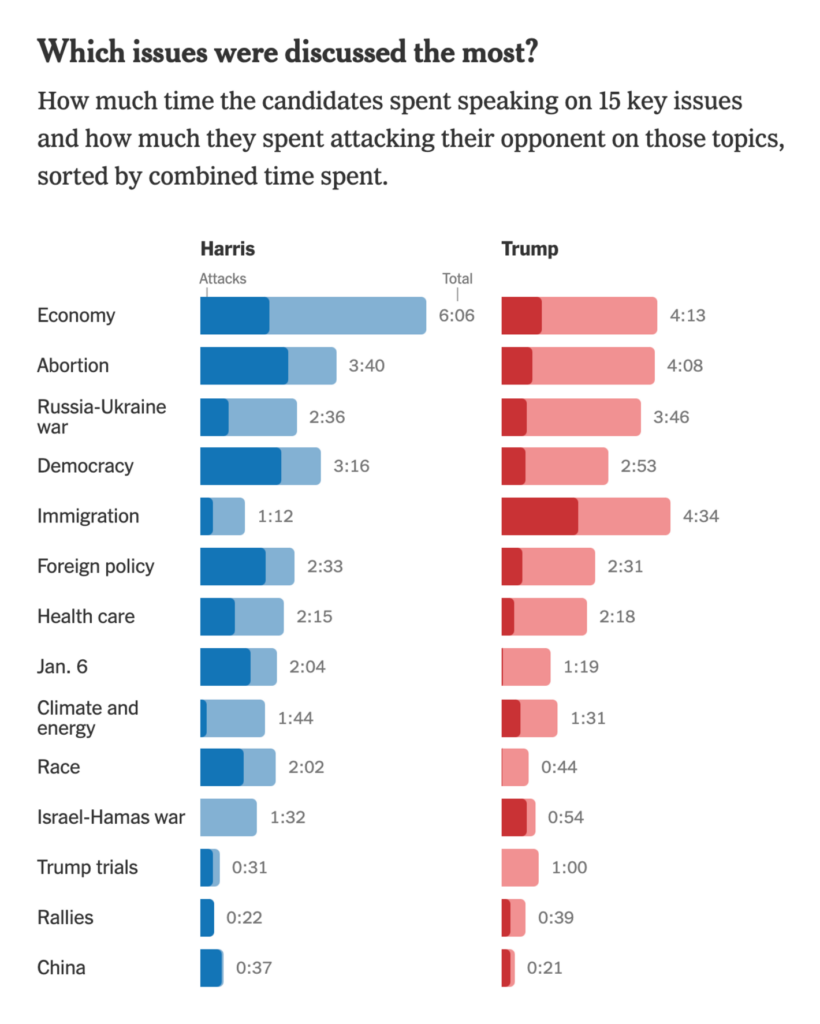
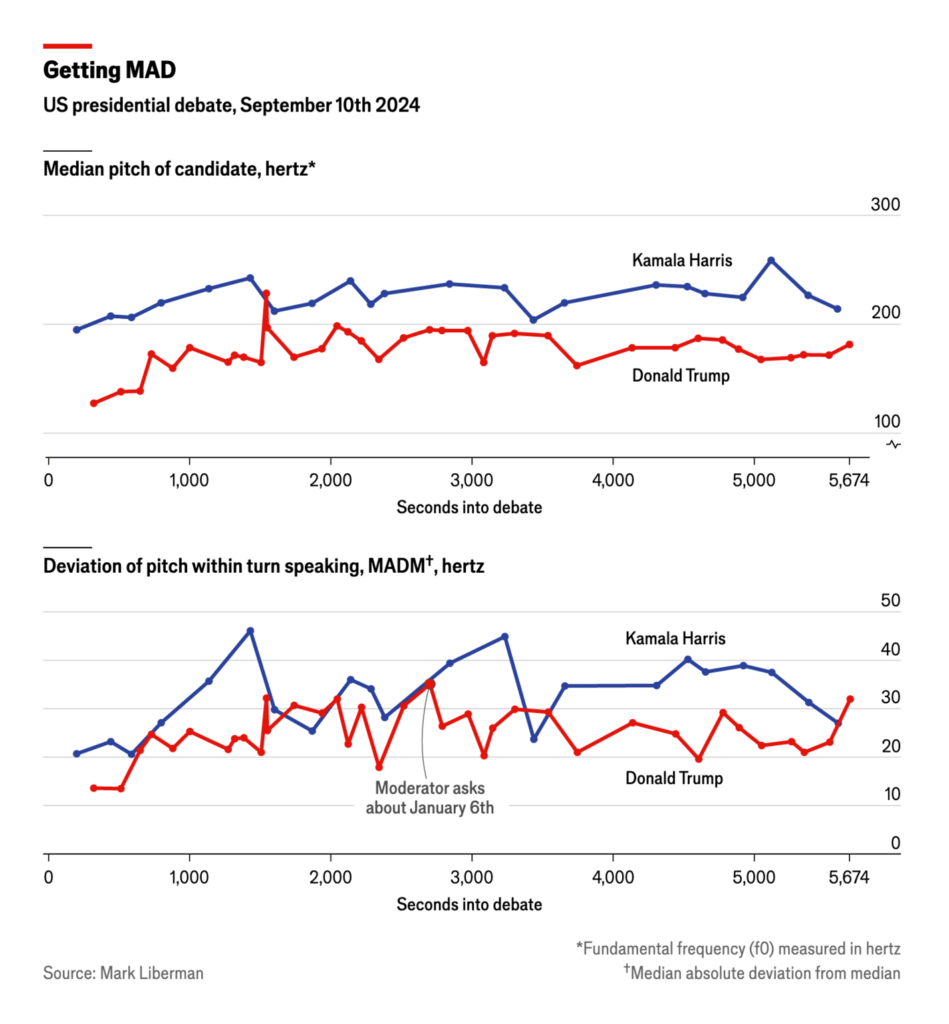
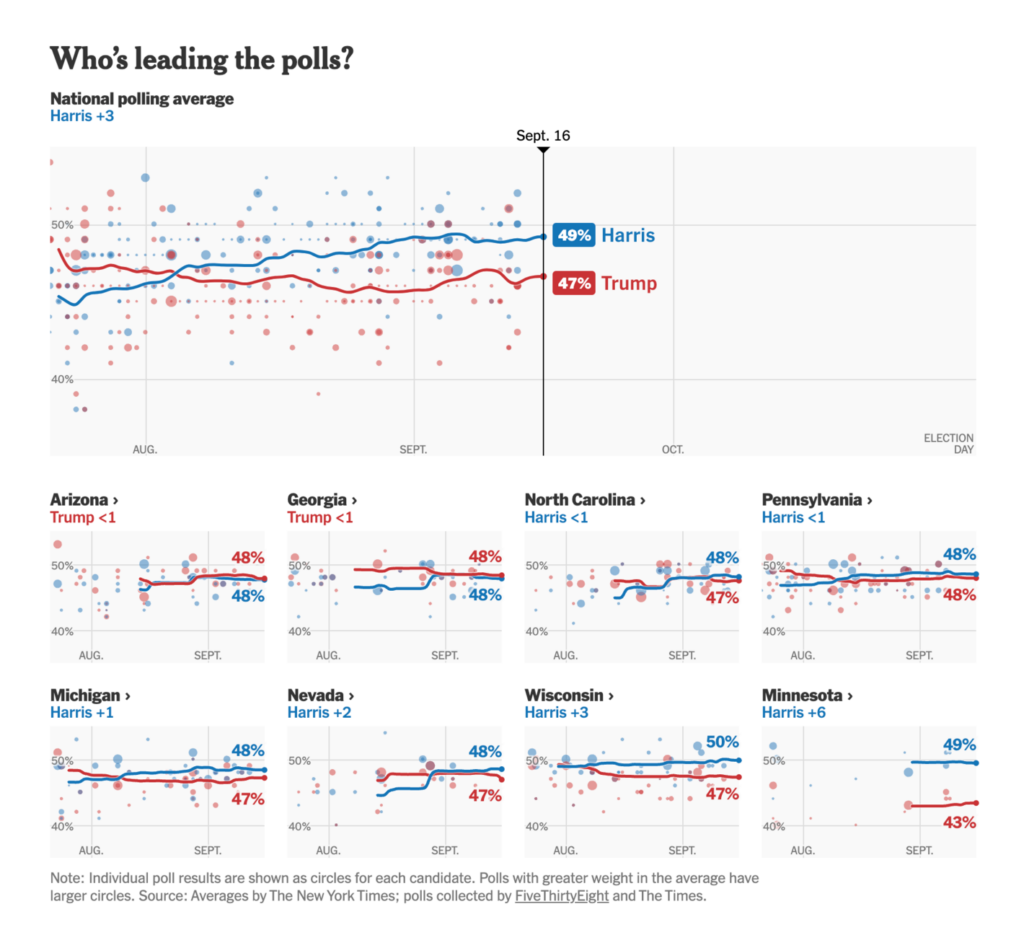
And now for the highly anticipated visualizations of the U.S. debate. These range from highlighting the most discussed issues and the percentage of attacks directed at Harris or Trump to analyzing the candidates’ vocal tones. Additionally, The Washington Post broke new ground by collecting real-time reactions from a group of undecided voters in swing states:
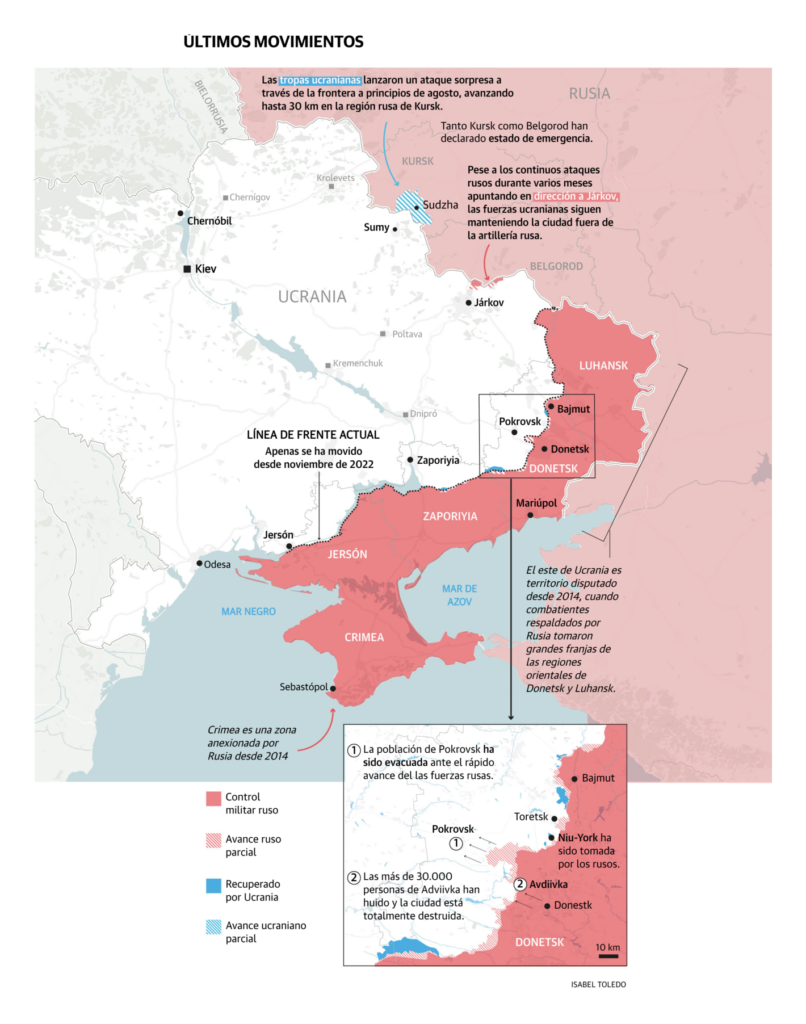
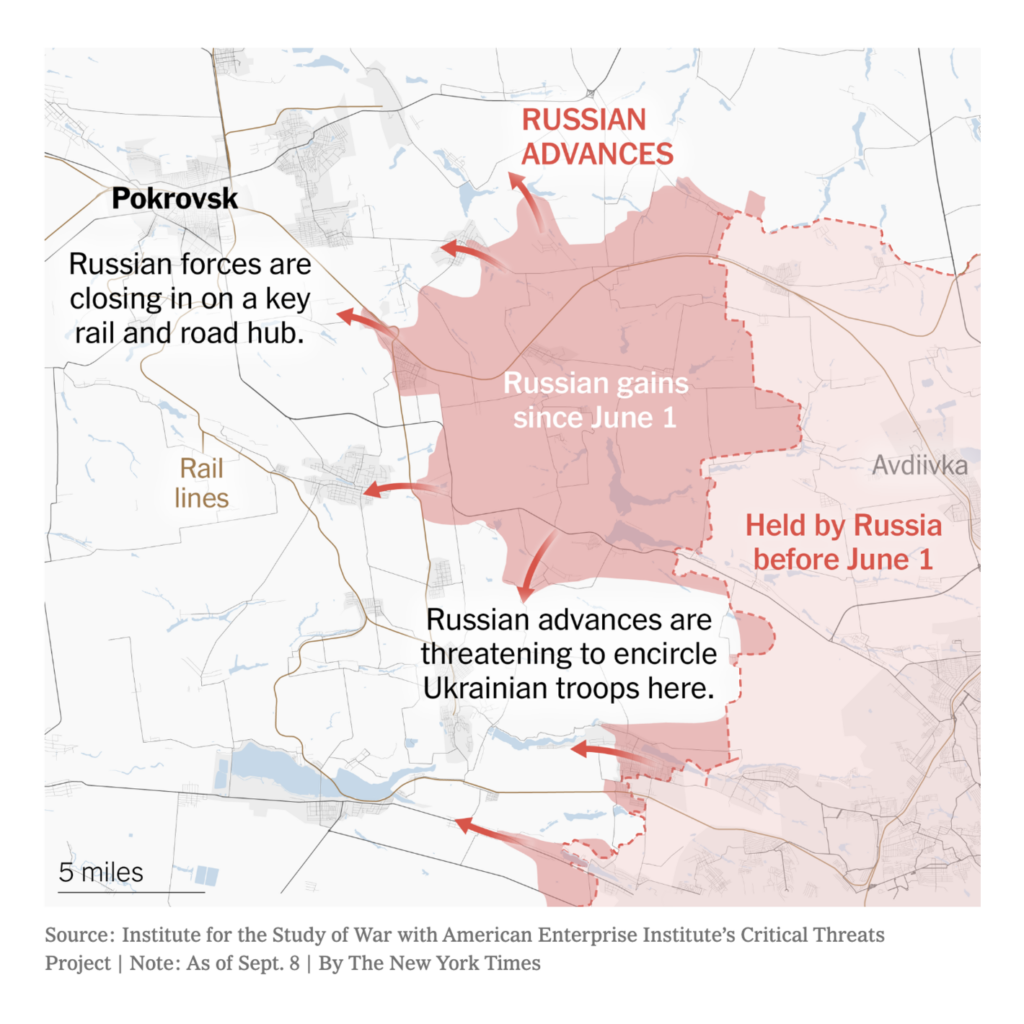
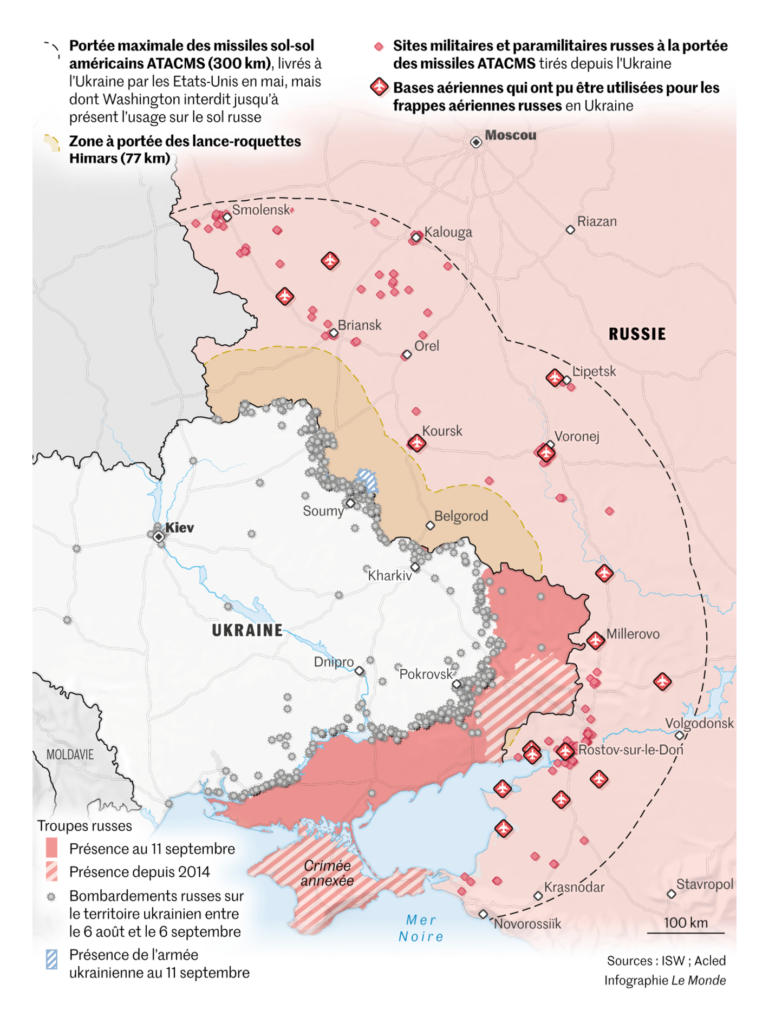
It’s been a while since we took the time to dedicate an entire cluster to the war between Russia and Ukraine, but it’s also been a while since we’ve seen the front lines shift as quickly as they have in recent weeks. This week saw the release of several new battleground maps:
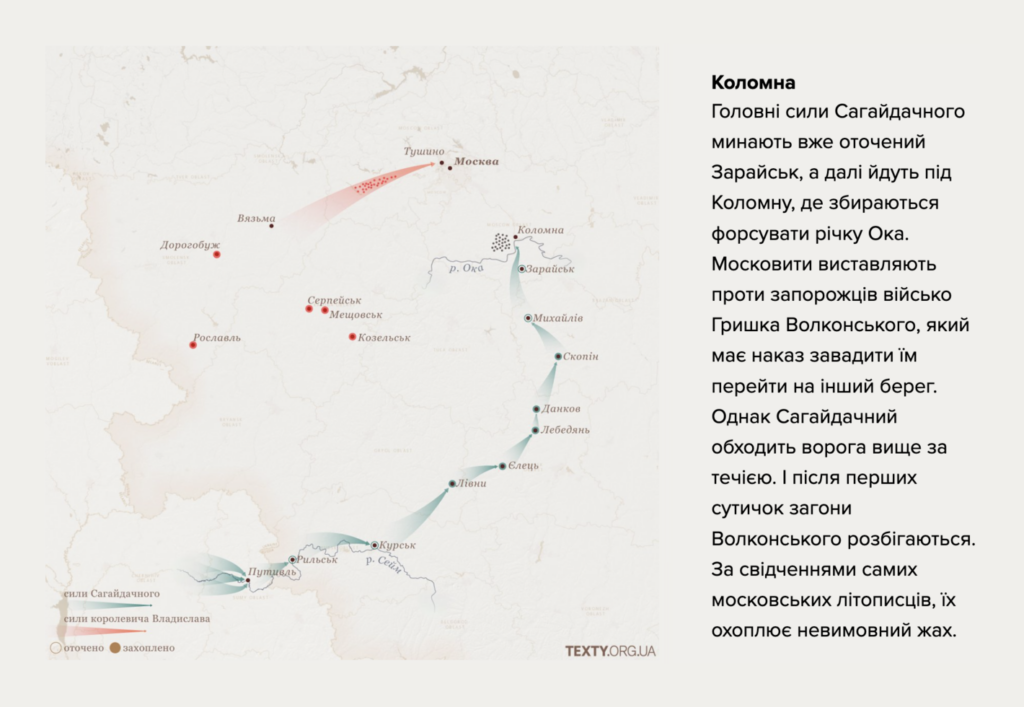
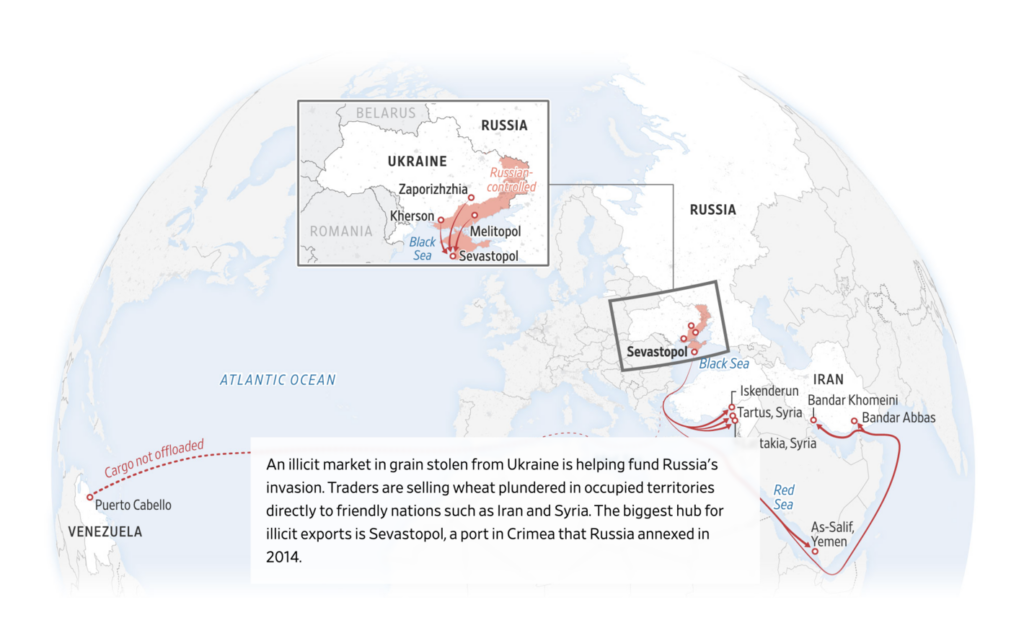
Other maps related to Russia and Ukraine cover Hetman Petro Sahaidachny’s 1618 campaign against Moscow, which draws parallels to the current war, as well as the sale of stolen Ukrainian grain by Russia on the global black market:
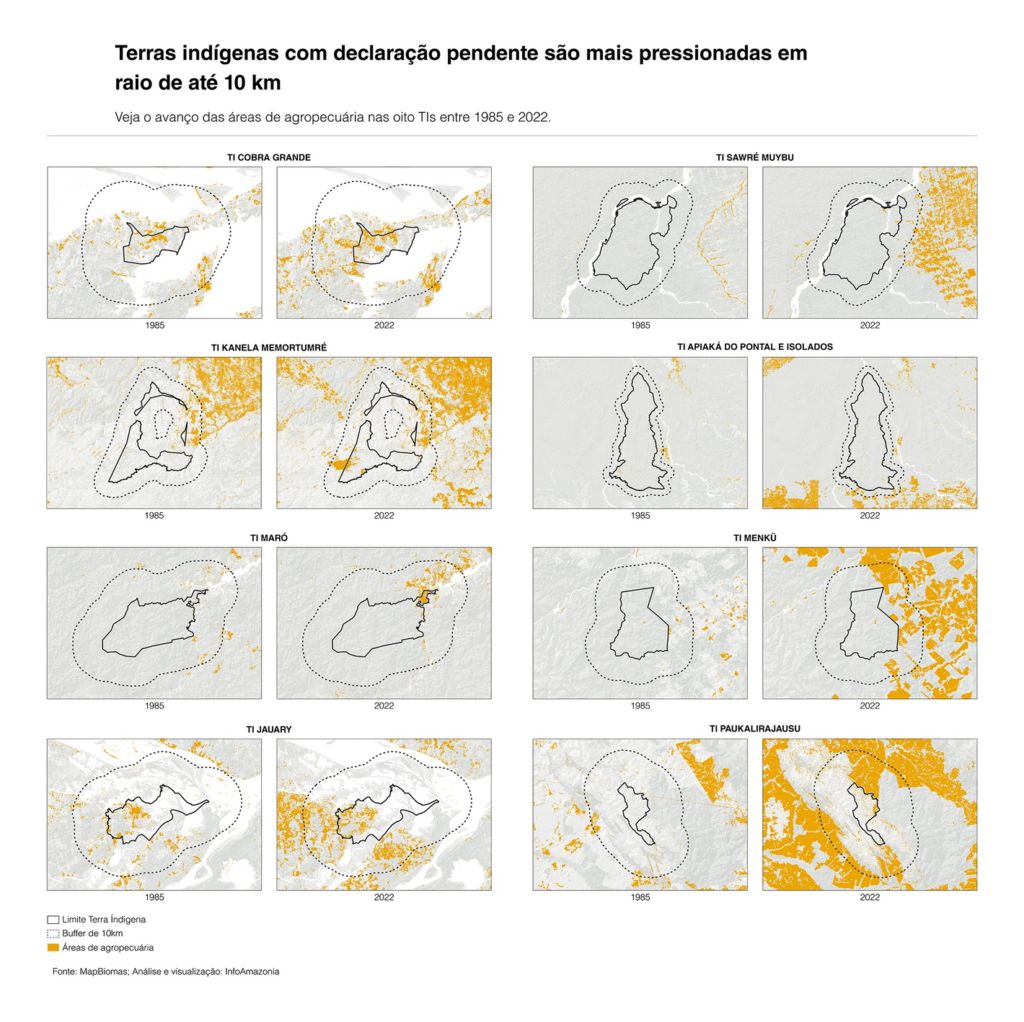
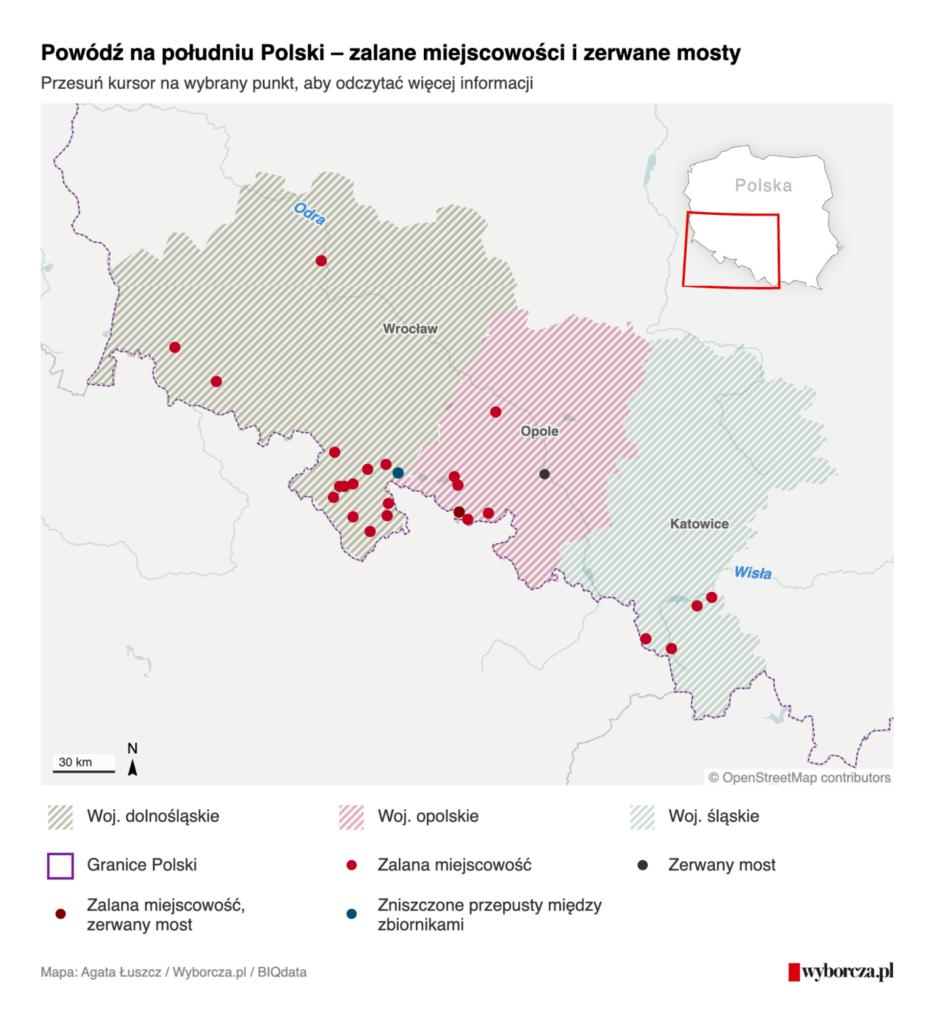
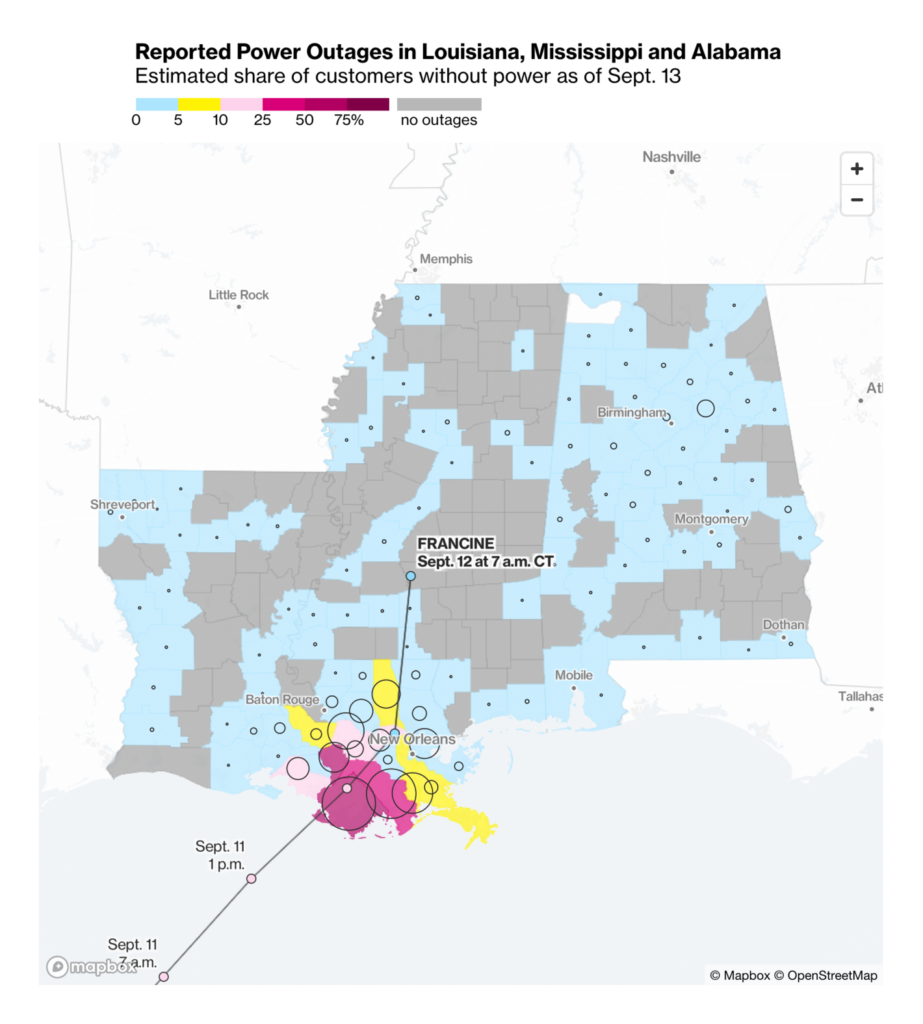
We’re not finished with maps yet. In the environment section, they reveal the story of unrecognized indigenous territories battling deforestation, the rising threat of floods in Eastern Europe, and the power outages caused by Hurricane Francine:
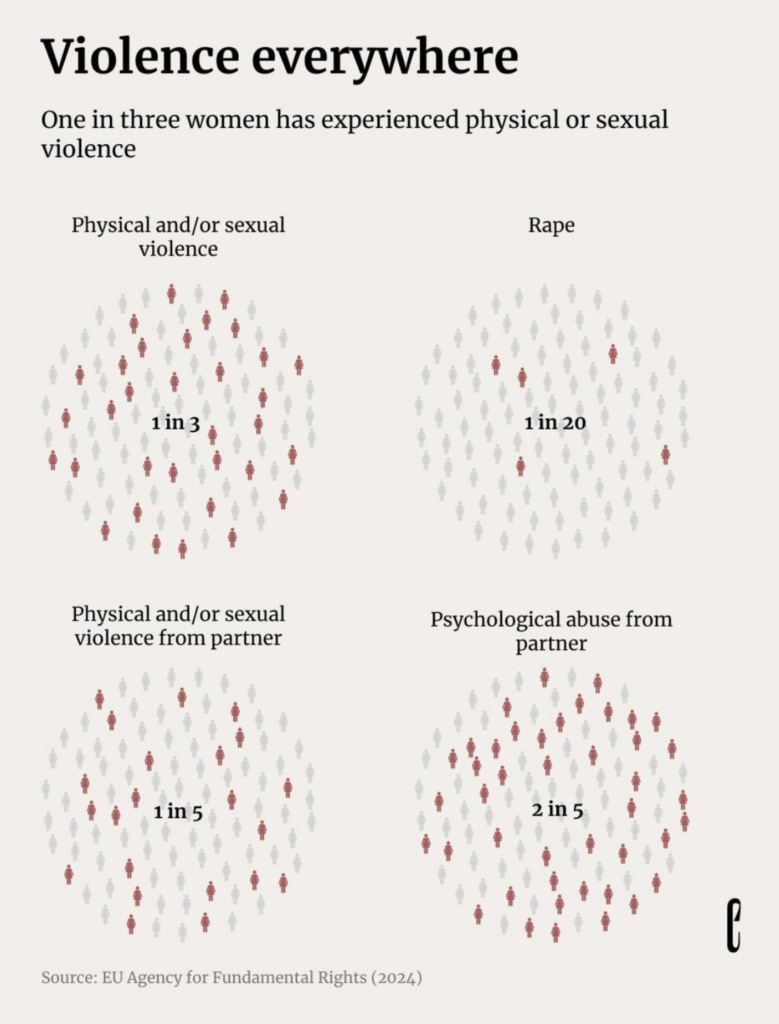
Sometimes the gravity of an issue and the vast number of those impacted are best conveyed through gaphics that illustrate the scale of those affected. Here are two examples: violence against women and the widespread suffering from tropical diseases:
theeuropeancorrespondent: “You likely know more than one woman who has experienced physical or sexual violence from her (ex) partner. You probably also know at least one woman who has been raped […],” September 12 (Instagram Post)Nexo Jornal: How we tackle neglected tropical diseases, September 12
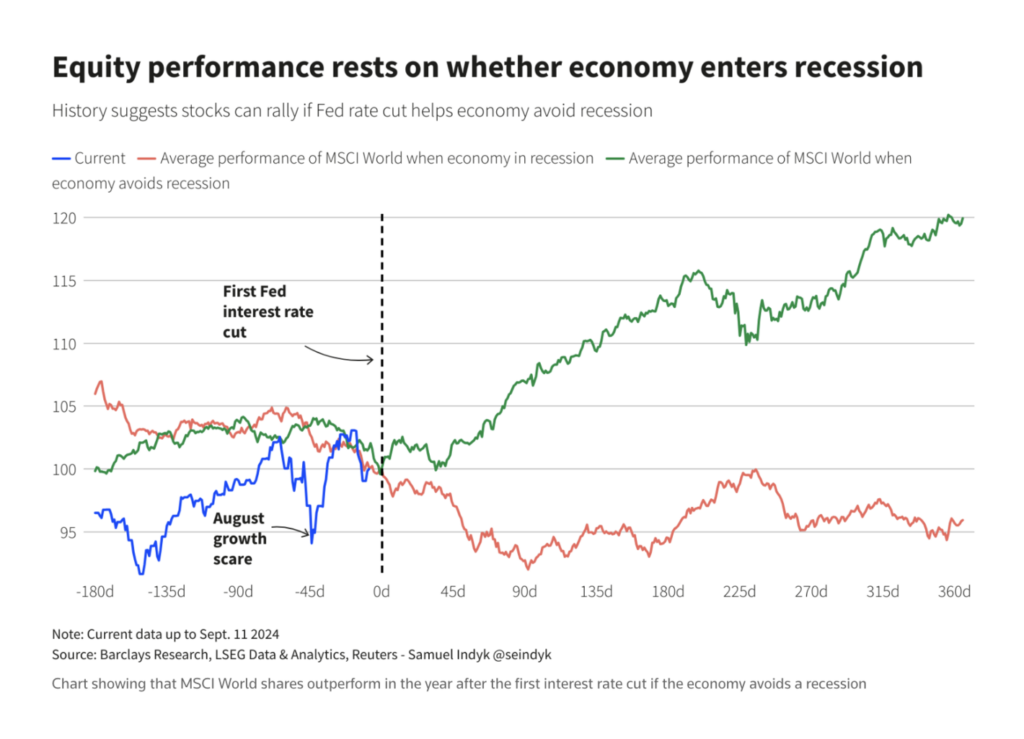
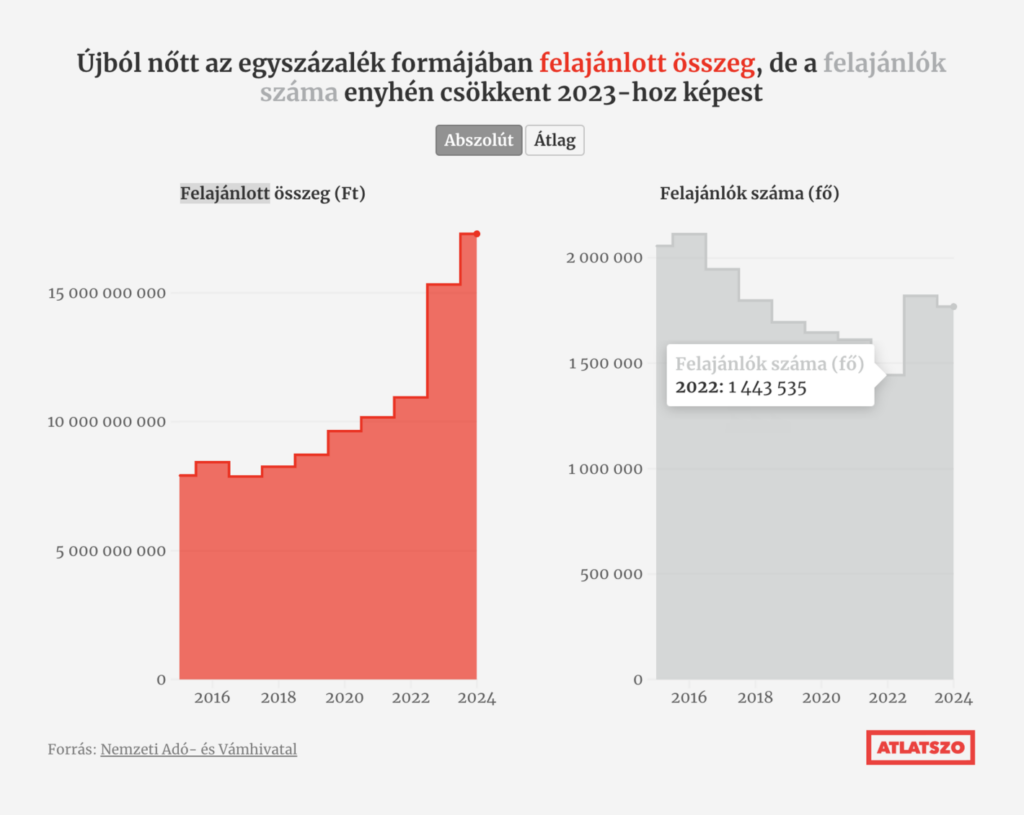
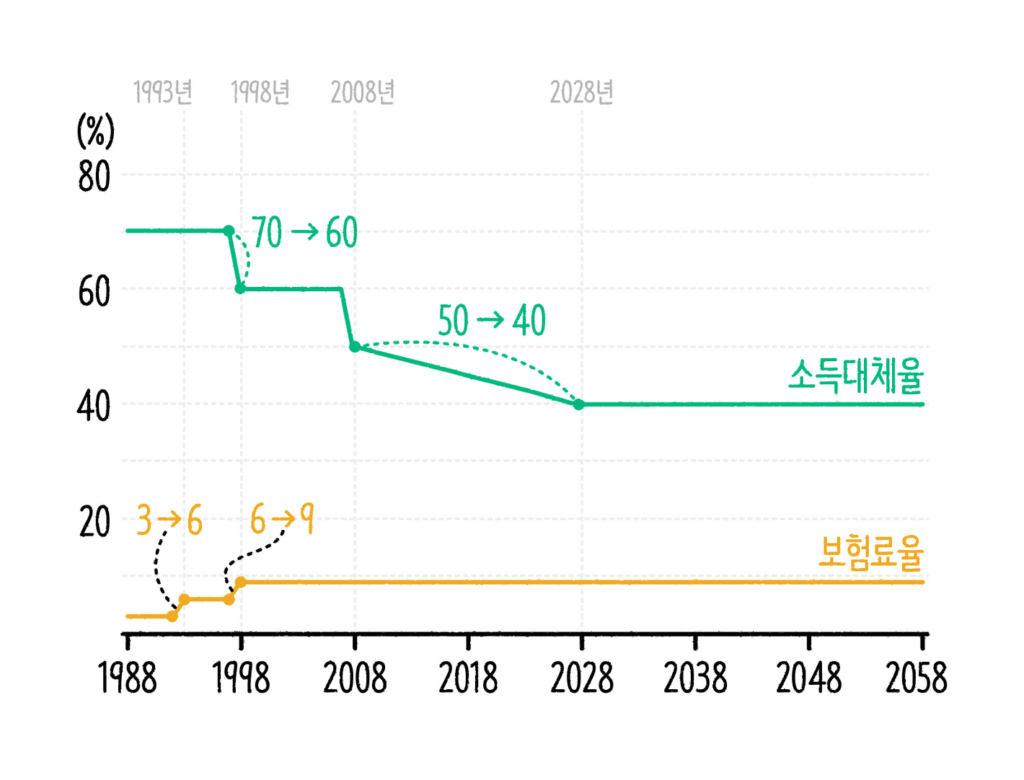
In the financial visualizations we see up and down trends. What is going up? Stock performances after the Fed rate cut, the amount of charitable giving outof income tax in Hungary, and the pension insurance premium rate in South Korea:
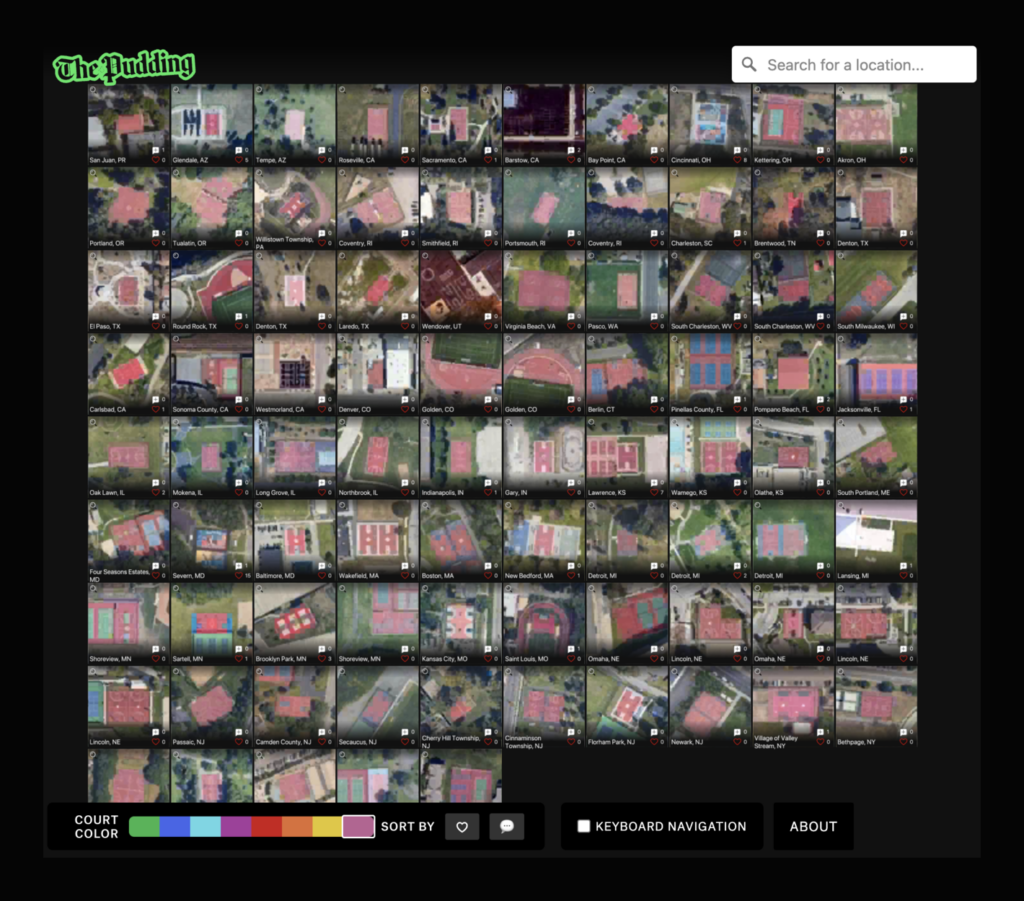
It’s time for some playfulness with a playful topic: sports! Visualizations let you track the journey of the greatest mountain runner in the Alps and explore 59,507 U.S. basketball courts:
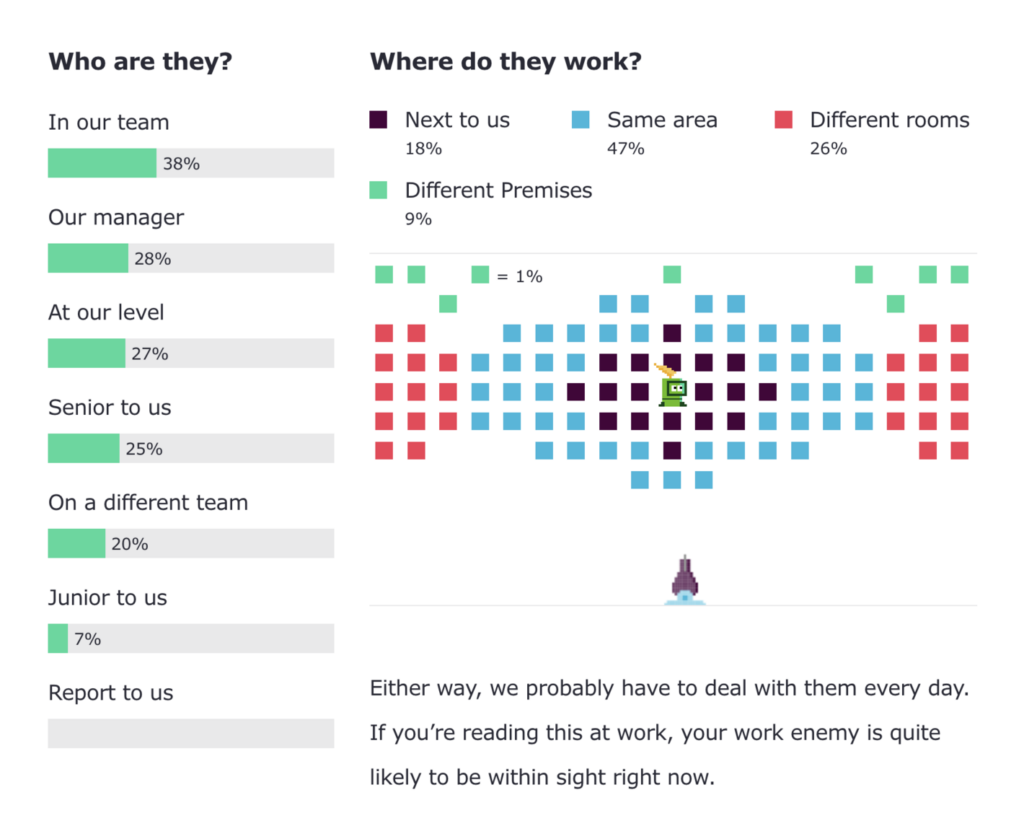
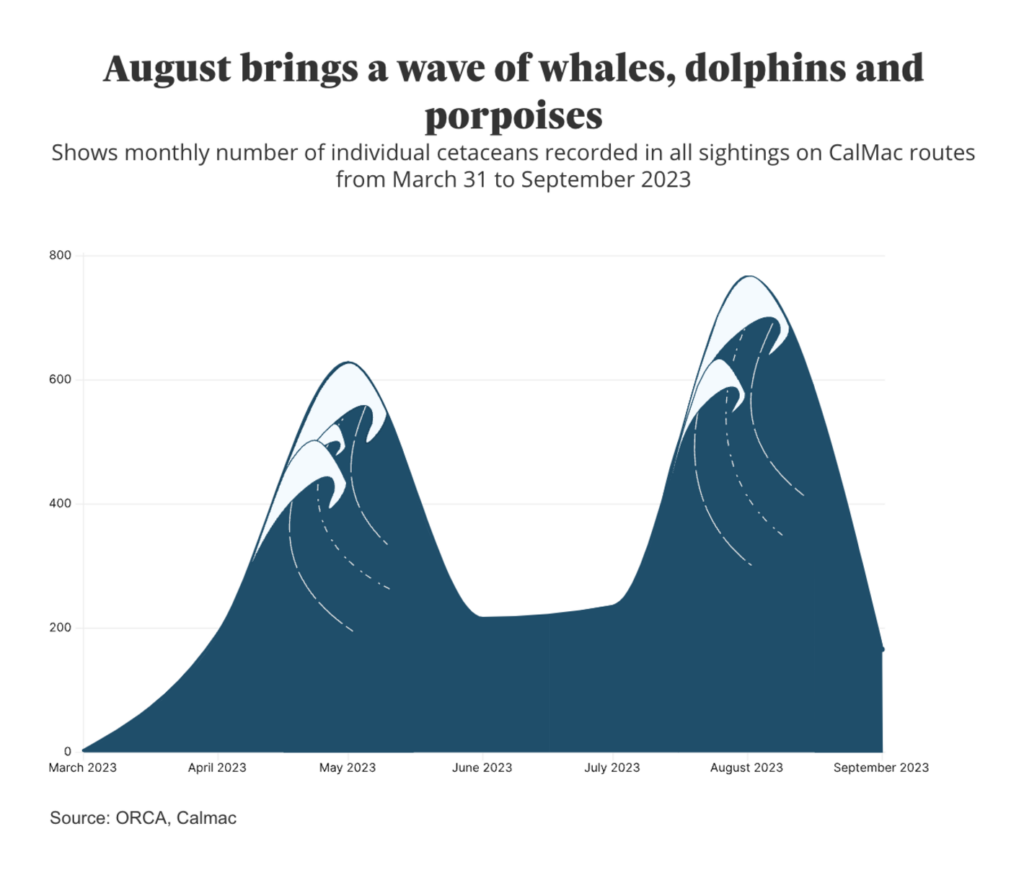
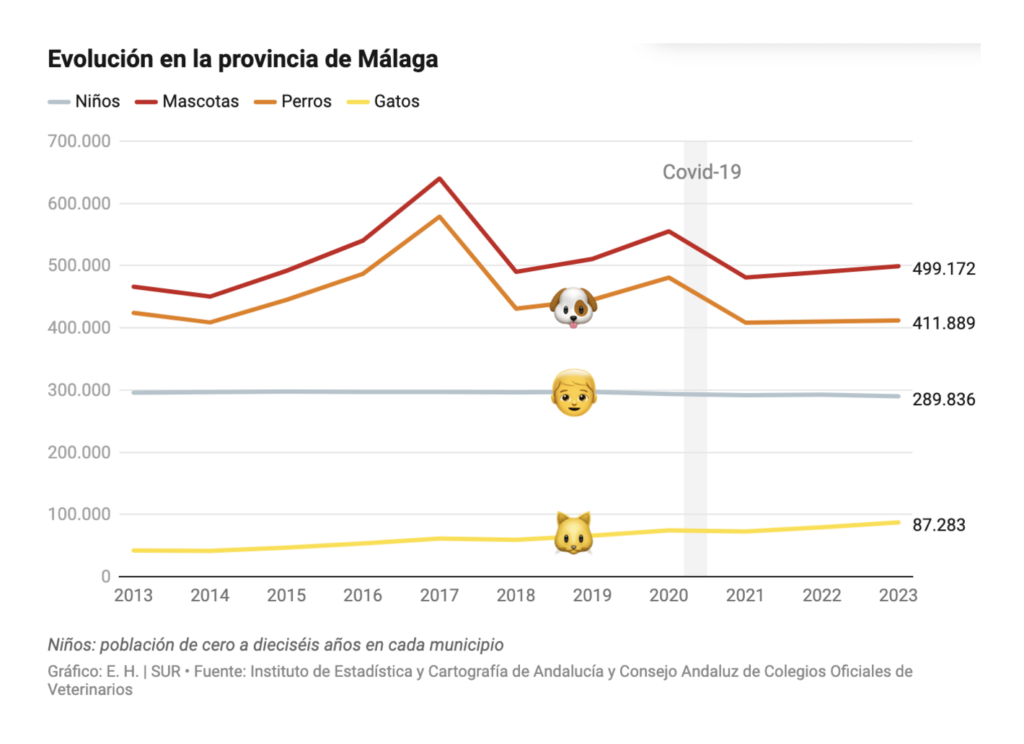
And we also end this Dispatch with a collection of playful visualizations that deal with work enemies (which apparently most of us have), whale watching, and Málaga, where animals have caught up with children:
Help us make this dispatch better! We’d love to hear which newsletters, blogs, or social media accounts we need to follow to learn about interesting projects, especially from less-covered parts of the world (Asia, South America, Africa). Write us at hello@datawrapper.de or leave a comment below.
(she/her) is a working student on Datawrapper’s Communications team. She creates the Data Vis Dispatch to keep data visualization enthusiasts up to date on exciting new projects. When she’s not working, she studies interface design, and when she’s not studying, she’s planning a festival stage or soldering light installations. Vivien lives in Potsdam.


Comments