We want to enable everyone to create beautiful charts, maps, and tables. New to data visualization? Or do you have specific questions about us? You'll find all the answers here.
The best of last week’s big and small data visualizations
Vivien Serve
Welcome back to the 161st edition of the Data Vis Dispatch! Every week, we publish a collection of the best small and large data visualizations we find, especially from news organizations — to celebrate data journalism, data visualization, simple charts, elaborate maps, and their creators.
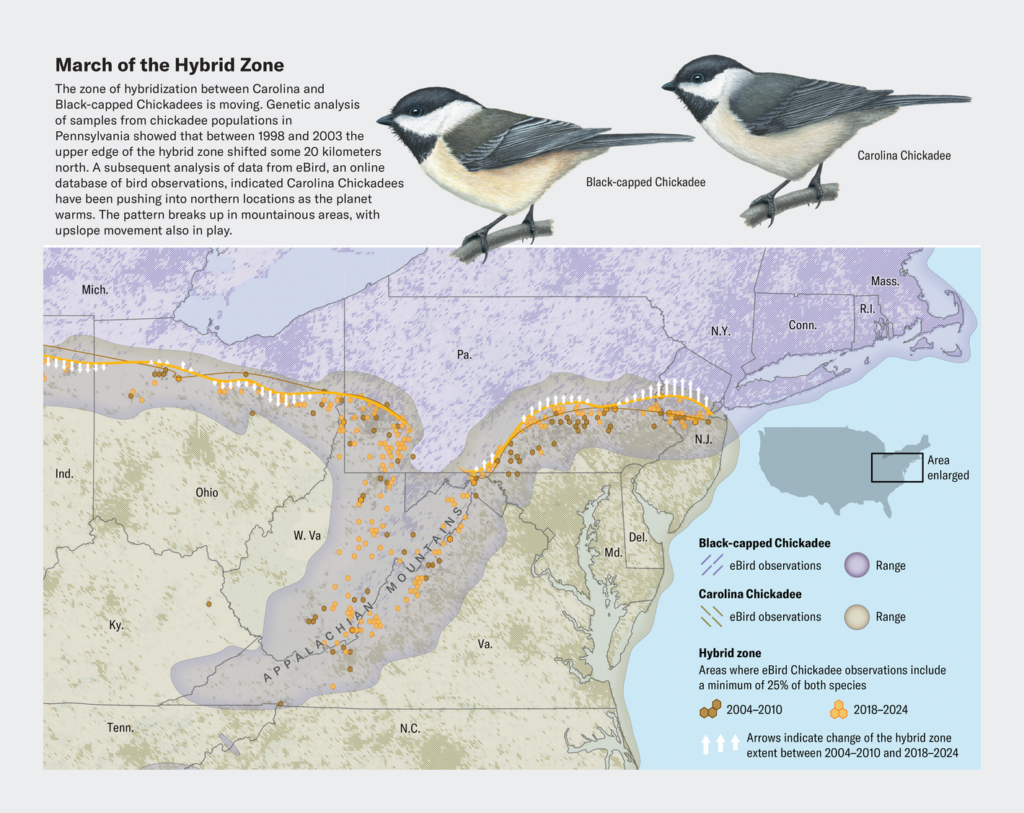
Recurring topics this week include Chinese strategies in the Indo-Pacific, German local elections, and chickadees.
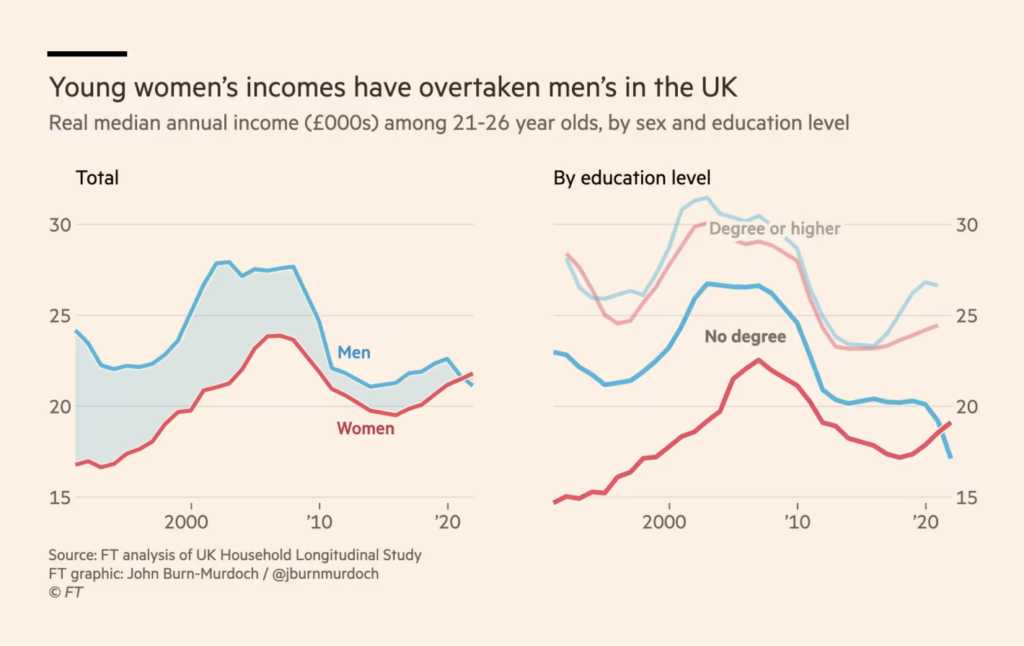
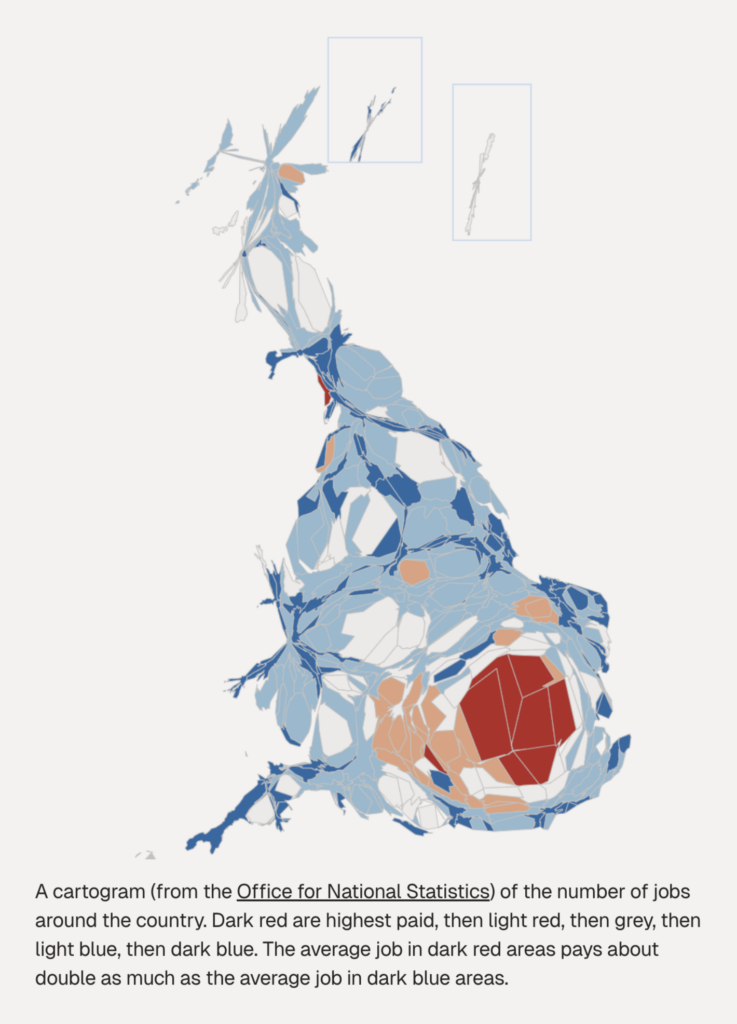
We begin this Dispatch from the United Kingdom, where coal-fired power generation has come to an end, young women are surpassing young men in income, and underinvestment in housing and infrastructure is emerging as a critical issue.
Ember: The UK’s journey to a coal power phase-out, September 20Financial Times: Young women are starting to leave men behind, September 20 Compare countriesSam Bowman: “Foundations: Why Britain Has Stagnated. A new essay by @bswud, @SCP_Hughes & me. Why the UK’s ban on investment in housing, infrastructure and energy is not just a problem. It is *the* problem. And how fixing it is the defining task of our generation,” September 20 (Tweet, Article) More intriguing visualizations
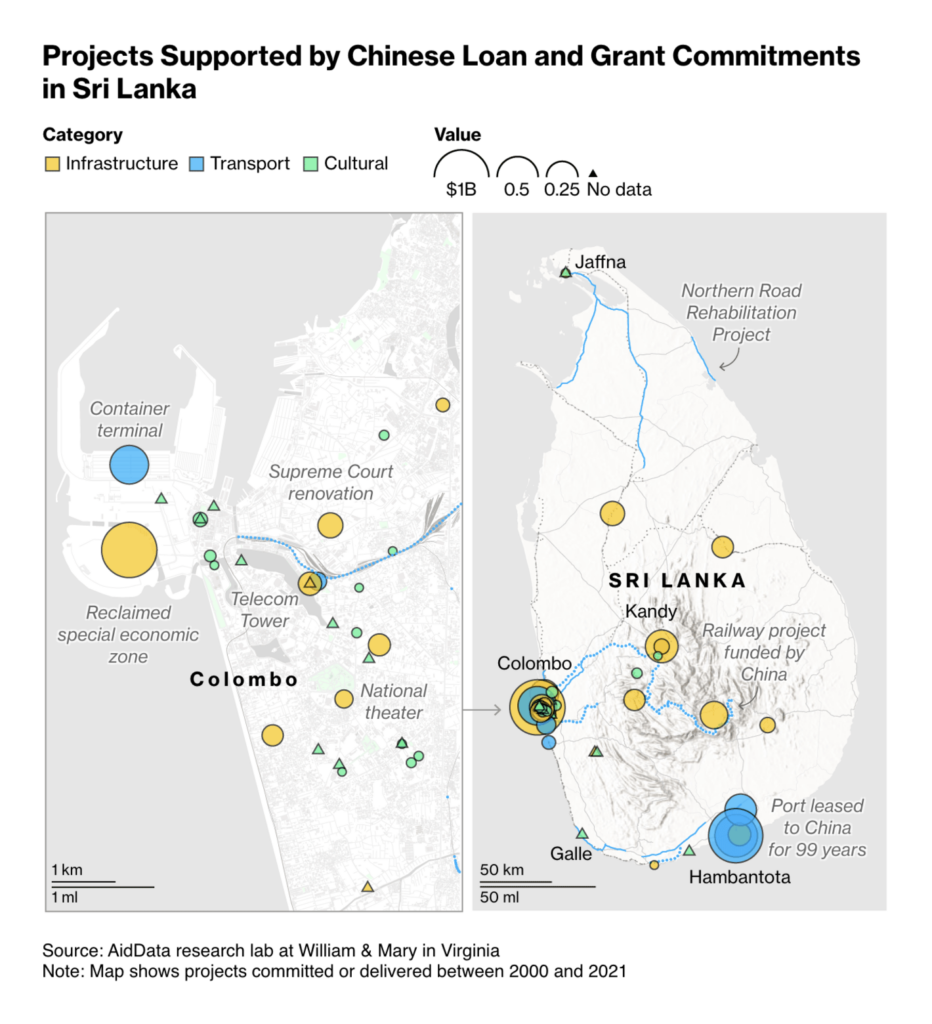
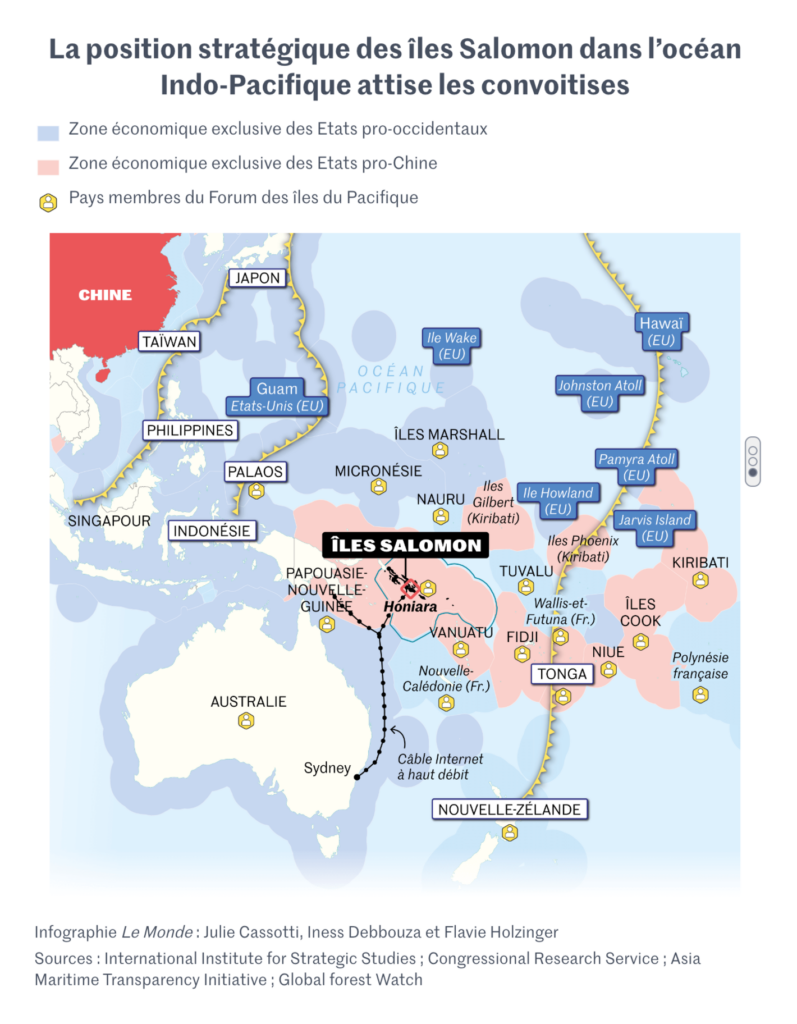
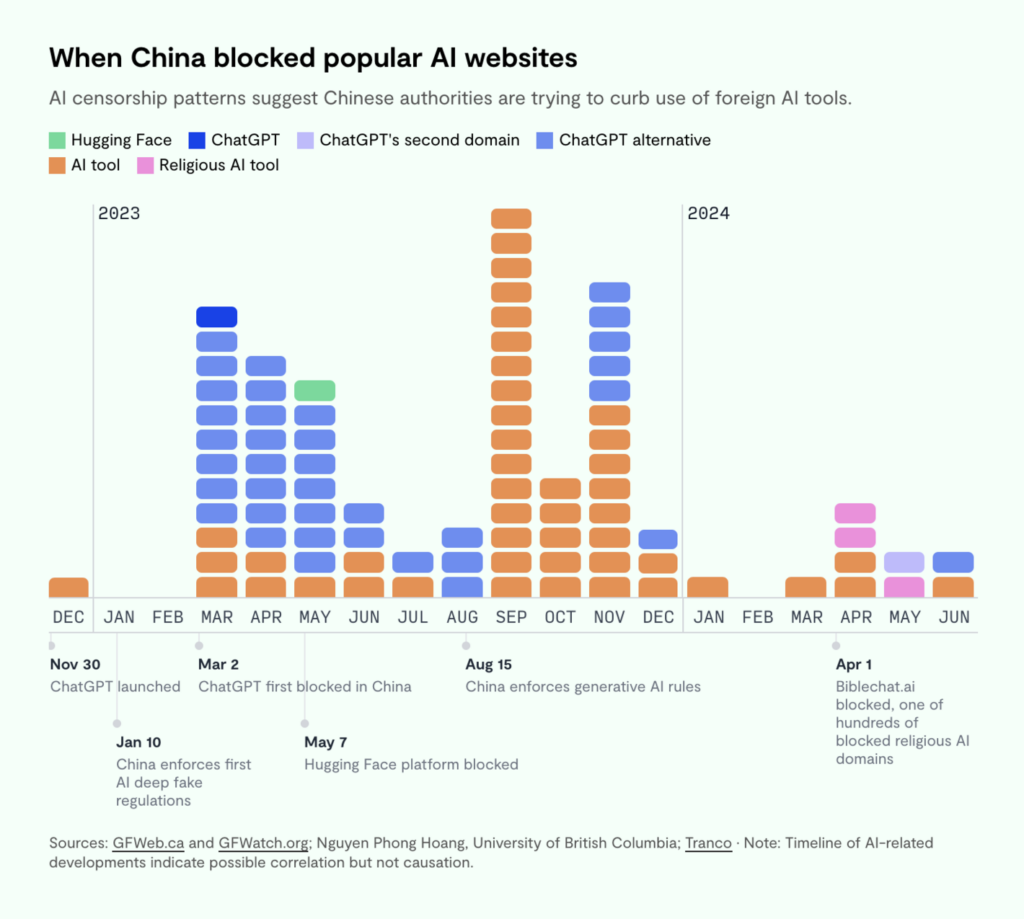
Let’s shift our focus to China, specifically Chinese strategies to expand its influence over island nations like Sri Lanka and the Solomon Islands, as well as its control over its own population by banning independent AI platforms:
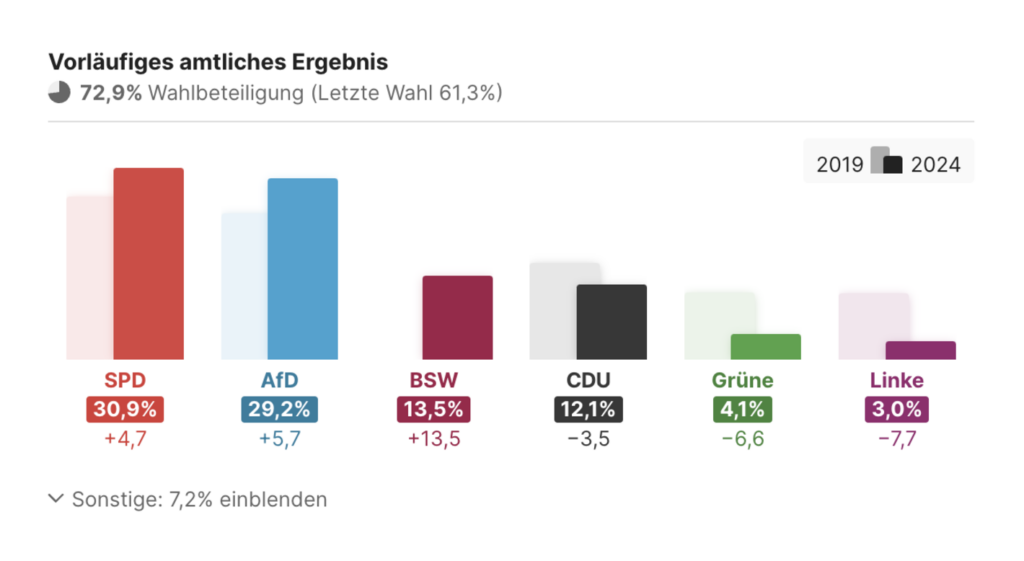
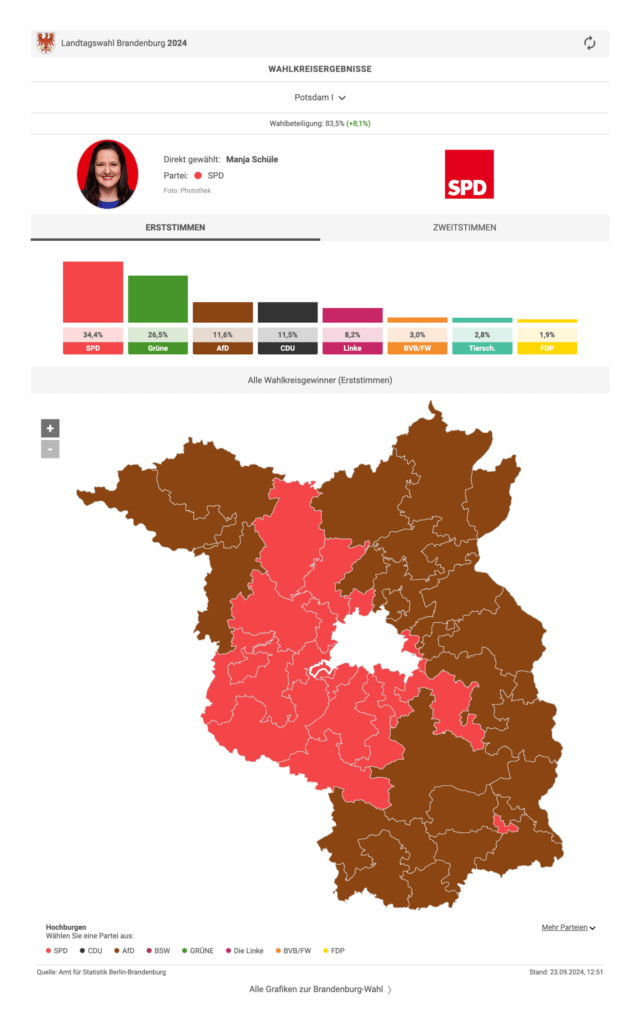
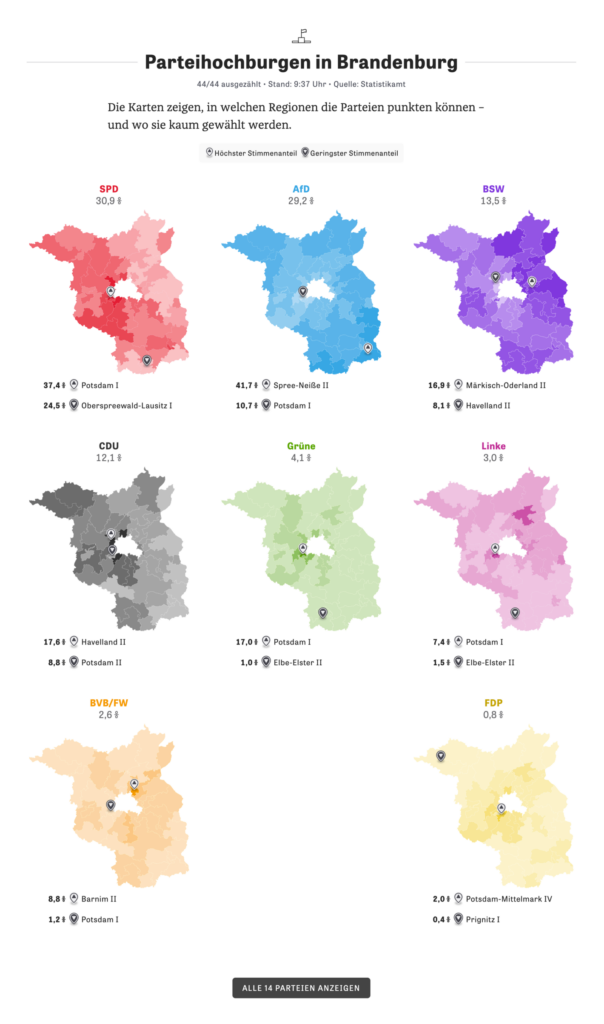
In Germany, the news is buzzing after recent state elections in Brandenburg, and so are the visualizations. Again, the far-right AfD party saw significant voter gains, while the center-left SPD is barely holding on:
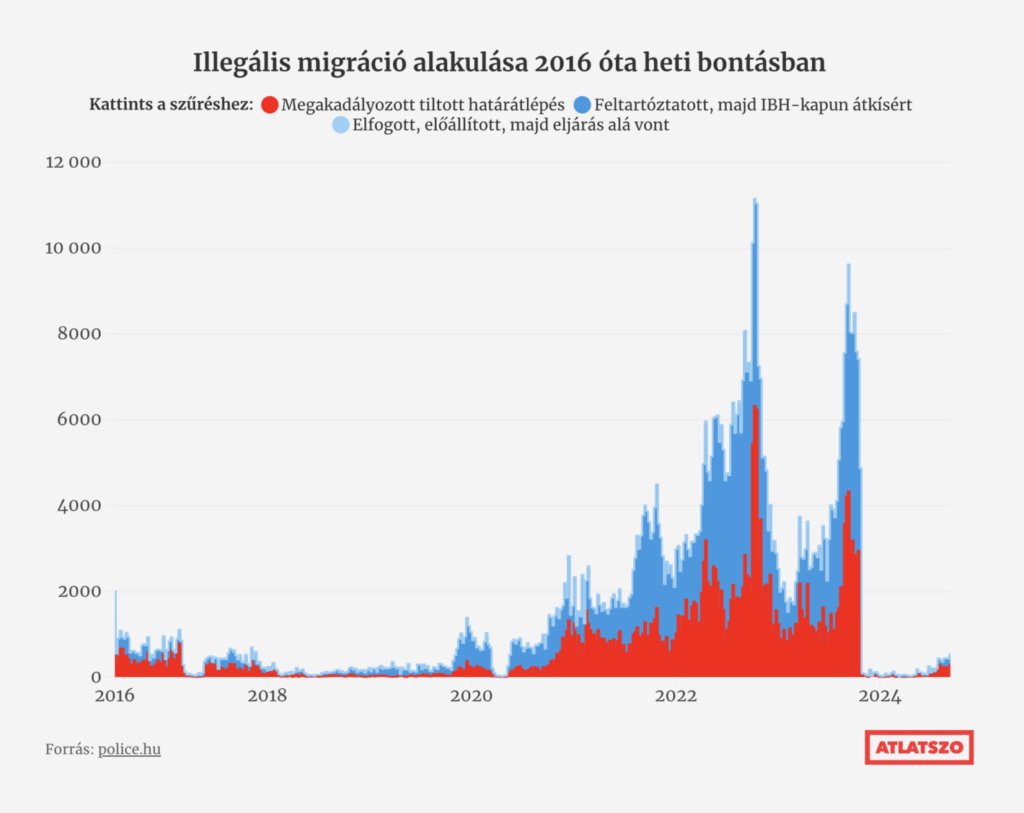
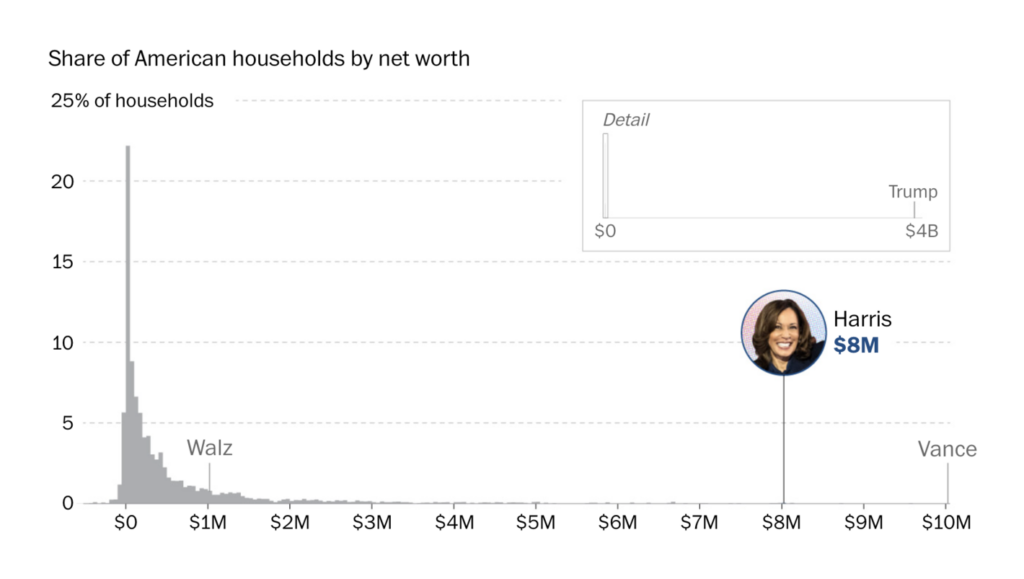
In Hungary, the government continues to present migration as an important issue, even when reality doesn’t back them up. In the U.S., the focus was on the personal wealth of the candidates:
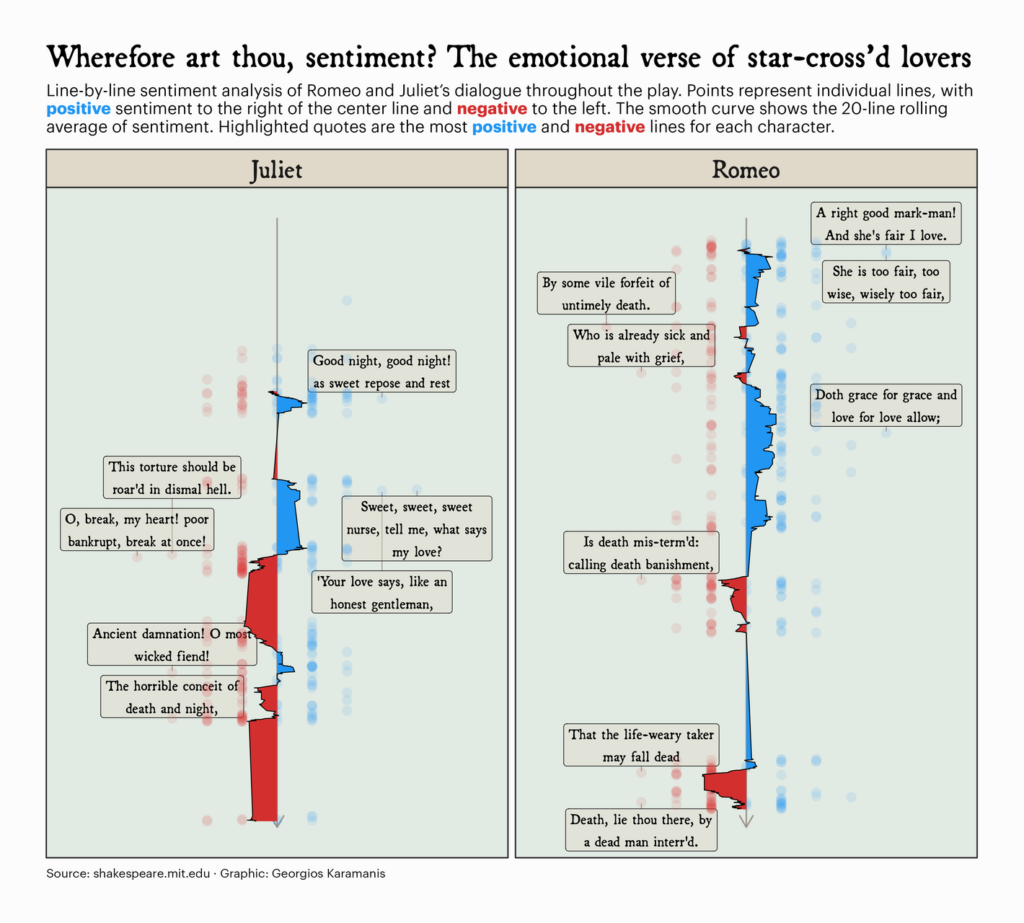
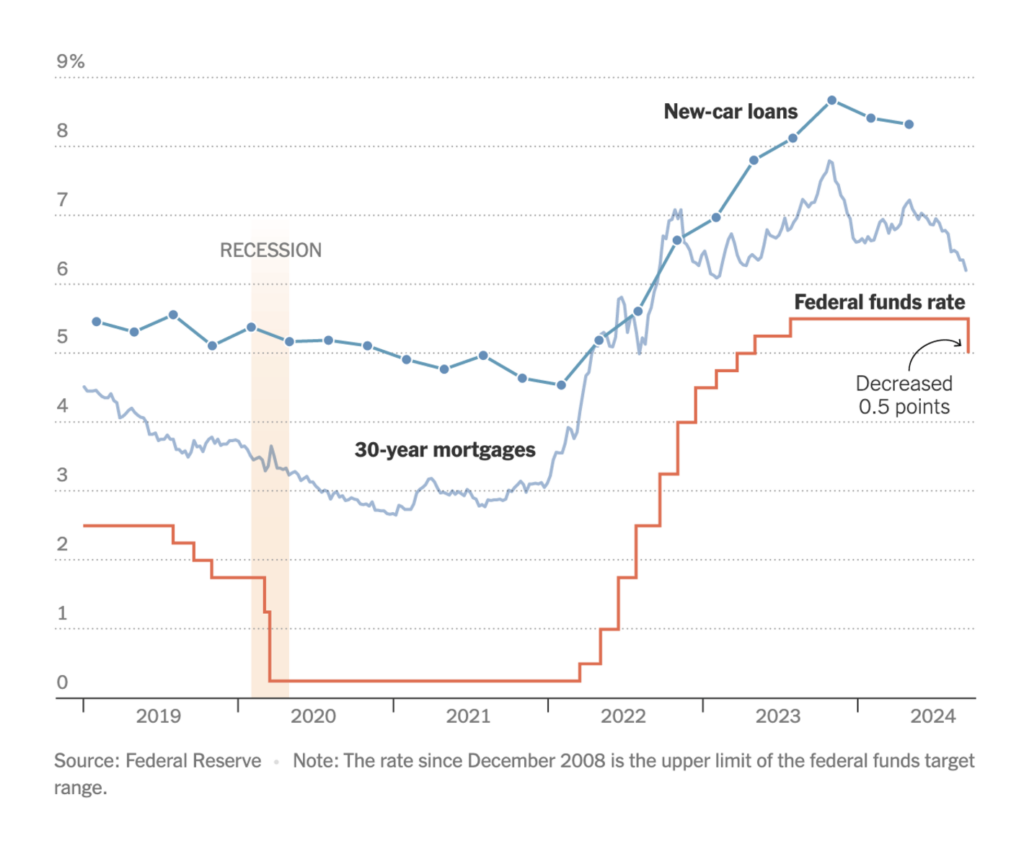
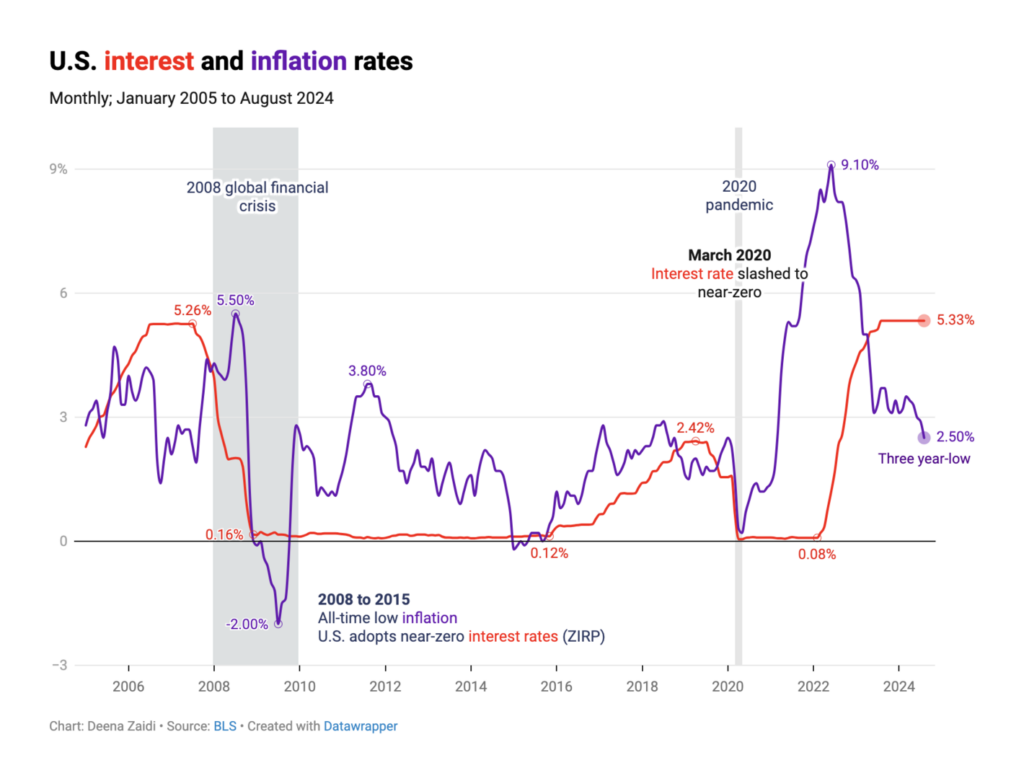
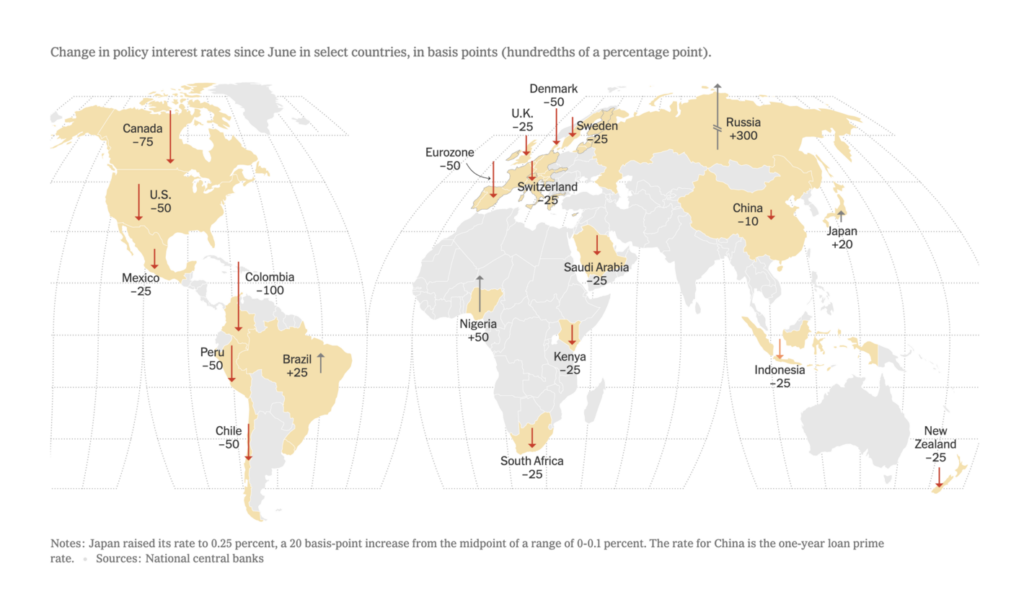
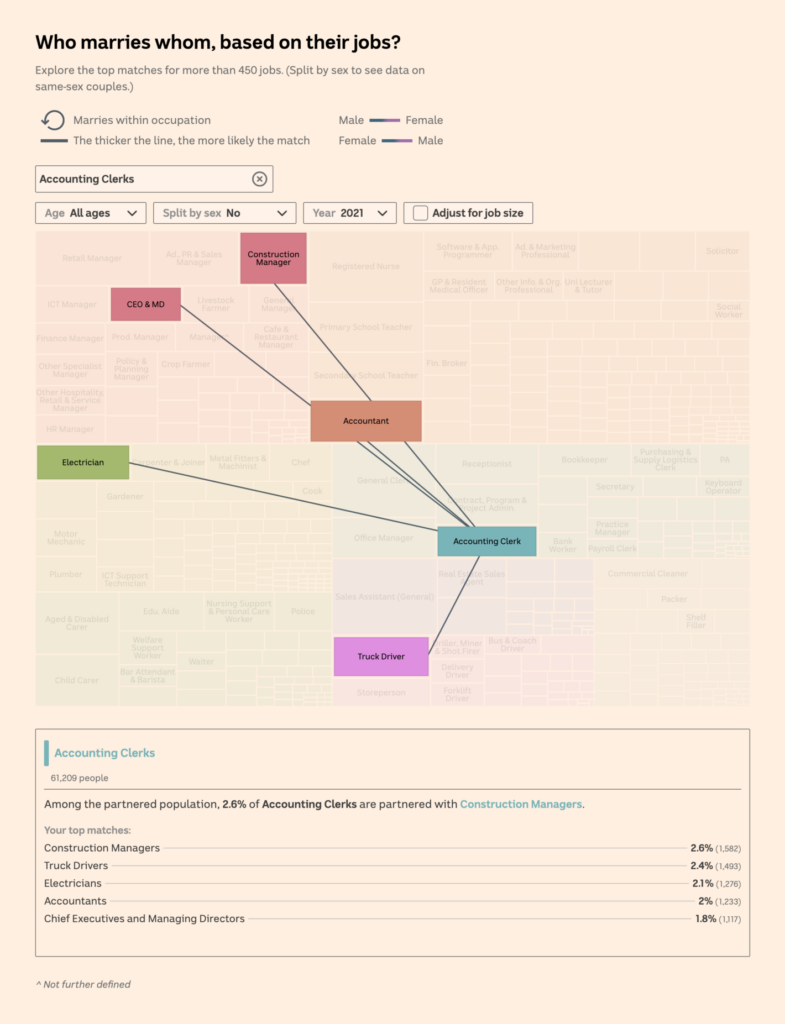
From tragic tales of love to U.S. Fed rate cuts — there couldn’t be a smoother transition. With the recent drop in interest rates, U.S. loans and mortgages are expected to decrease, with hopes that inflation stays in check too. Plus, a look at interest rates outside the U.S.:
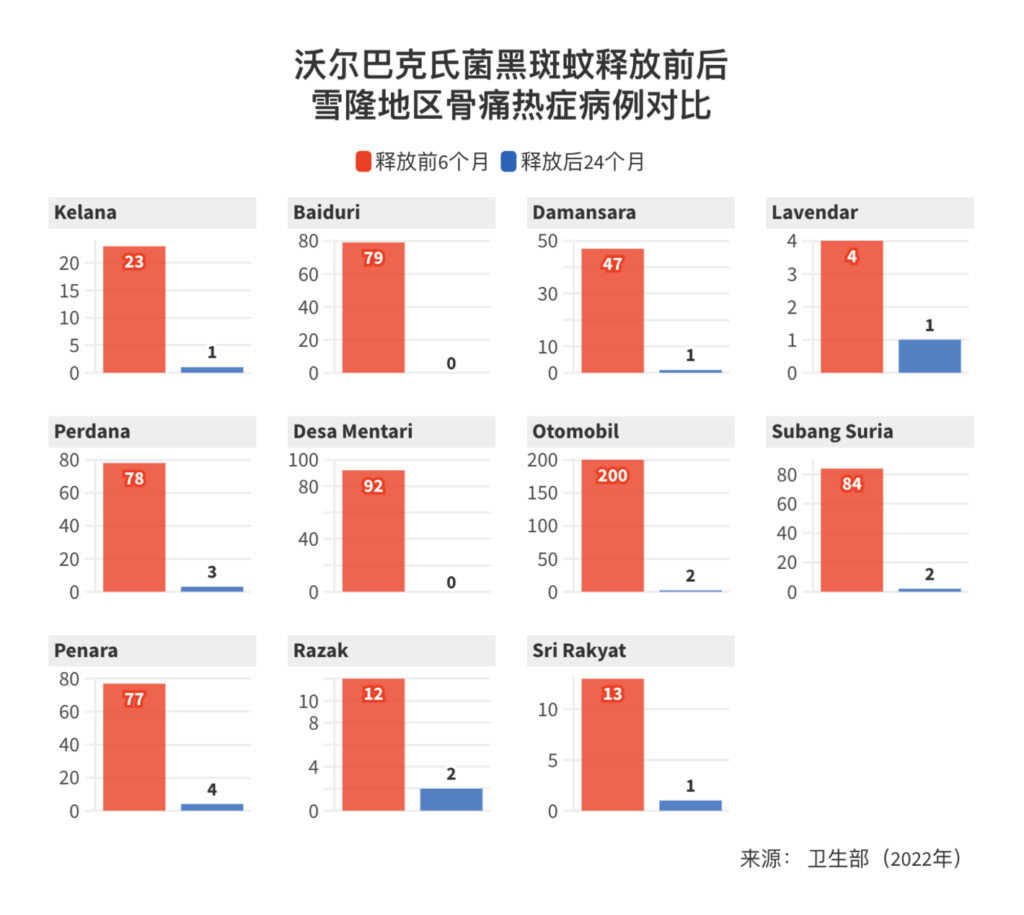
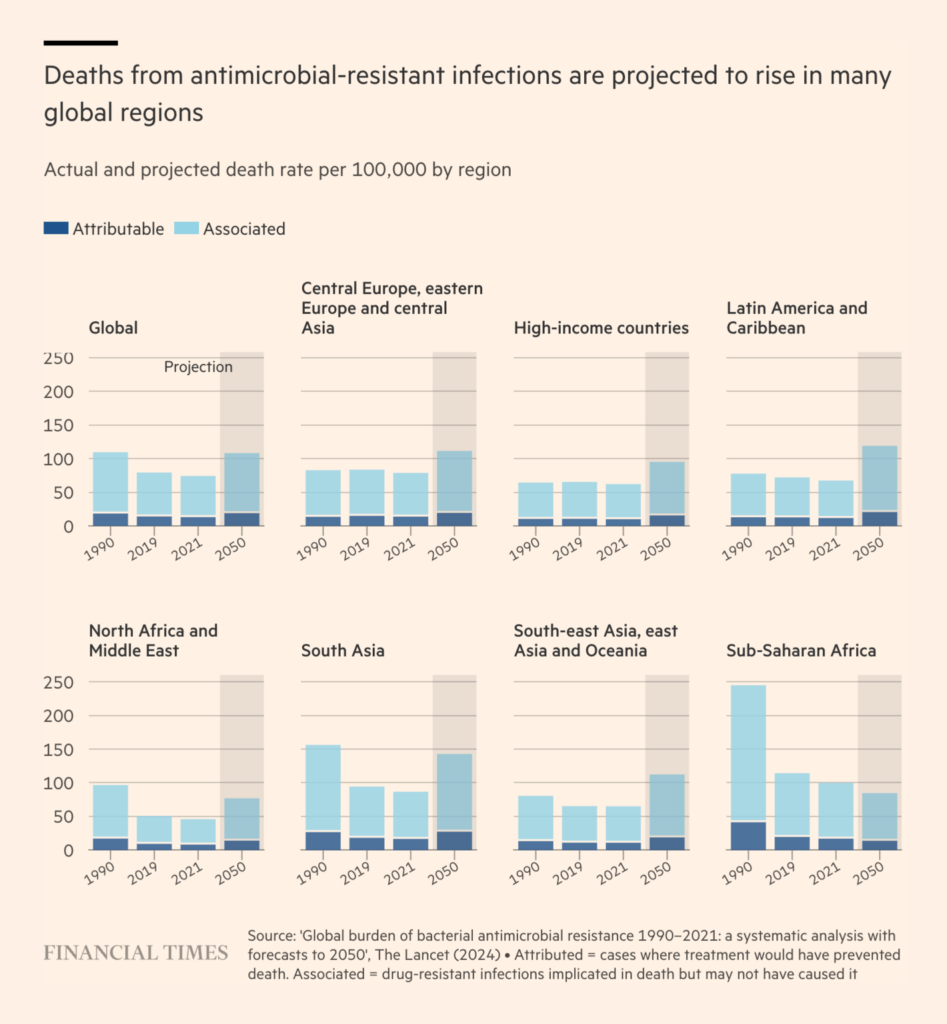
This week we came across two small multiple column charts dealing with the spread of disease. In one, special mosquitoes have been deliberately released in Malaysia to prevent the transmission of dengue fever to humans. In the other, there is concern that drug-resistant bacteria and viruses are on the rise:
Help us make this dispatch better! We’d love to hear which newsletters, blogs, or social media accounts we need to follow to learn about interesting projects, especially from less-covered parts of the world (Asia, South America, Africa). Write us at hello@datawrapper.de or leave a comment below.
(she/her) is a working student on Datawrapper’s Communications team. She creates the Data Vis Dispatch to keep data visualization enthusiasts up to date on exciting new projects. When she’s not working, she studies interface design, and when she’s not studying, she’s planning a festival stage or soldering light installations. Vivien lives in Potsdam.


Comments