

Data Vis Dispatch, February 18: German election polls, corruption, and tariffs
February 18th, 2025
9 min
This article is brought to you by Datawrapper, a data visualization tool for creating charts, maps, and tables. Learn more.
The best of last week’s big and small data visualizations
Welcome back to the 112th edition of Data Vis Dispatch! Every week, we’ll be publishing a collection of the best small and large data visualizations we find, especially from news organizations — to celebrate data journalism, data visualization, simple charts, elaborate maps, and their creators.
The Dispatch will go on a break next week for German Unity Day, so take your time with this one — recurring topics include air pollution, local census data, and UAW strikes.
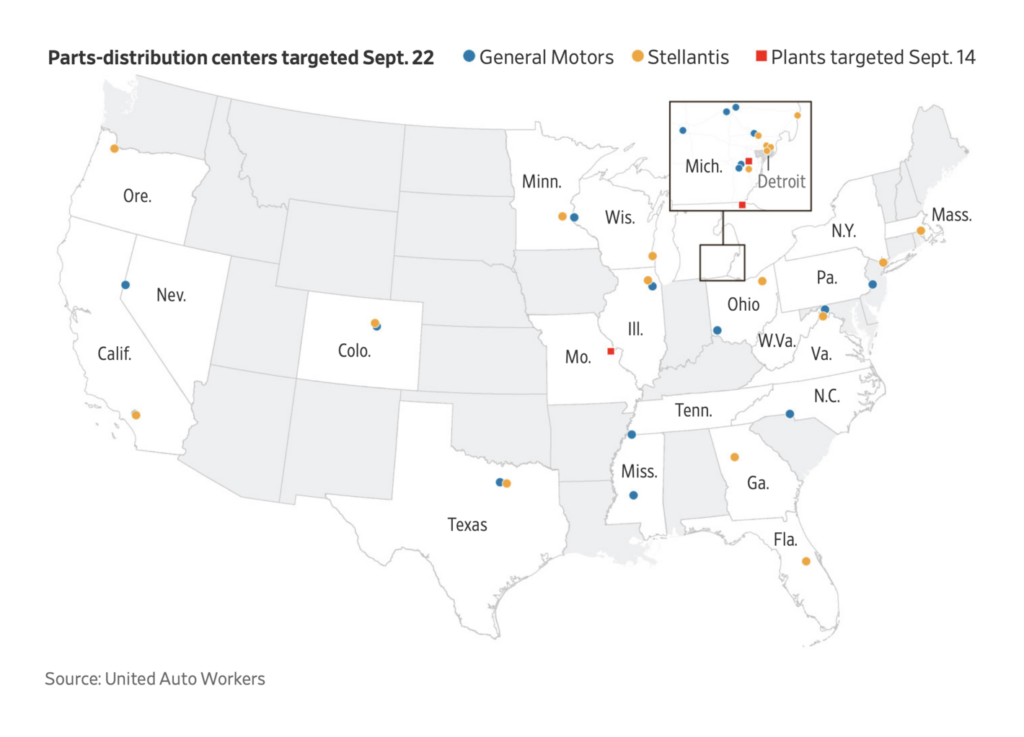
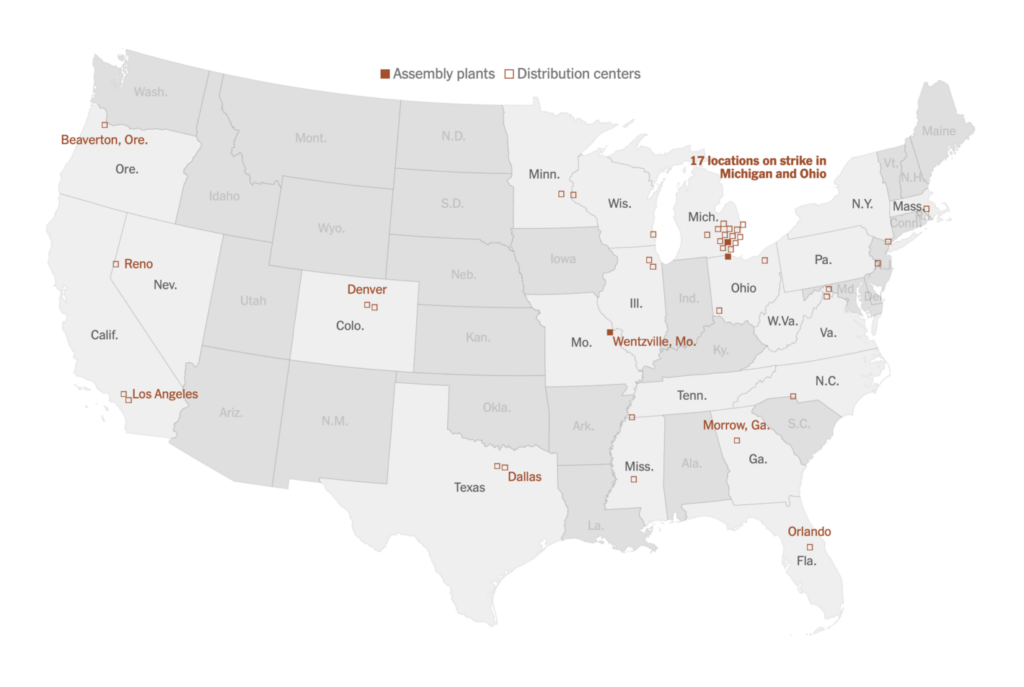
In the U.S., the United Auto Workers strike has expanded to 41 worksites in its second week:
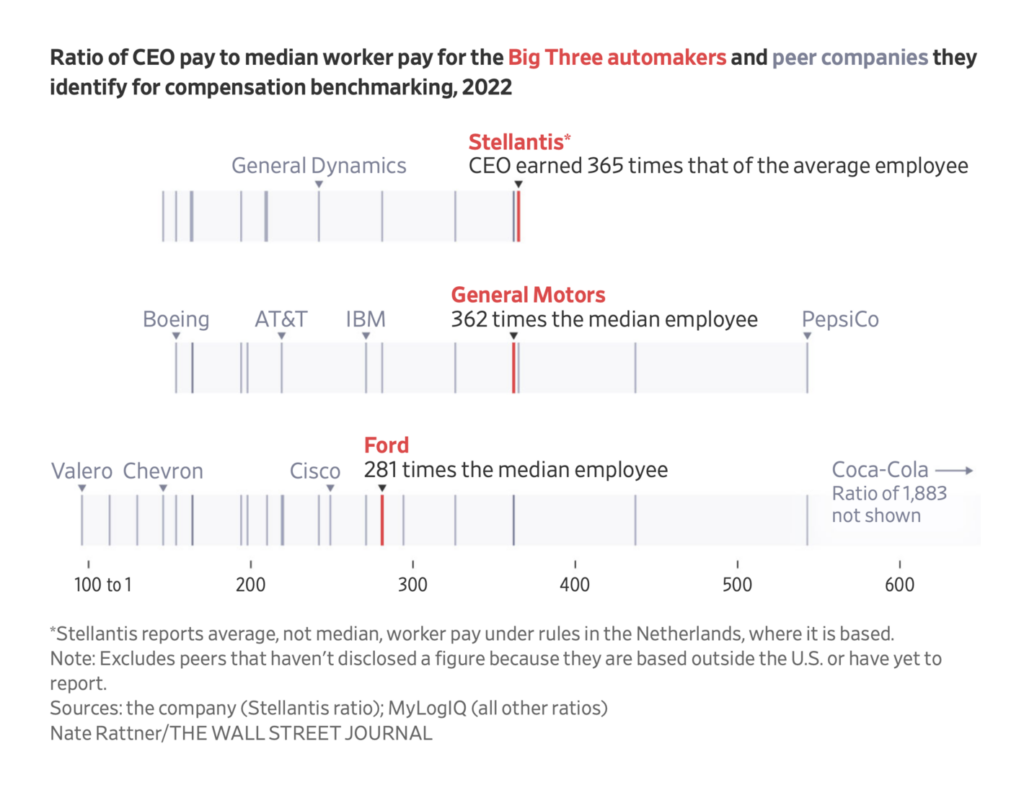
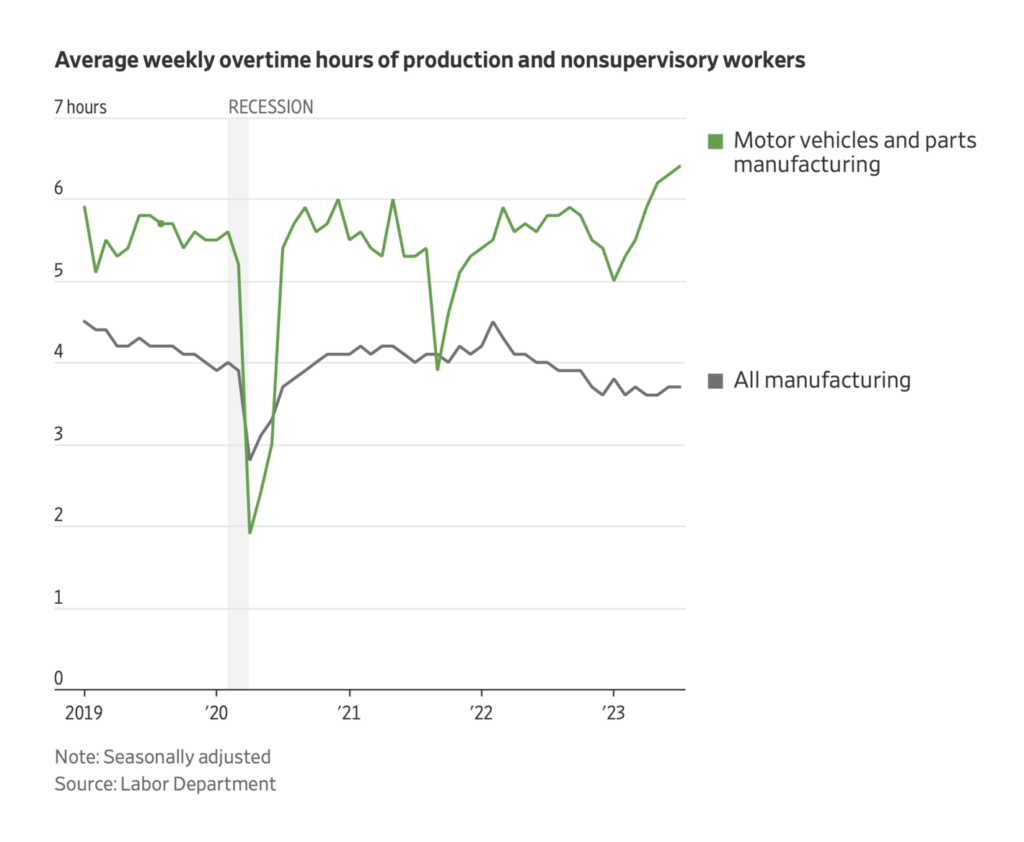
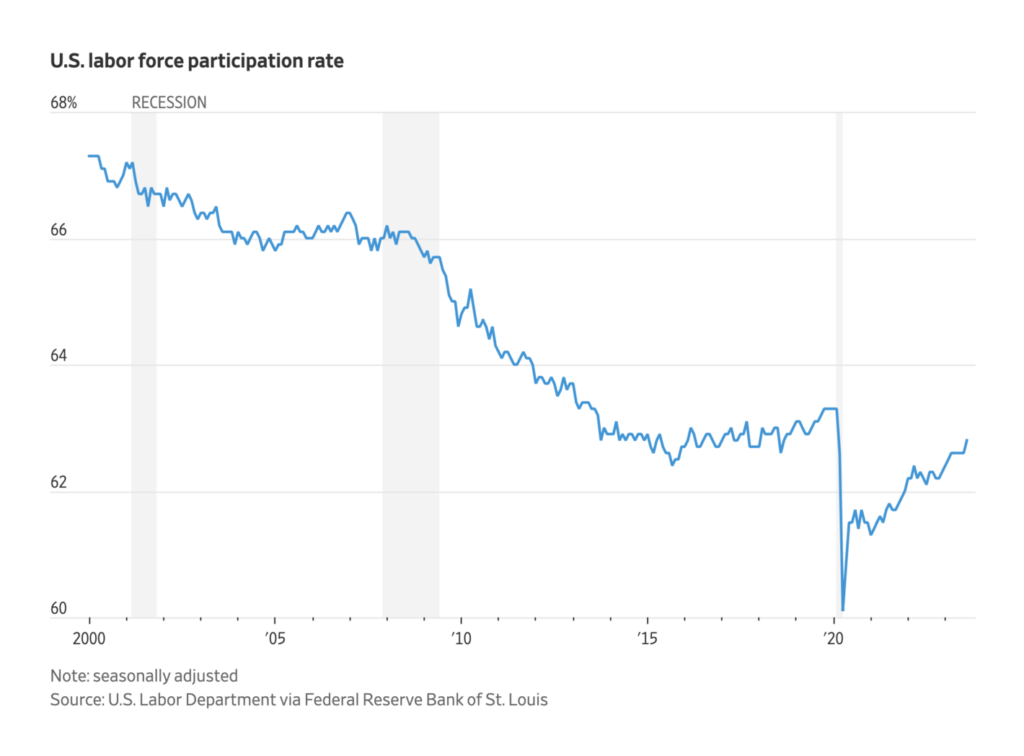
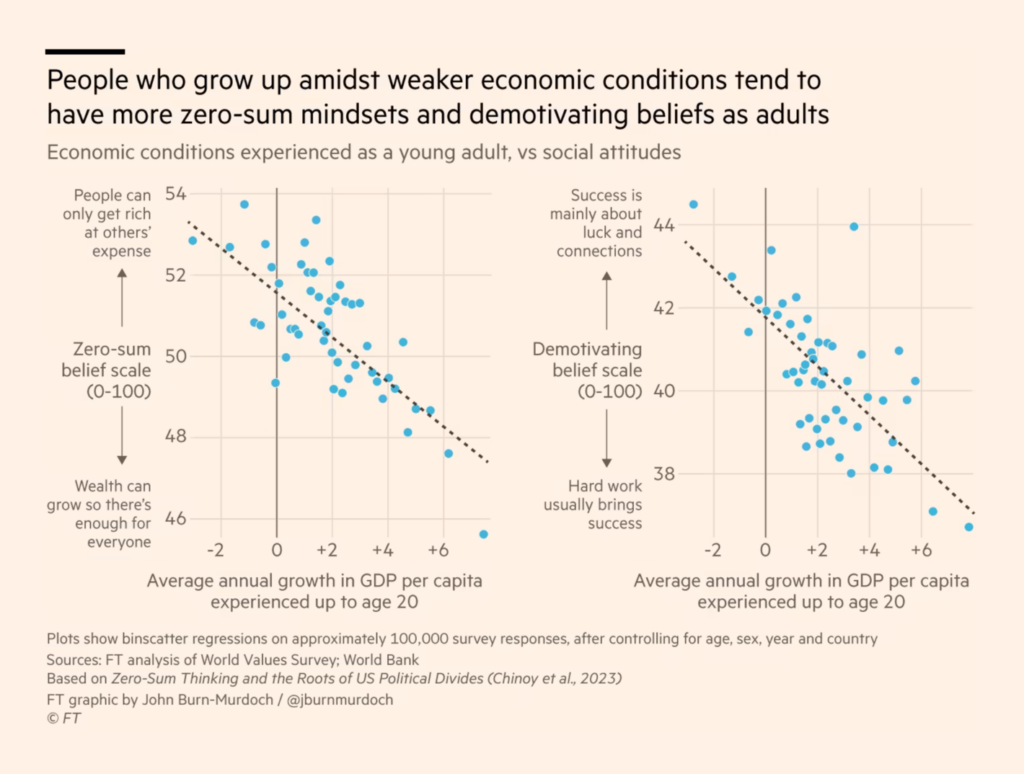
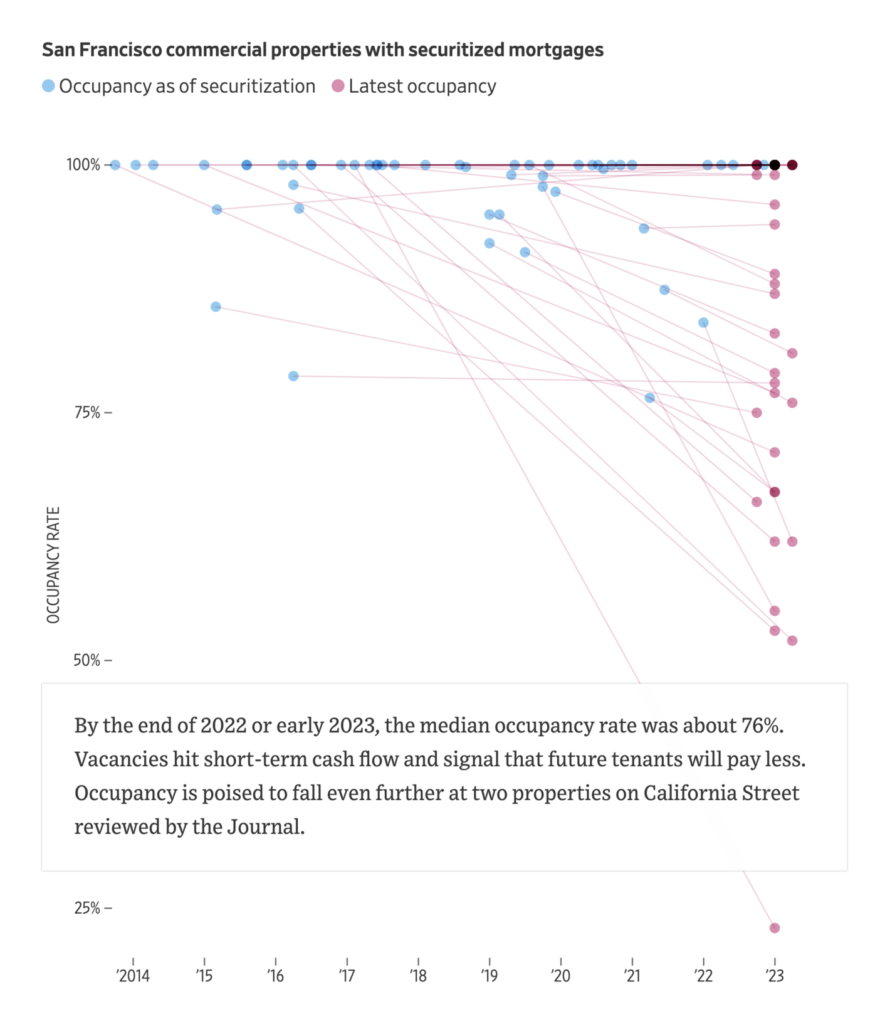
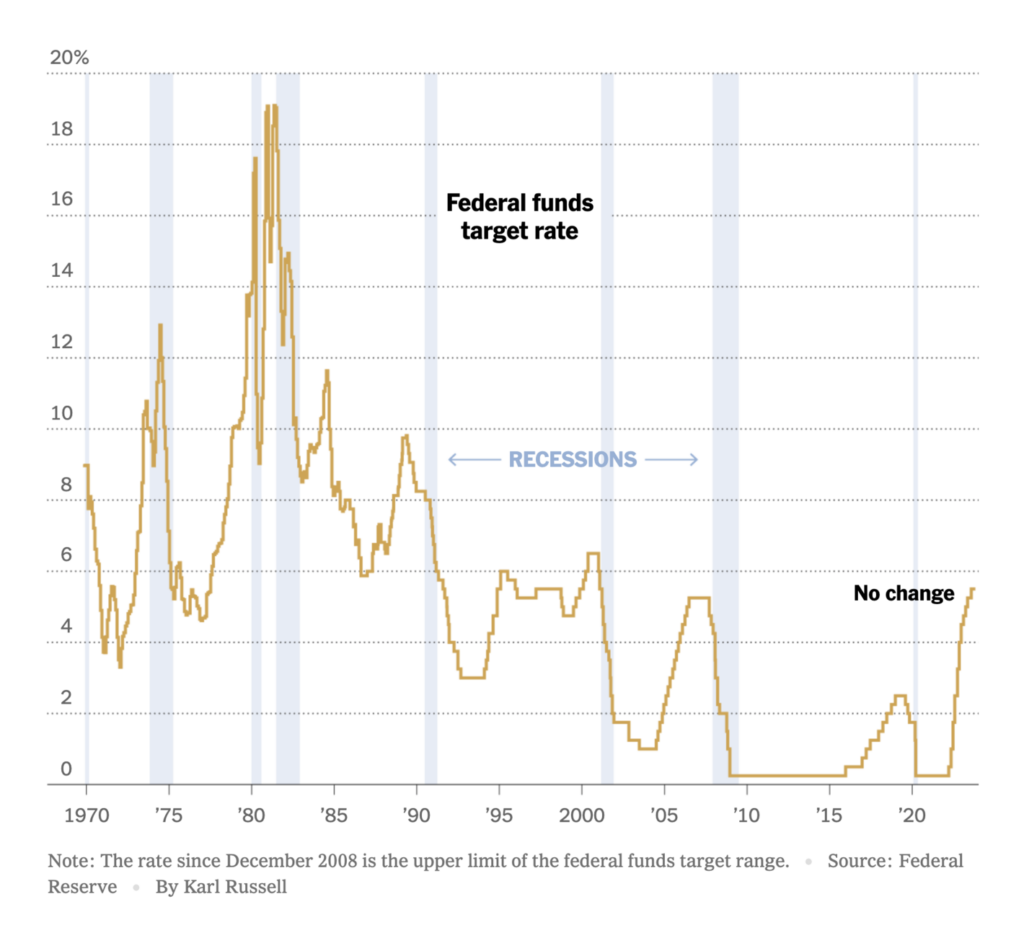
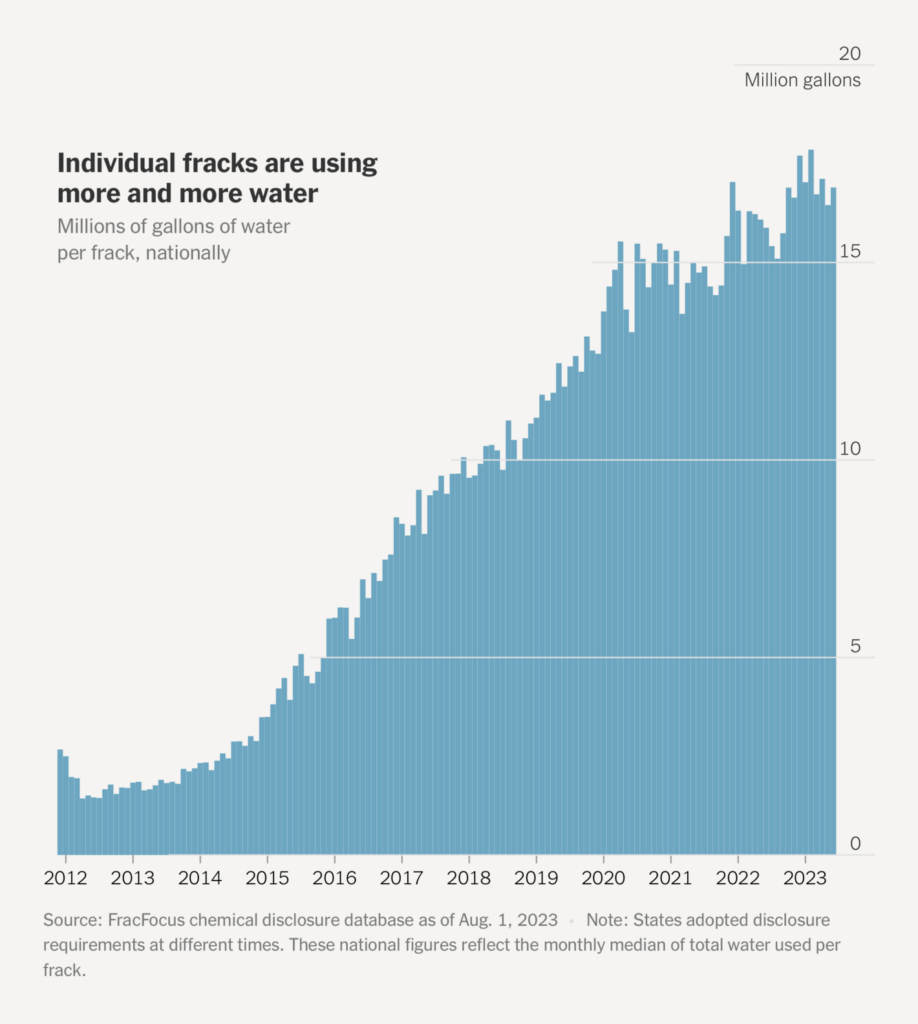
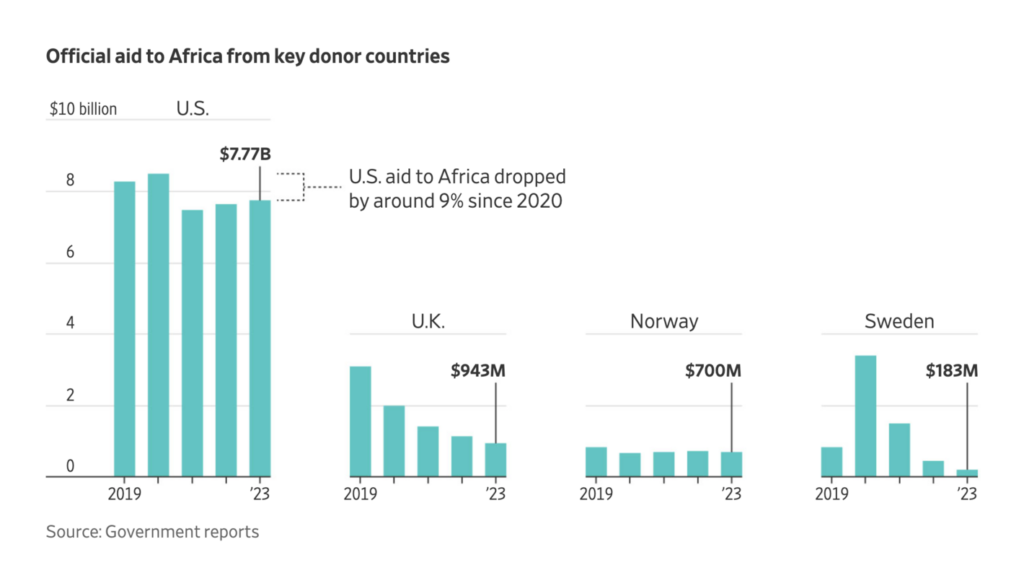
In fact we saw lots of charts on economic topics in general, especially related to labor issues and interest rates:

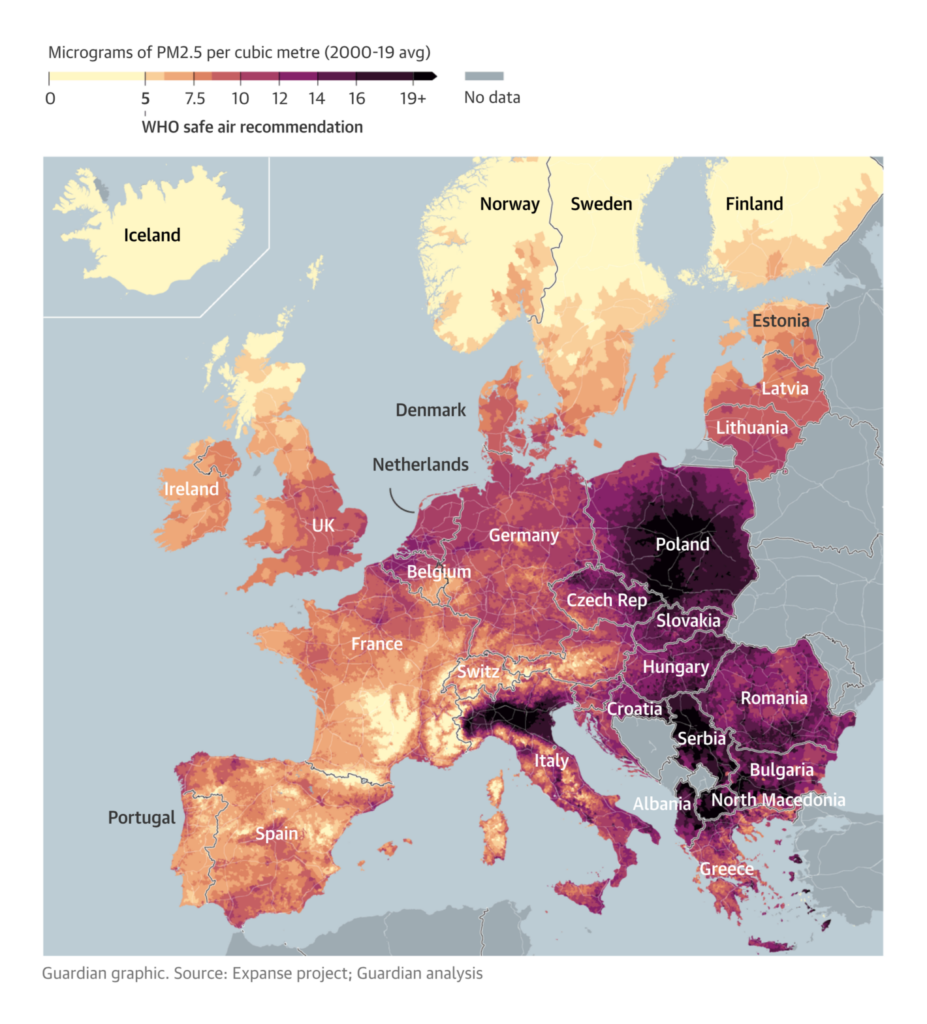
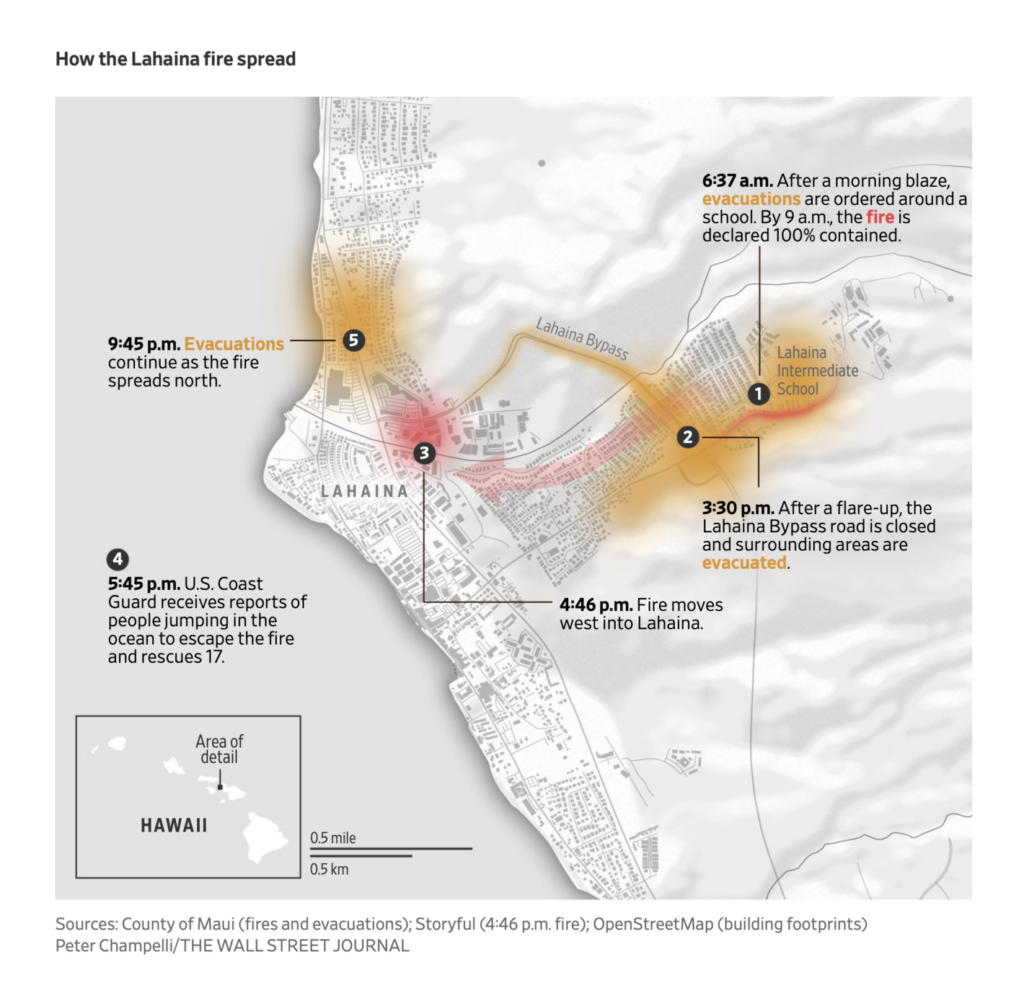
The climate topics of the week were air pollution and wildfire:

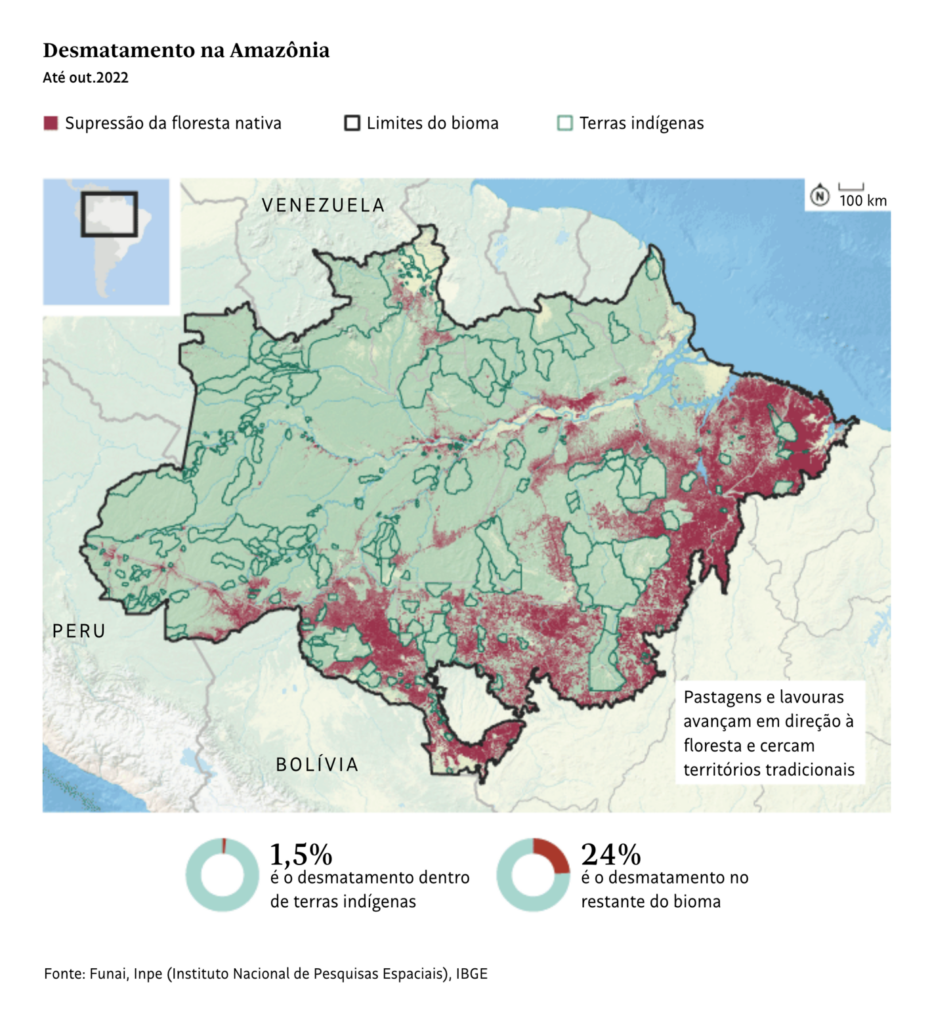
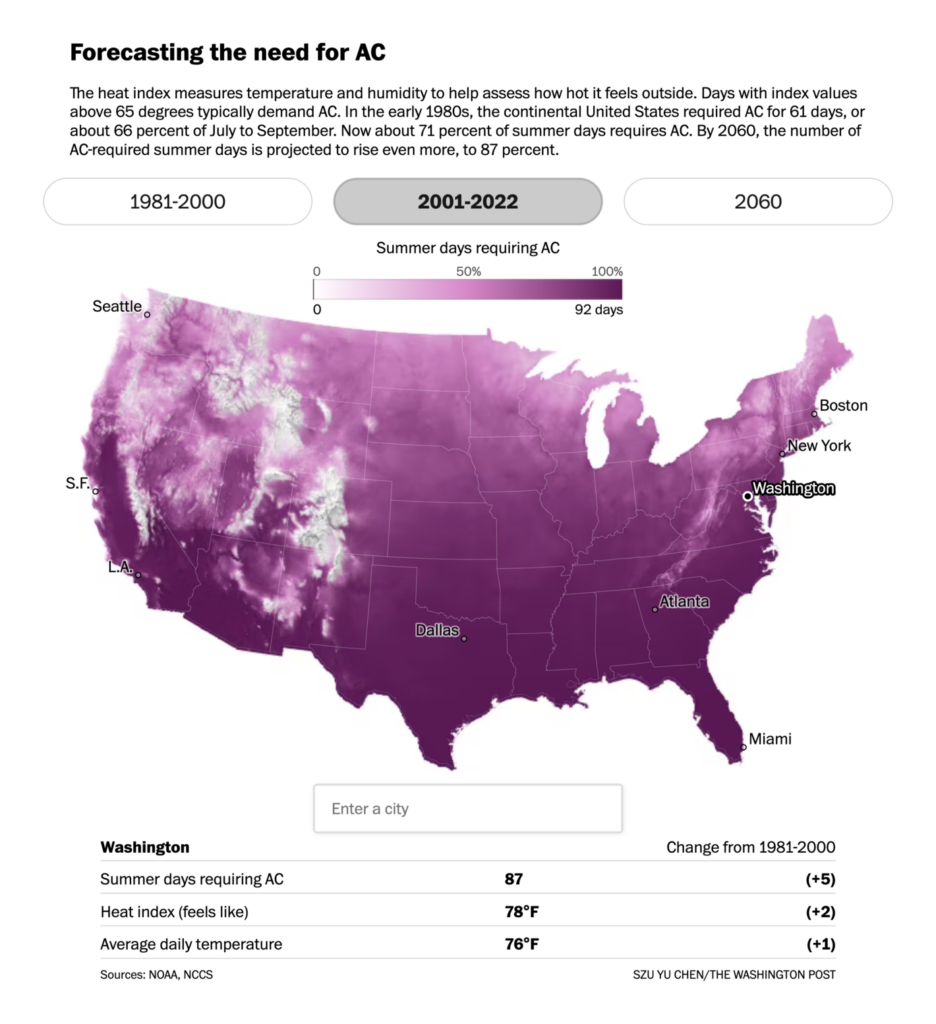
And we also saw charts and maps on the full range of possible climate solutions and non-solutions:

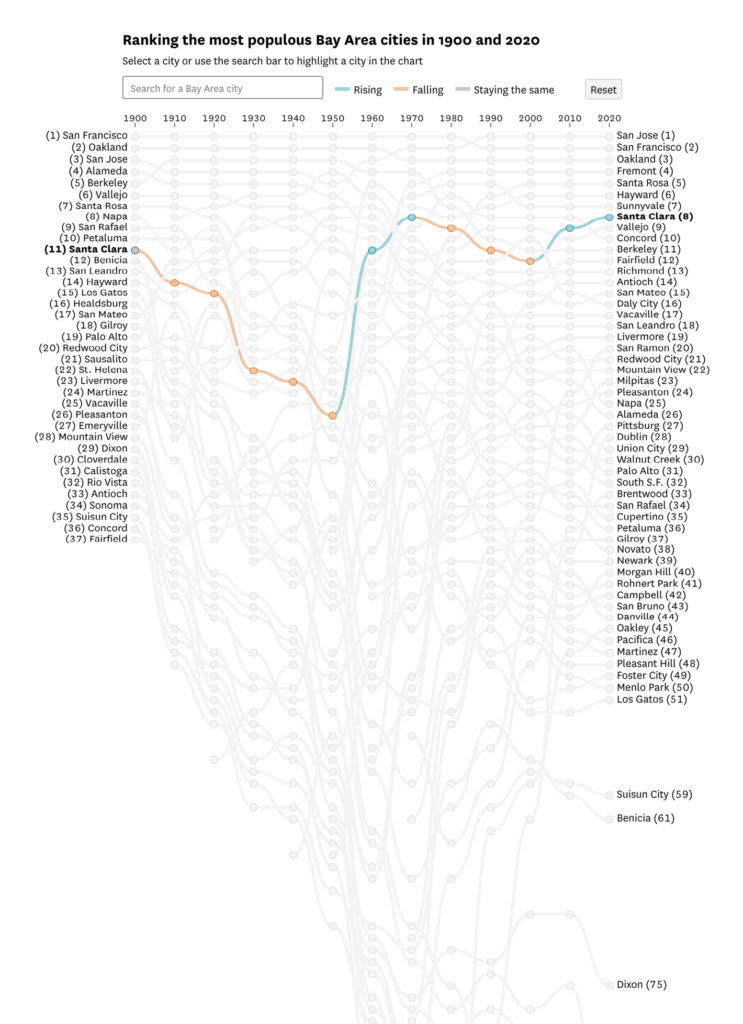
Two great stories this week used census data to look at local population trends:

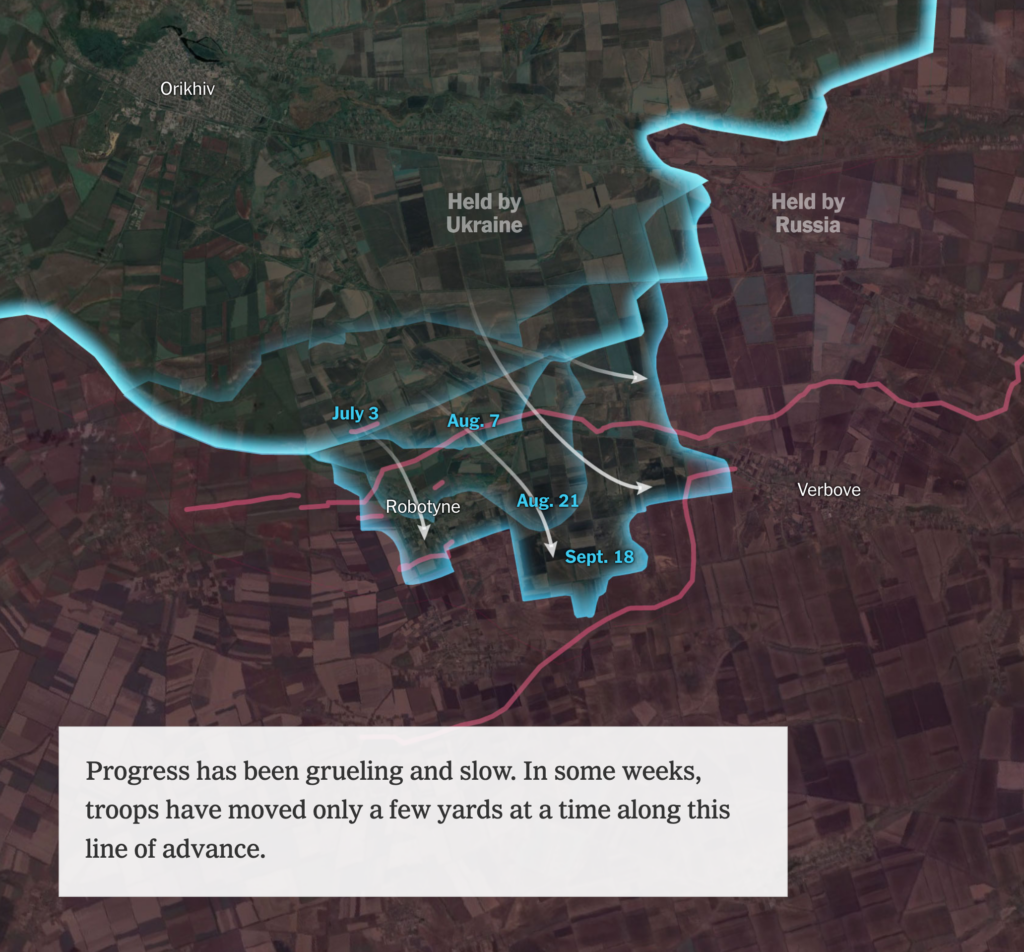
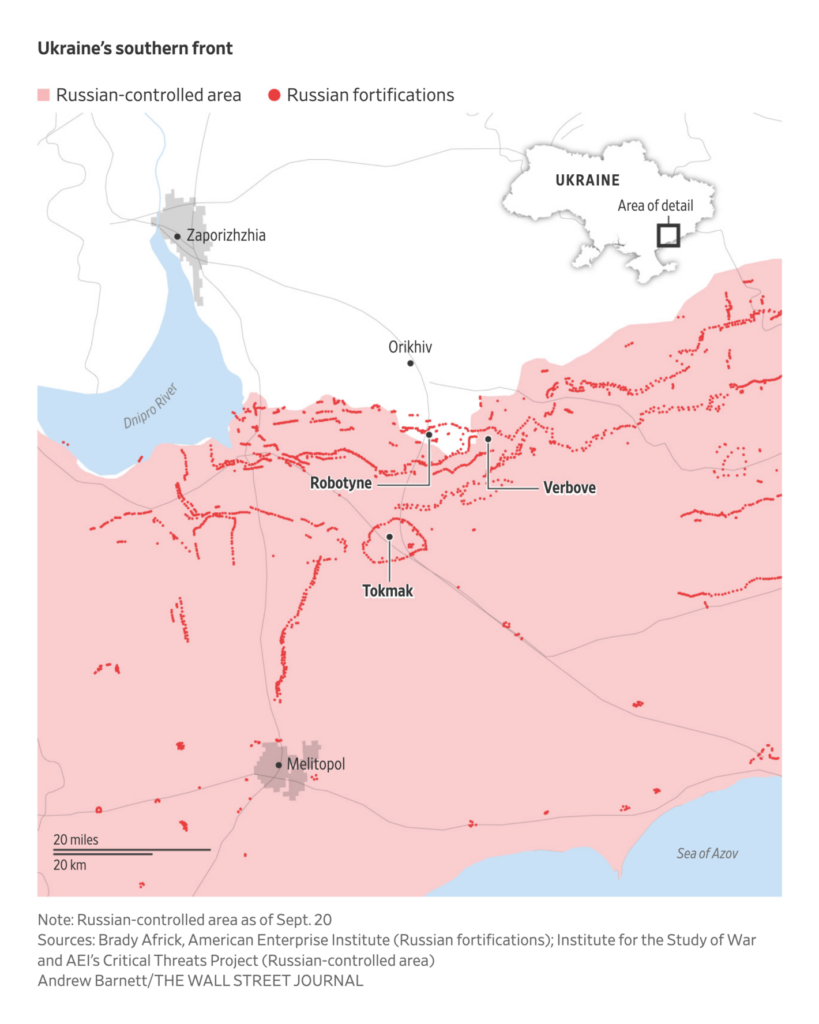
There were maps on the progress of Ukraine’s counteroffensive and on the conflict in Nagorno-Karabakh:
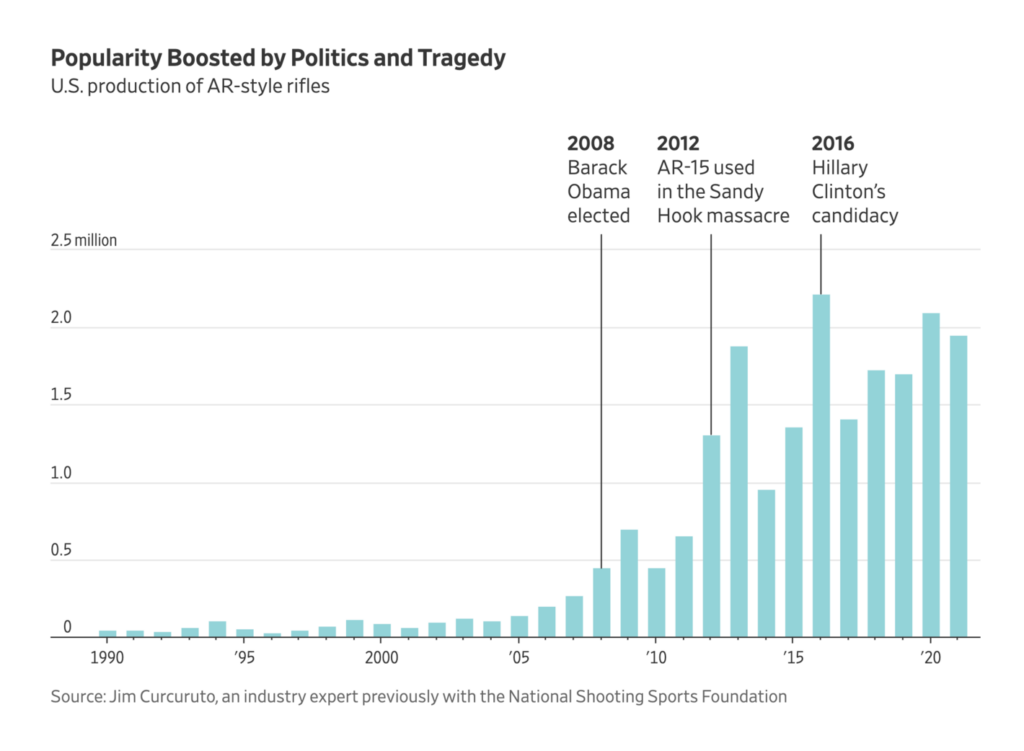
And on guns and gun violence in America:
Other charts looked at everything from undecided voters to the 2023 Asian Games:


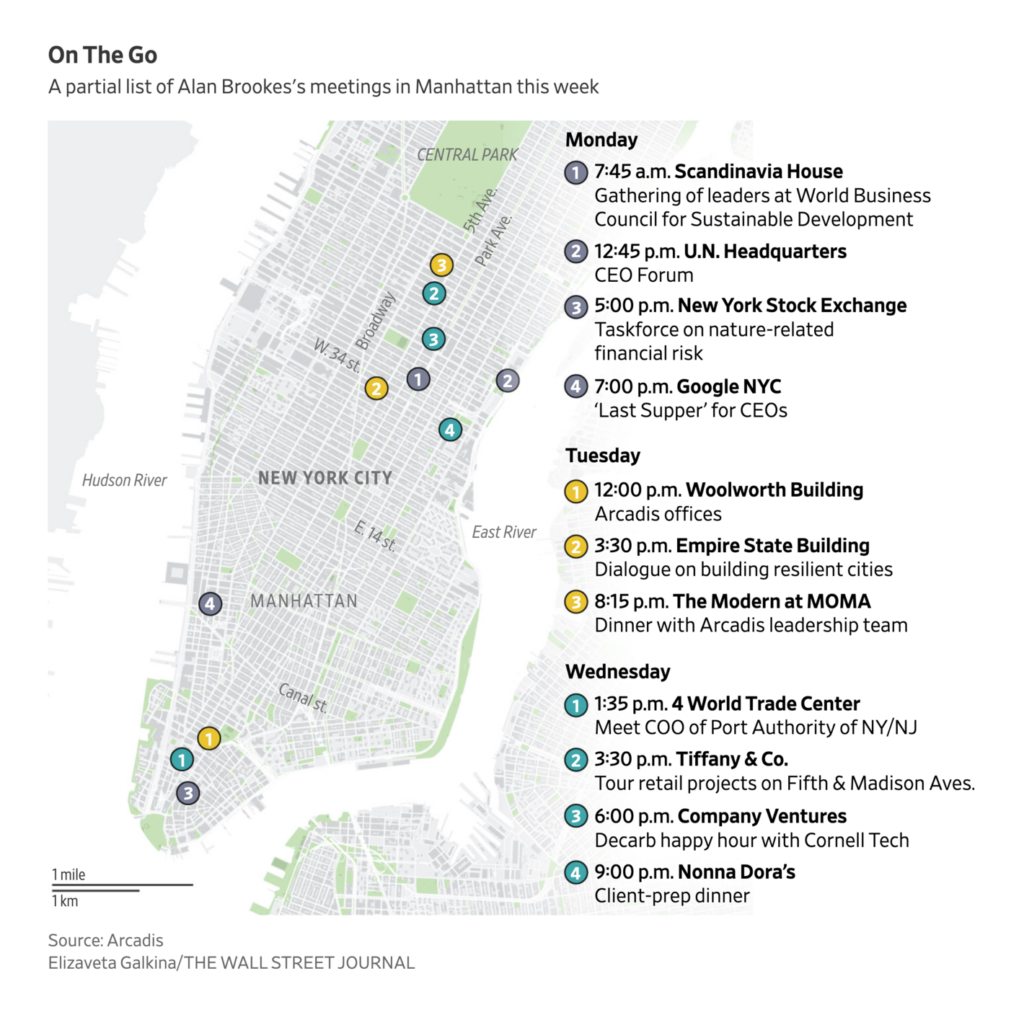
Finally, maps on corporate networking and Indian metro systems:


Applications are open for…
Help us make this dispatch better! We’d love to hear which newsletters, blogs, or social media accounts we need to follow to learn about interesting projects, especially from less-covered parts of the world (Asia, South America, Africa). Write us at hello@datawrapper.de or leave a comment below.
Want the Dispatch in your inbox every Tuesday? Sign up for our Blog Update newsletter!


Comments