Data Vis Dispatch,
September 28

The best of last week’s big and small data visualizations

Welcome back to the 15th edition of Data Vis Dispatch! Every week, we’ll be publishing a collection of the best small and large data visualizations we find, especially from news organizations — to celebrate data journalism, data visualization, simple charts, elaborate maps, and their creators.

And wow, what a week! Dozens of people in Germany and worldwide visualized the results of the German federal election on Sunday. You all created some astonishing live-updating charts and maps (while barely getting any sleep). Thank you! This Dispatch is full with them.

Other recurring topics include the climate, abortion laws, migration and covid-19.

First, the German election. Lots of national newsrooms prepared for this night for weeks and months, like ZEIT Online, Der SPIEGEL, Süddeutsche Zeitung, Funke Interaktiv (working e.g. for Berliner Morgenpost), ZDF, Frankfurter Allgemeine, and many more.

International newsrooms, too – like The Washington Post, The Economist, Reuters, Financial Times, The Guardian, Neue Zürcher Zeitung, and Bloomberg – showed the results either directly on election night or a day later.

The Economist: Germany’s election result 2021, September 27
The Guardian: German election 2021: full results and analysis, September 26
Bloomberg: German Election Results, September 26
Der SPIEGEL: So hat Deutschland gewählt – aktuelle Ergebnisse, September 26
Hamburger Abendblatt/Funke Interaktiv: So hat Hamburg gewählt – Wahlergebnisse der Wahllokale und Stadtteile, September 26
Berliner Morgenpost/Funke Interaktiv: Ergebnisse aller Wahlkreise, mögliche Koalitionen: So hat Deutschland gewählt, September 26
Berliner Morgenpost/Funke Interaktiv: Ergebnisse und Auswertungen: So hat Ihr Kiez bei der Bundestagswahl gestimmt, September 26
ZEIT Online: Alle Ergebnisse der Bundestagswahl 2021, September 26

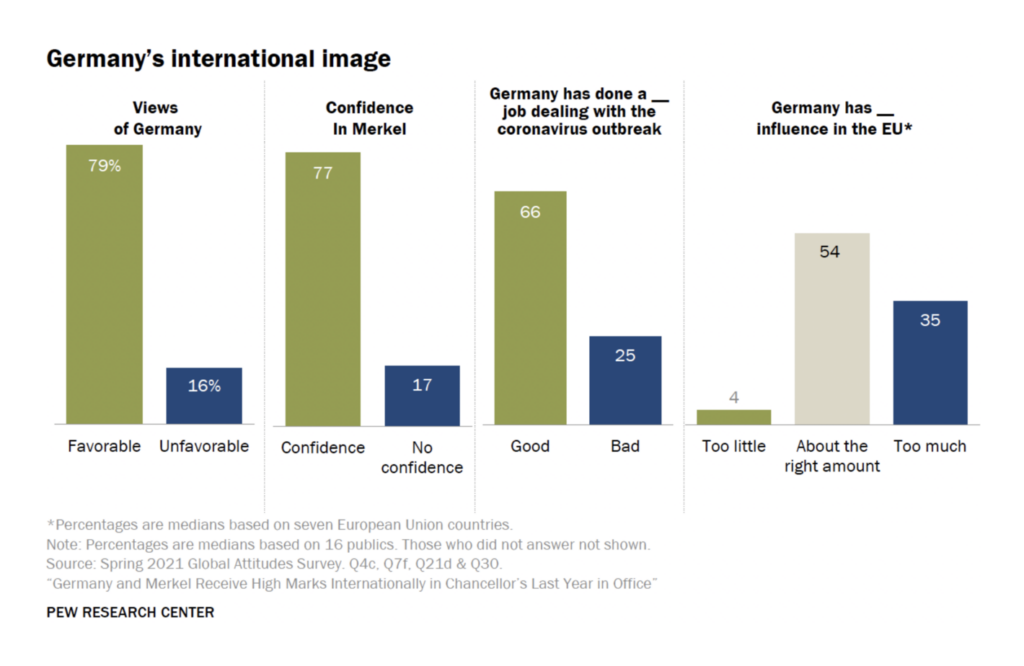
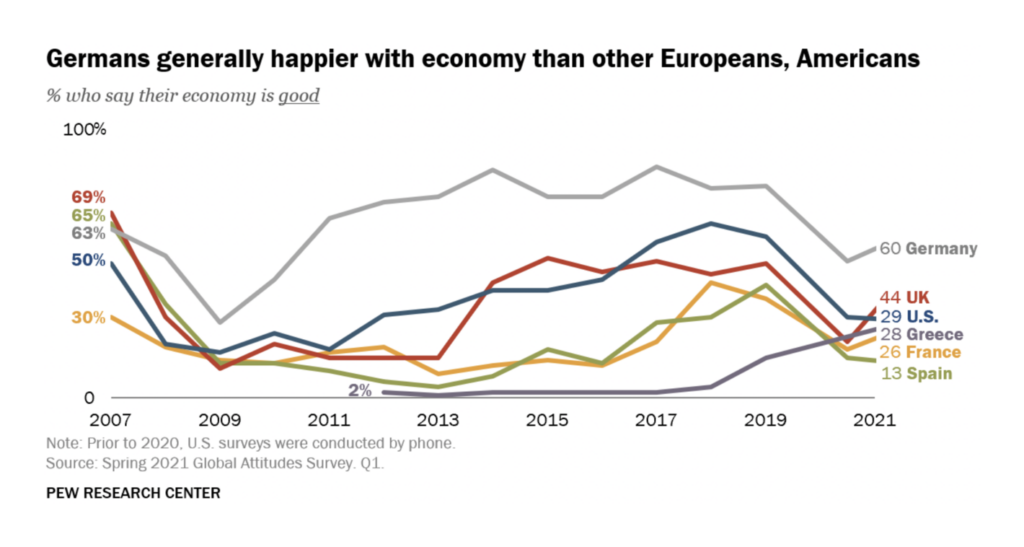
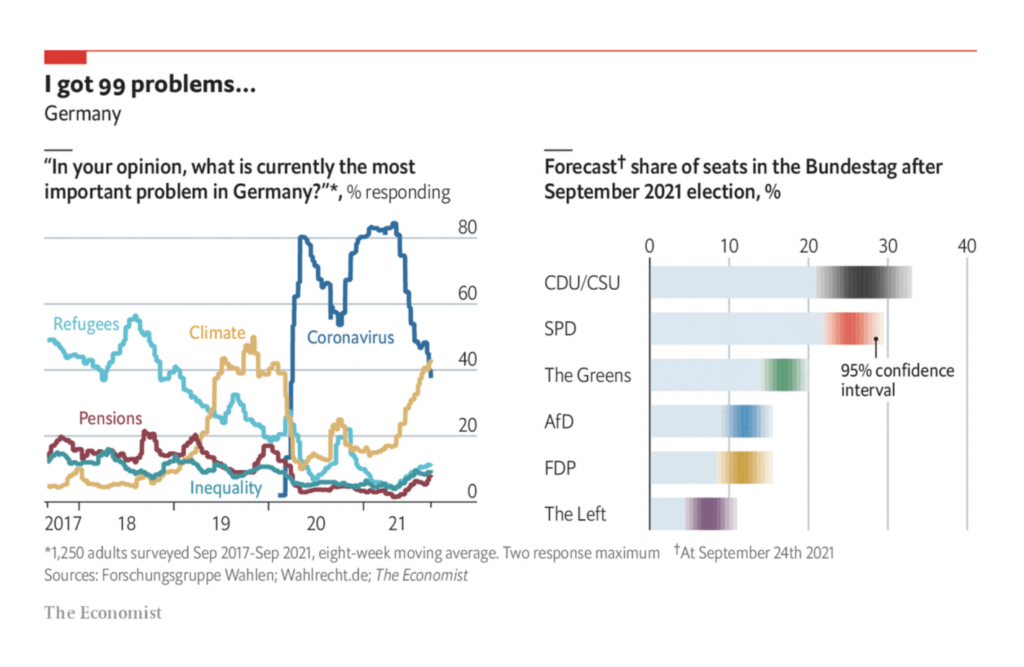
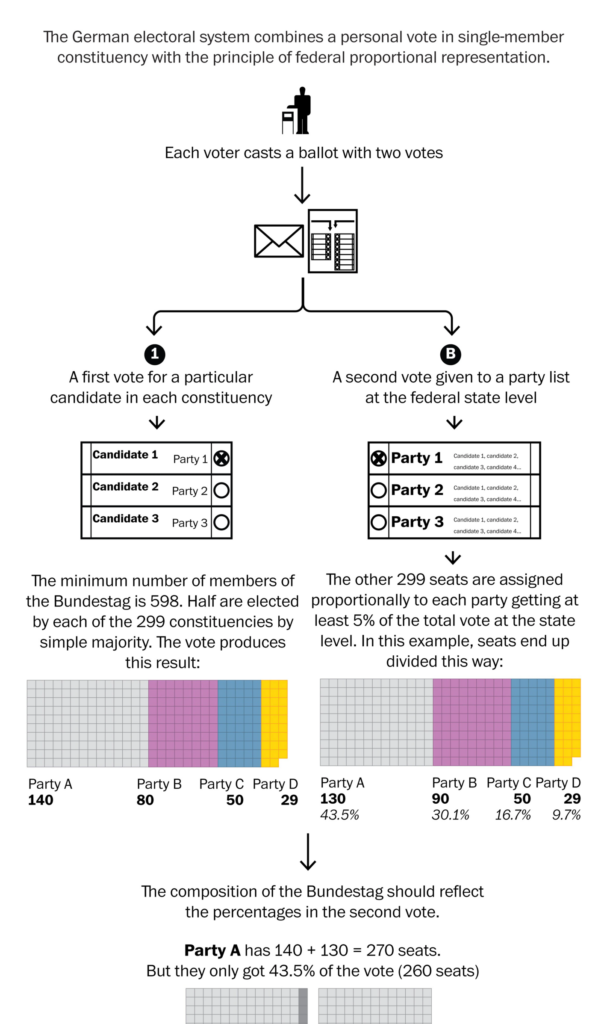
But even before the election, newsrooms were on fire. How does the German election work in general? How happy were Germans before the election? And how happy was the world with Germany? Lots of newsrooms already covered election-related questions before Sunday:

Pew Research Center: Germany and Merkel Receive High Marks Internationally in Chancellor’s Last Year in Office, September 22
Pew Research Center: Merkel will end her tenure in office as a leader who was internationally popular during tumultuous times, September 22
The Economist: The climate has overtaken covid-19 as German voters’ top concern, September 24
Tagesspiegel: Bildananalyse aller 27.682 Wahlkampf-Fotos der Parteien, September 26
rbb24: Welche Parteien die treuesten Wähler und Wählerinnen haben, September 23
The Washington Post: German Election 2021, September 26
ZEIT Online: Sag mir, wo du wirklich stehst, September 22

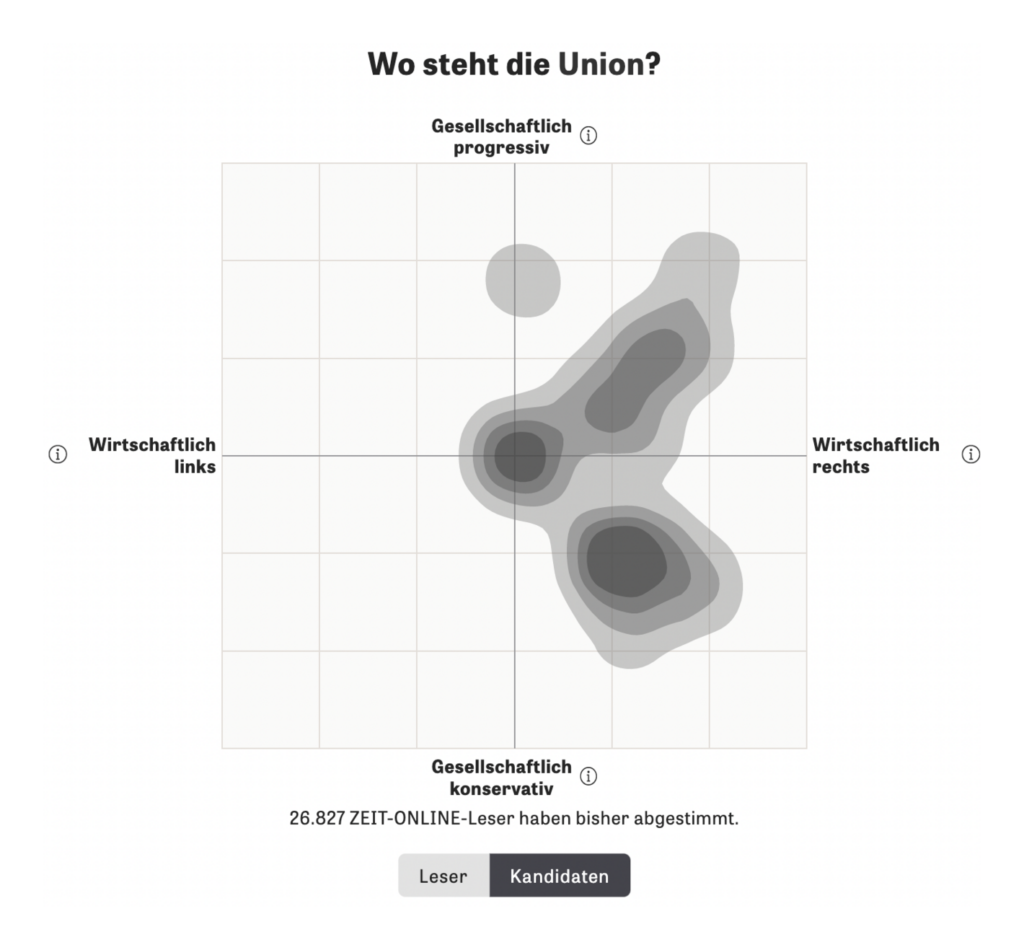
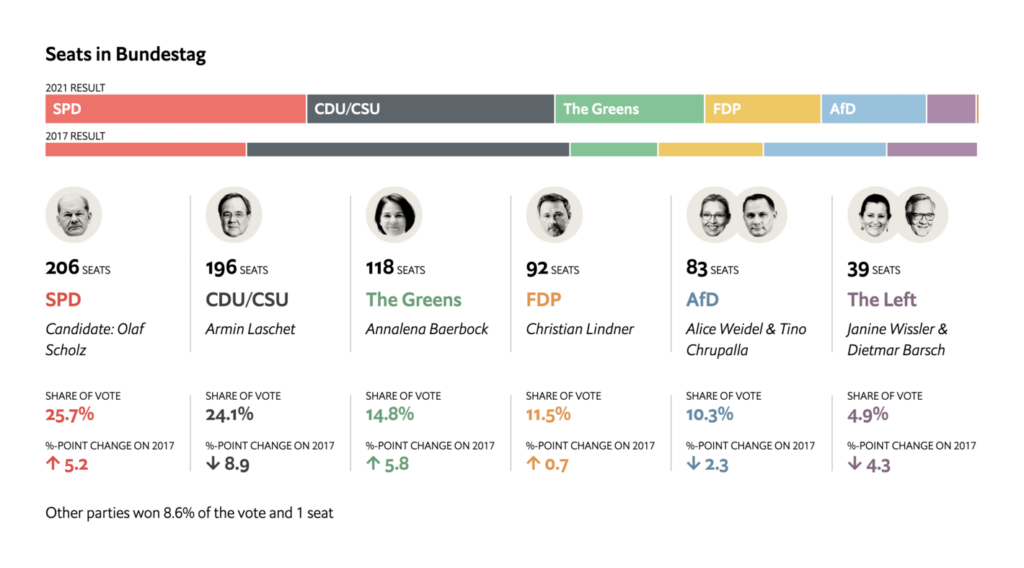
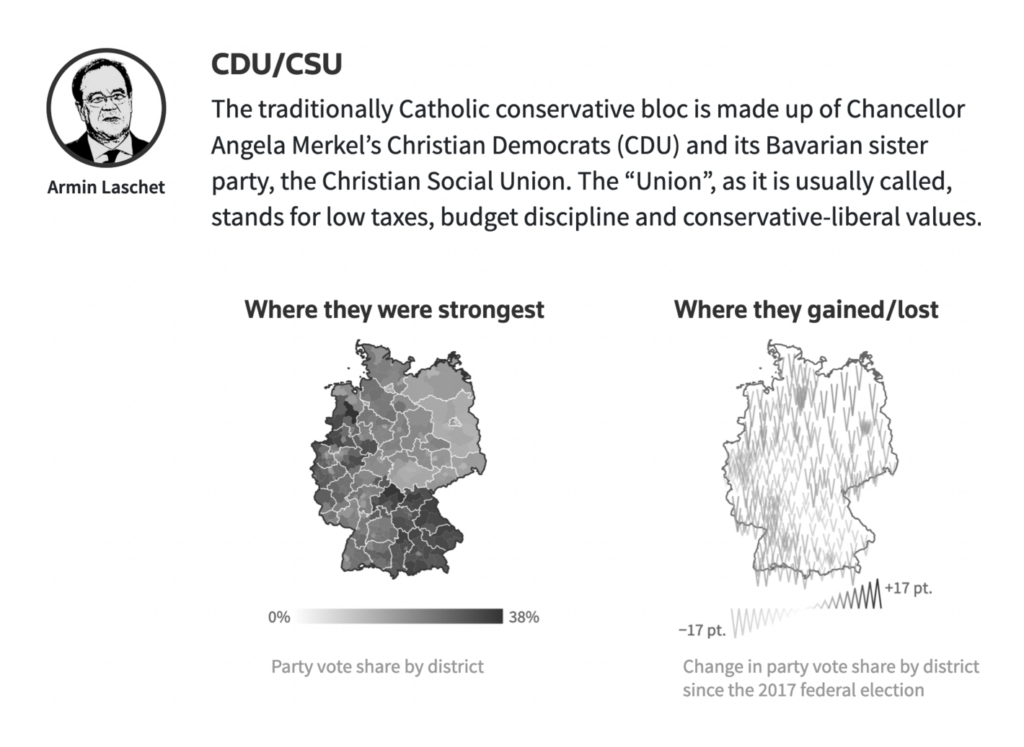
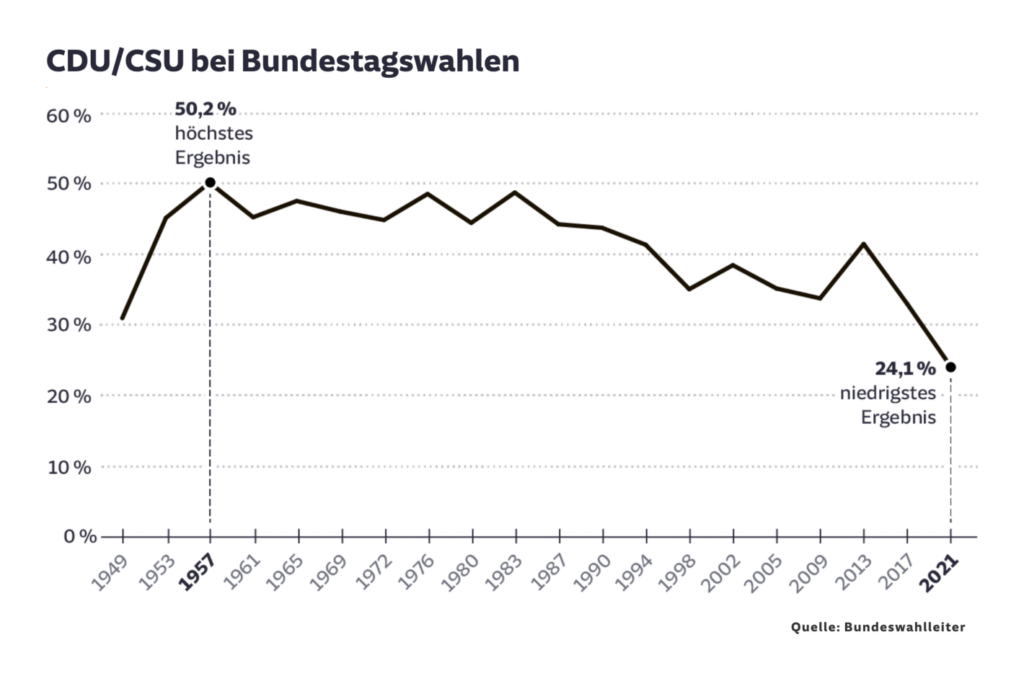
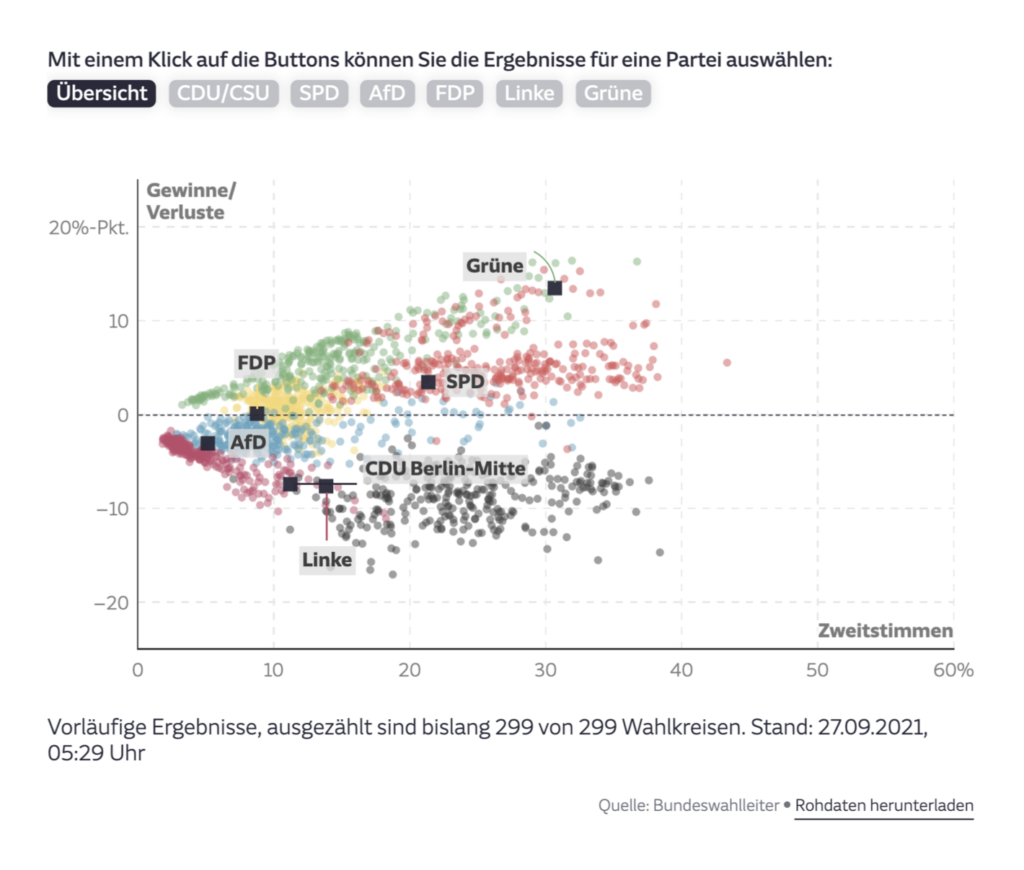
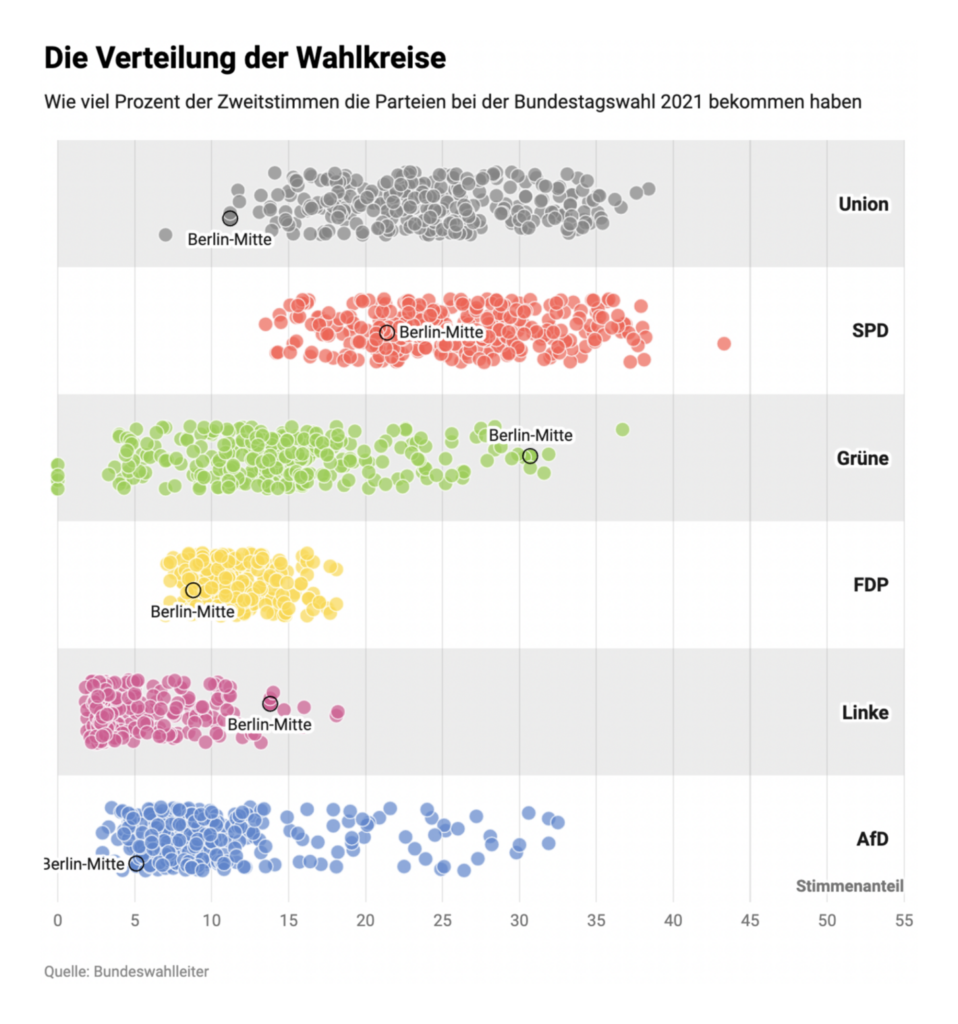
Most interesting on election sunday and the day after was probably the bad result of Angela Merkel’s party CDU/CSU:

Reuters: The German election, September 27
Süddeutsche Zeitung: Falscher Kandidat, fehlende Kompetenz, September 27
Der SPIEGEL: Berlin-Mitte geht an Hanna Steinmüller (Grüne), September 26
Süddeutsche Zeitung: Die Ergebnisse für den Wahlkreis Berlin-Mitte, September 27
RedaktionsNetzwerk Deutschland: Wahlkreis Berlin-Mitte: Ergebnisse der Bundestagswahl 2021 in Grafiken, September 26

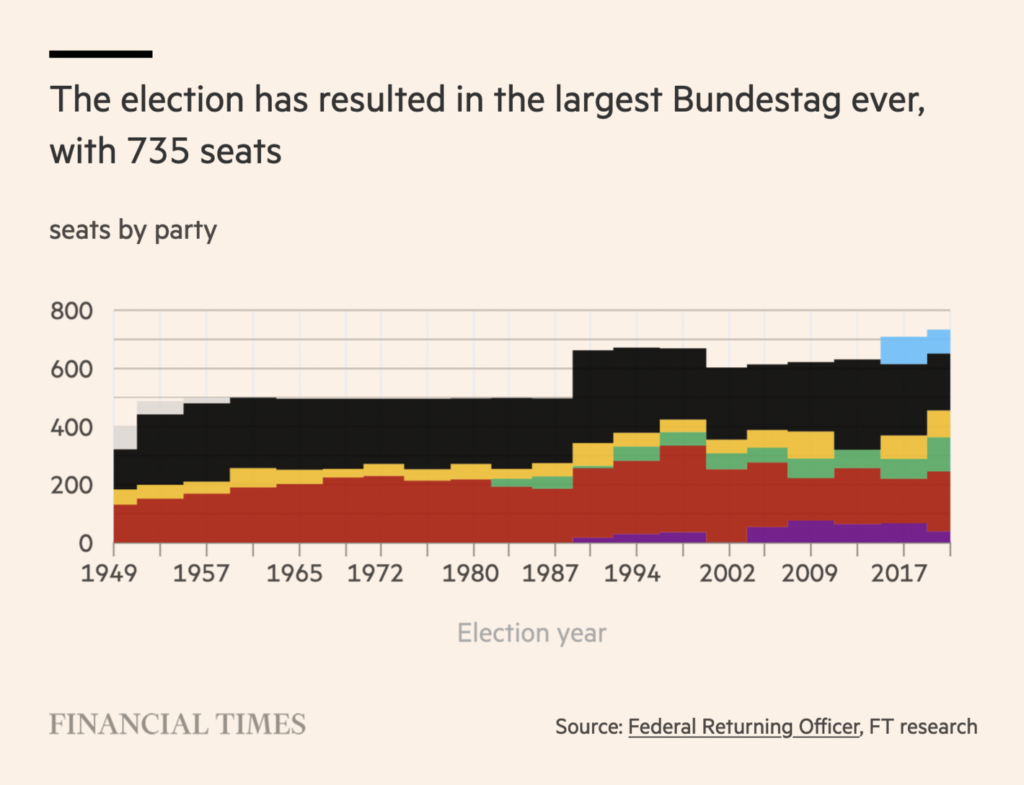
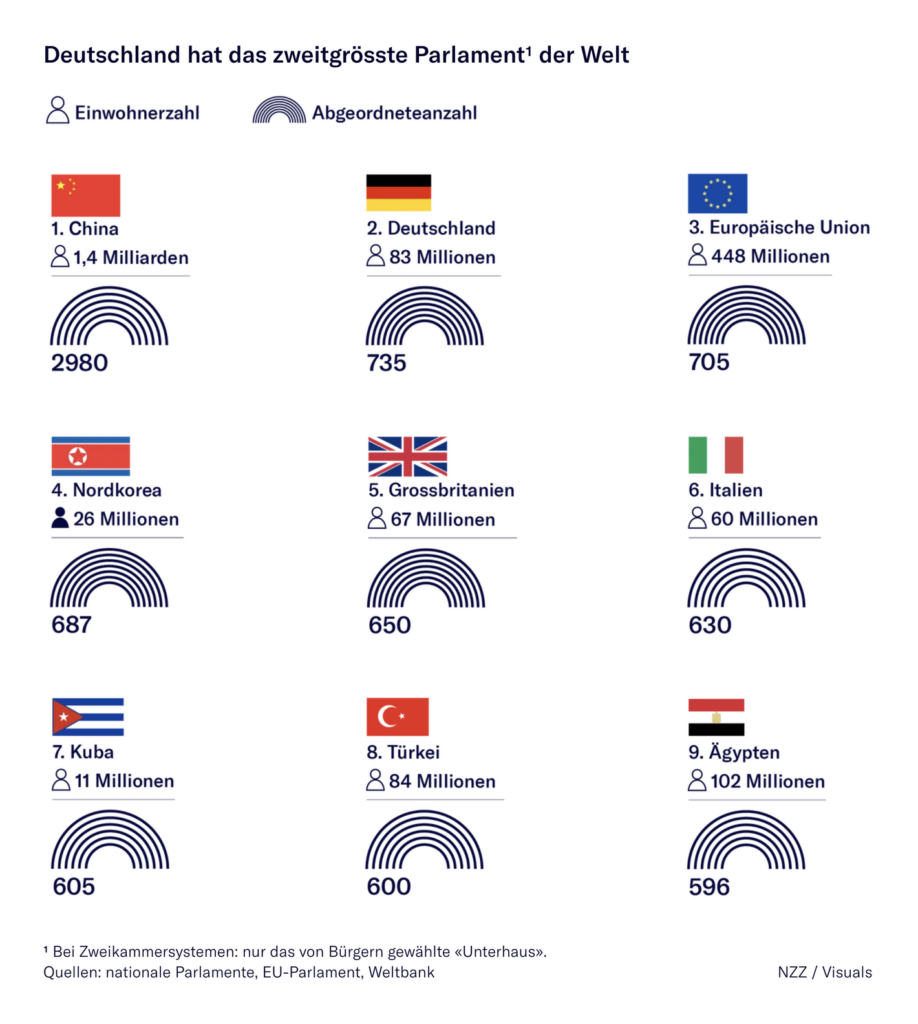
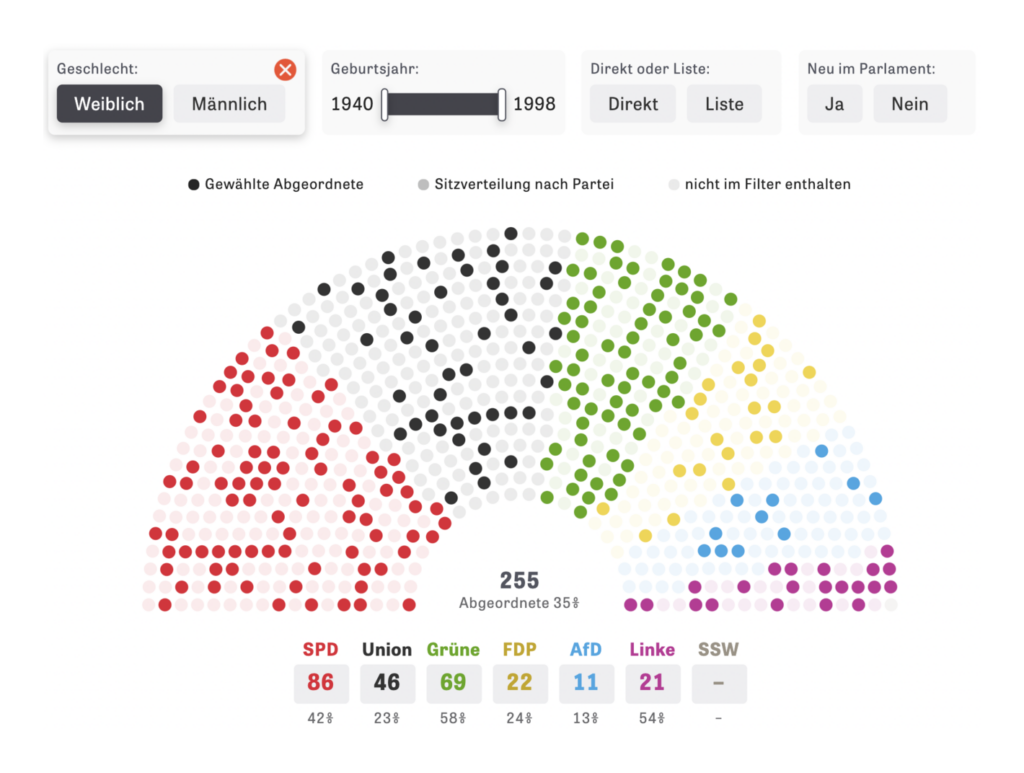
…and lots of newsrooms visualized the big size of the new parliament. With 735 seats, it’s the second-biggest parliament in the world.

Financial Times: Germany’s election results in charts and maps, September 27
Neue Zürcher Zeitung: Bundestagswahl: Alle Ergebnisse im Überblick, September 26
ZEIT Online: So groß und jung wie noch nie, September 28
Der SPIEGEL: Das ist der neue XXL-Bundestag, September 27

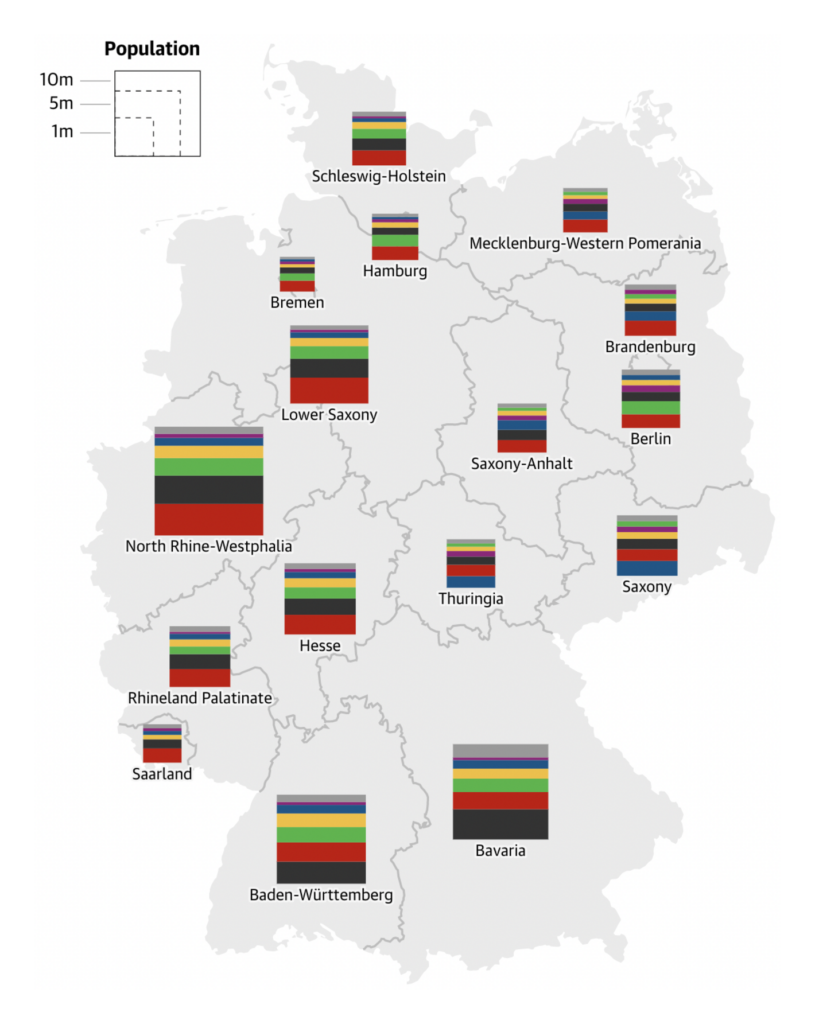
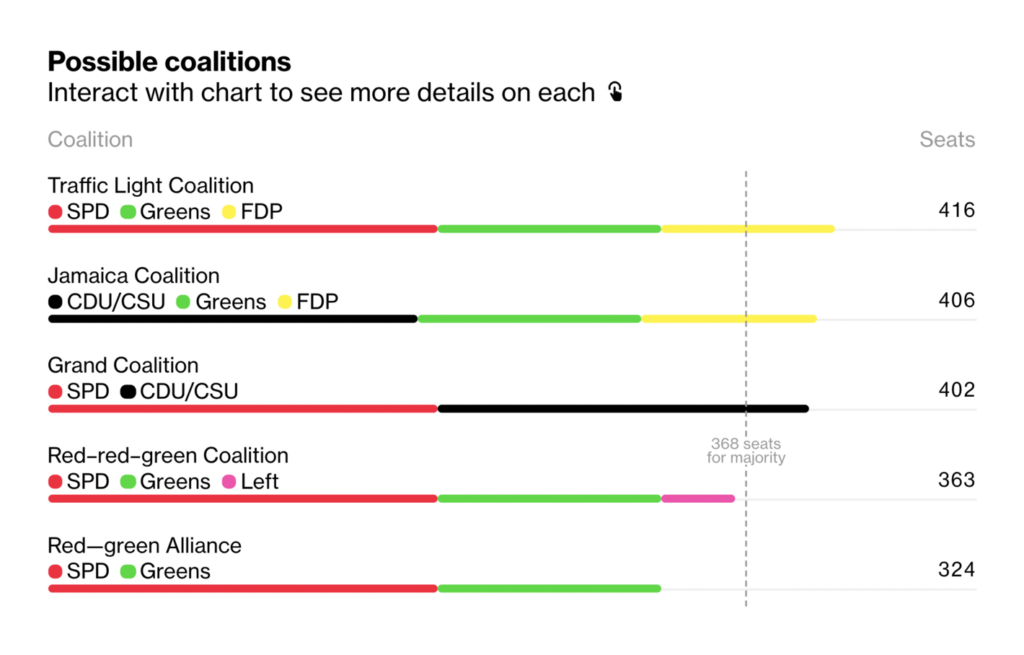
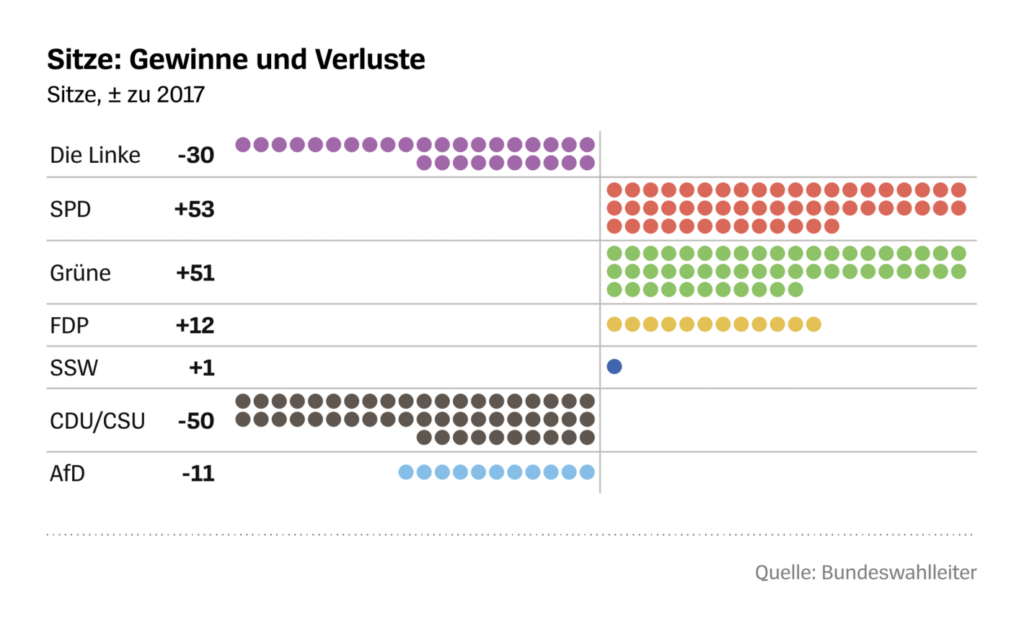
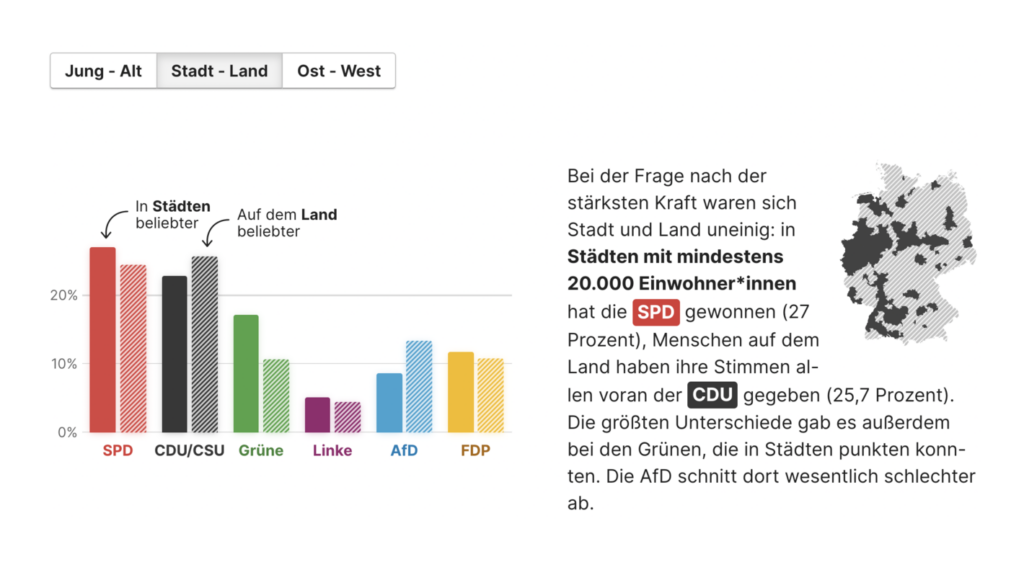
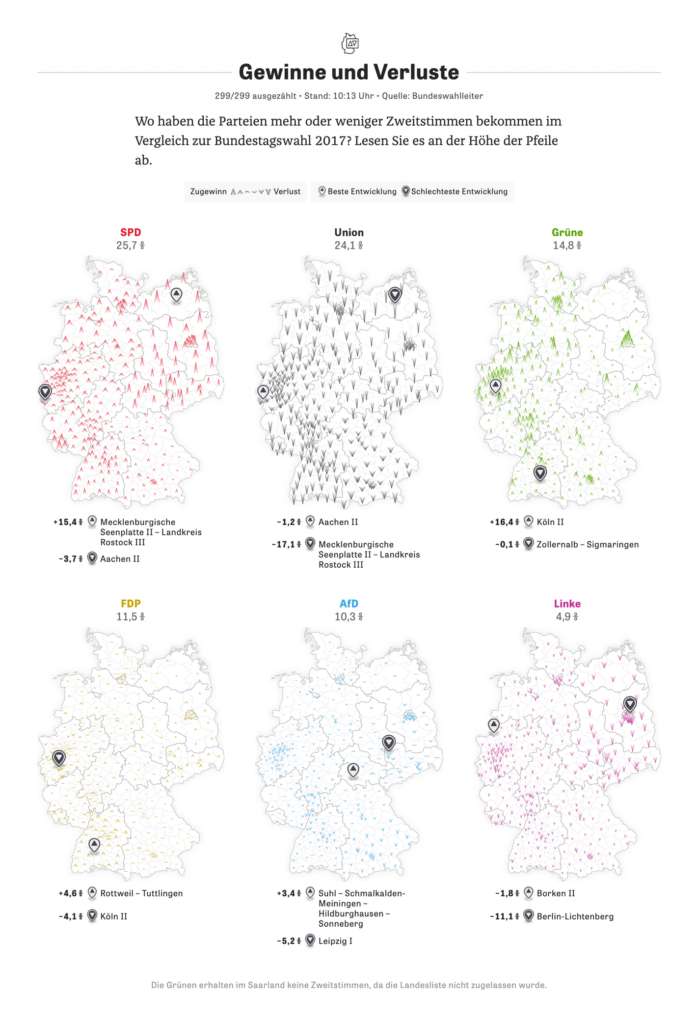
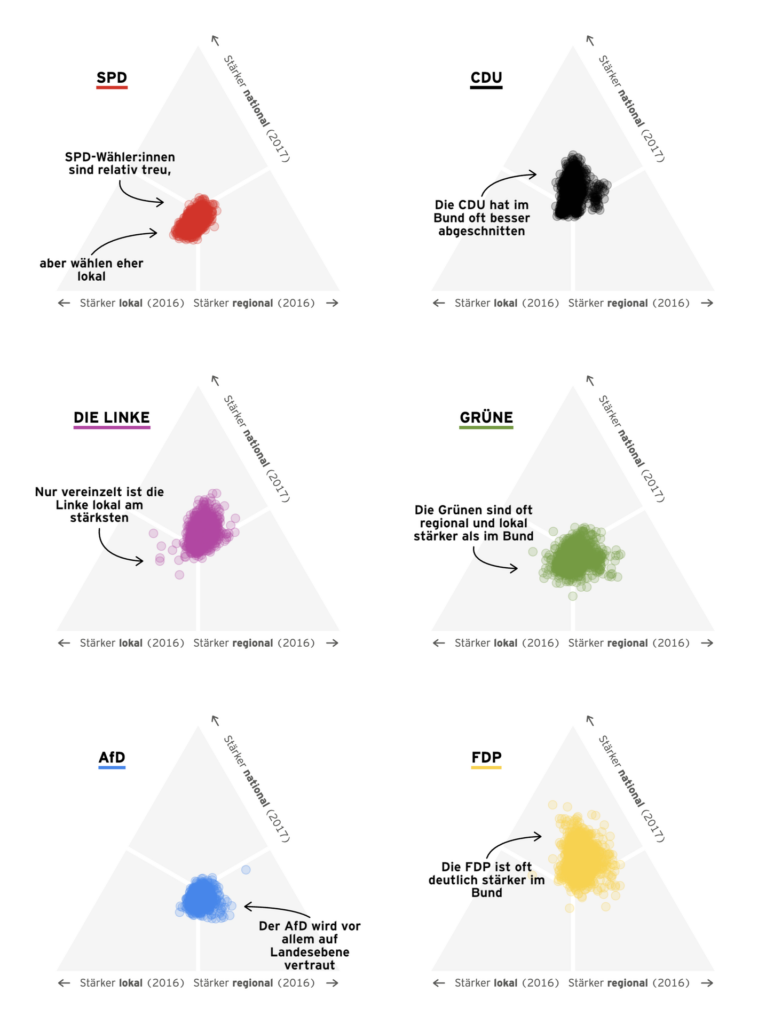
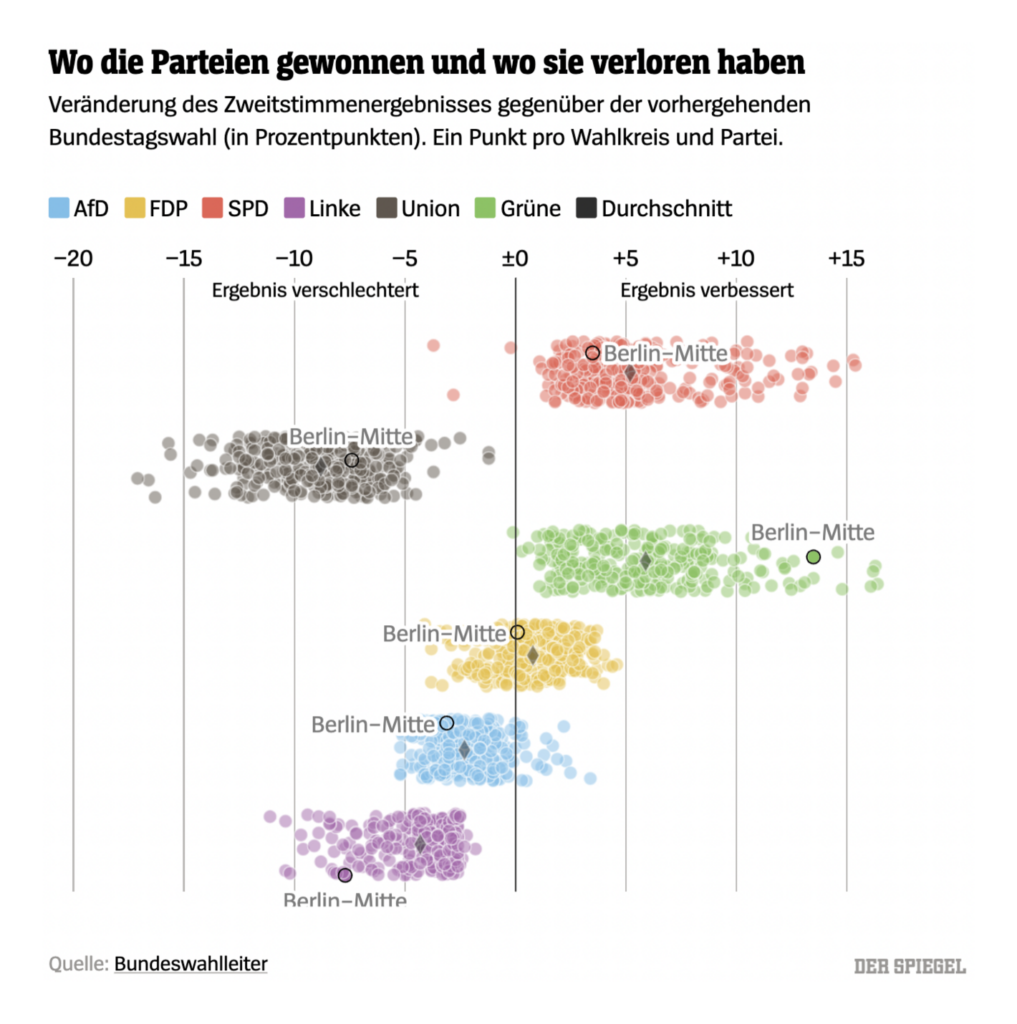
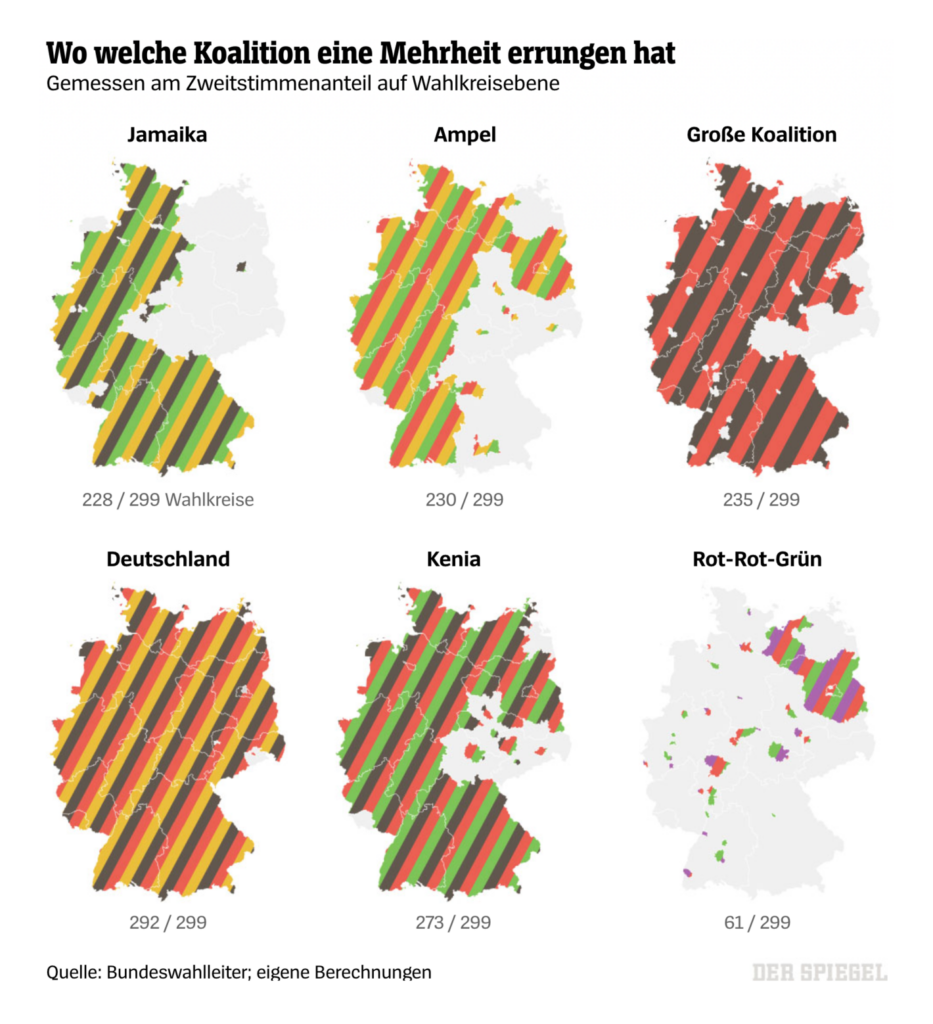
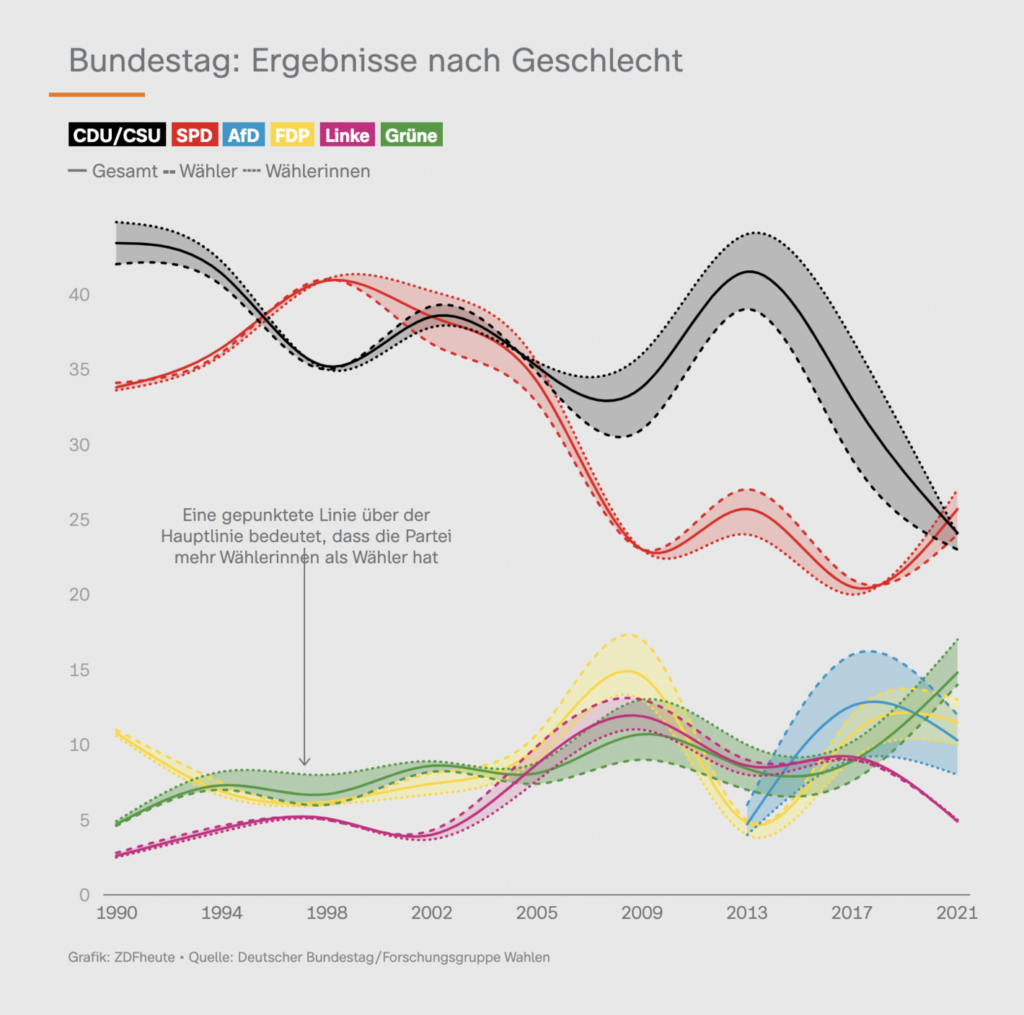
And of course, the classic election analysis followed a day later. Which coalitions got a majority of votes where? Which voters decided differently than in 2017?

Der SPIEGEL: Das Ende der schwarzen Republik, September 27
ZDF: Haben die Alten die Wahl entschieden?, September 27
ZEIT Online: Wohin die Union ihre Wählerschaft verloren hat, September 27

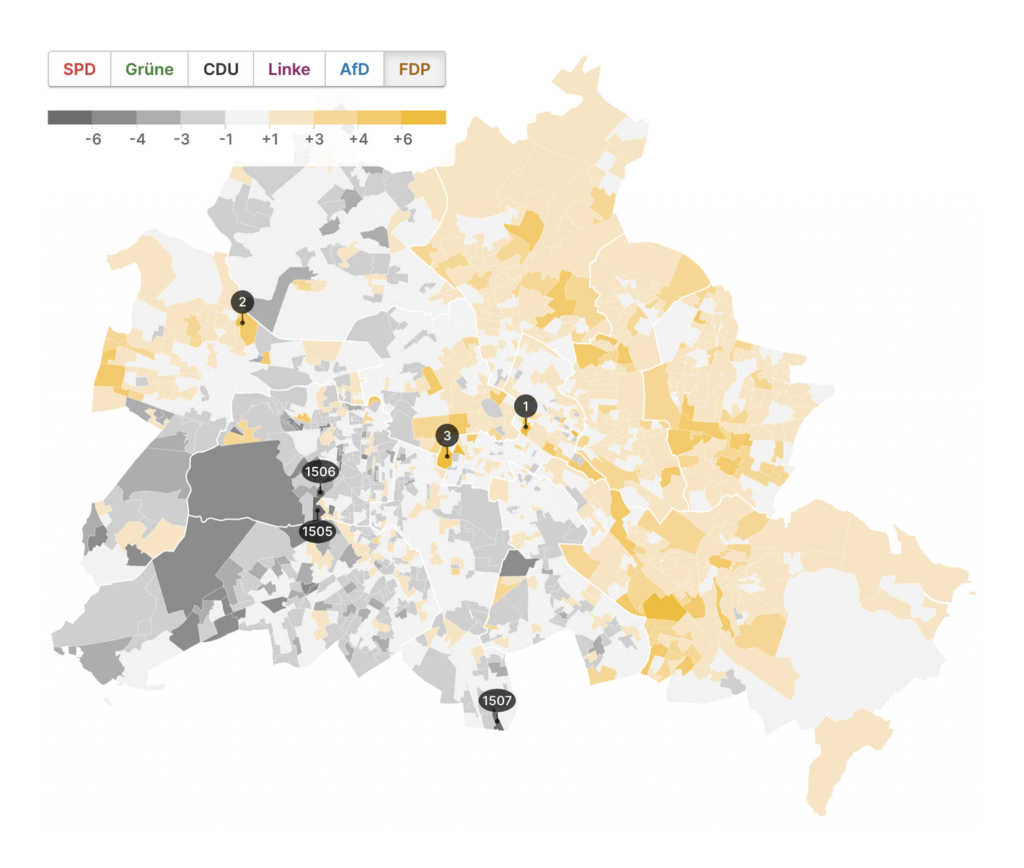
Datawrapper is based in Berlin, and here we also voted for or against a referendum that could transfer more than 200,000 Berlin apartments into public ownership. Housing is a big topic, not just in Germany:

Bloomberg: Berlin Referendum Could Determine the Future of the City’s Housing, September 23
San Francisco Chronicle: These charts show what types of homes exist in San Francisco and what is getting built, September 22

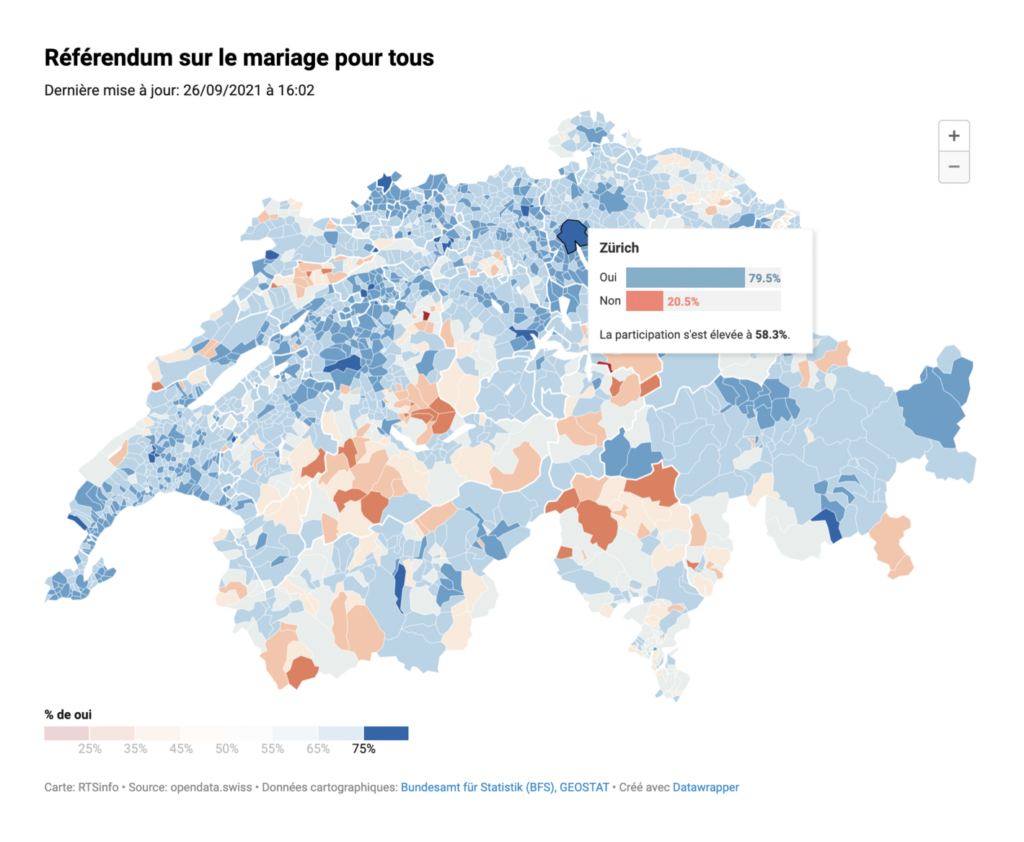
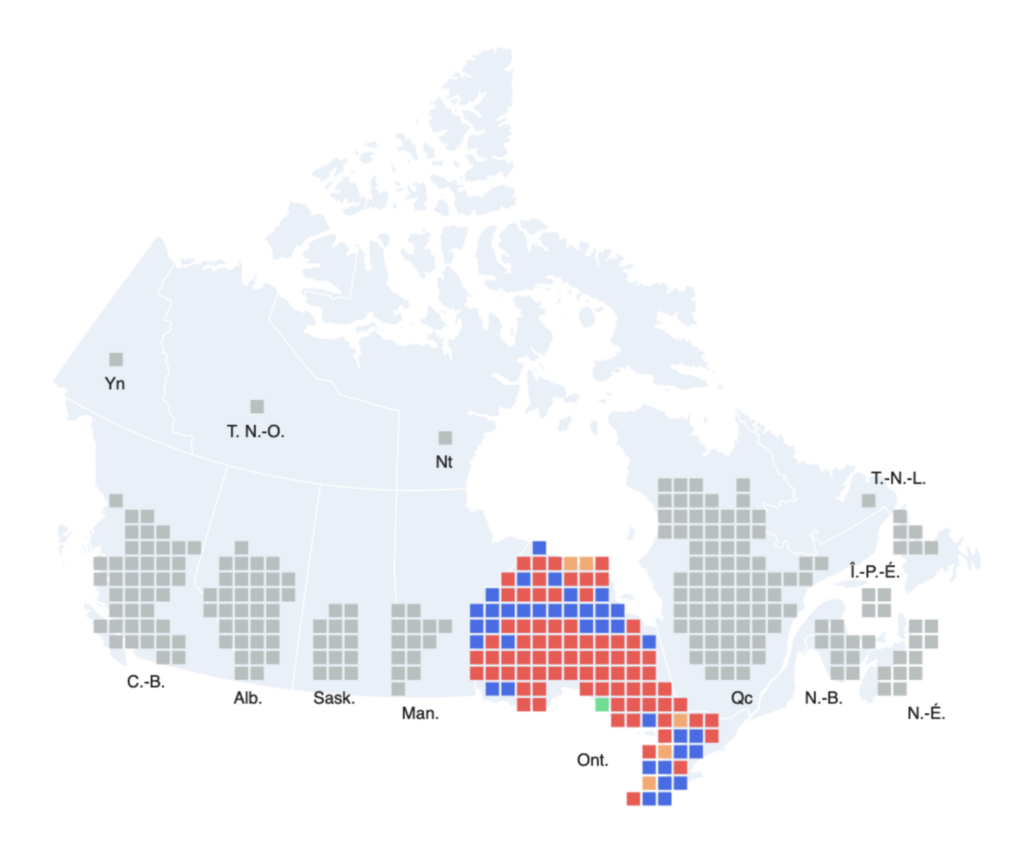
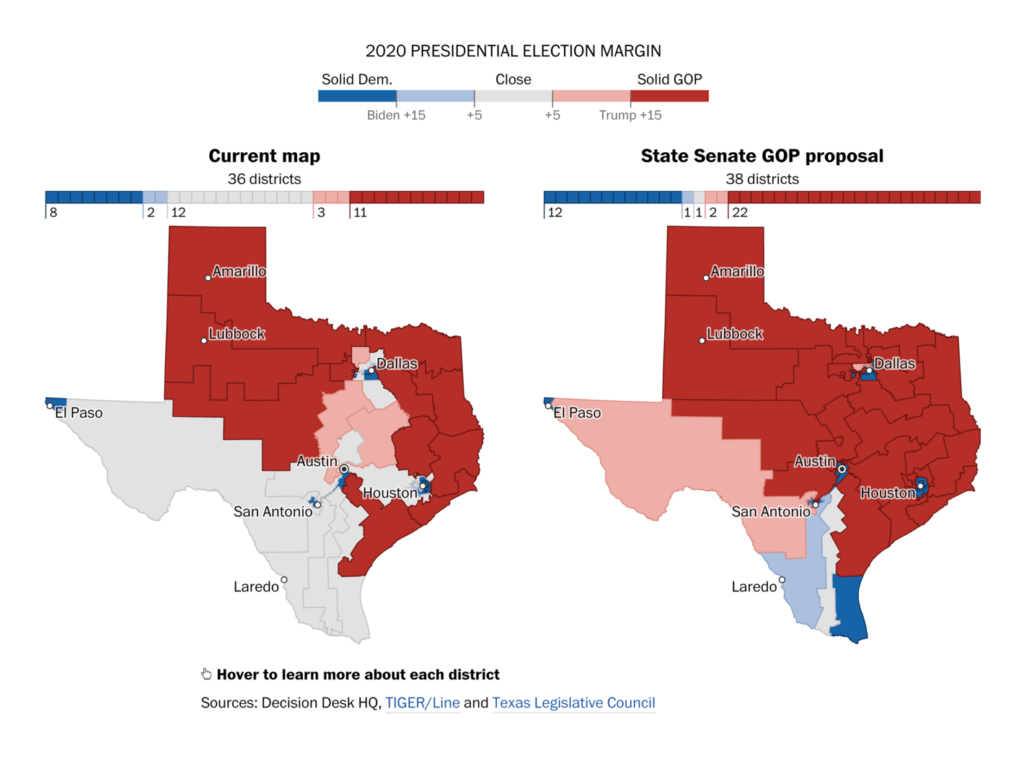
But politics also happened in other parts of the world. Swiss voters decided they want same-sex marriage to be legal. And U.S. parties are still trying to figure out how to redraw the borders of electoral districts to their advantage.

RTS: Les cartes des résultats des votations fédérales, commune par commune, September 26
Le Devoir: Voici la nouvelle composition de la Chambre des communes, September 22
The Washington Post: Texas GOP lawmakers’ redistricting map protects congressional incumbents while avoiding a new Latino-majority seat, September 27
The Washington Post: New York’s redistricting tests Democratic opposition to gerrymandering, September 27

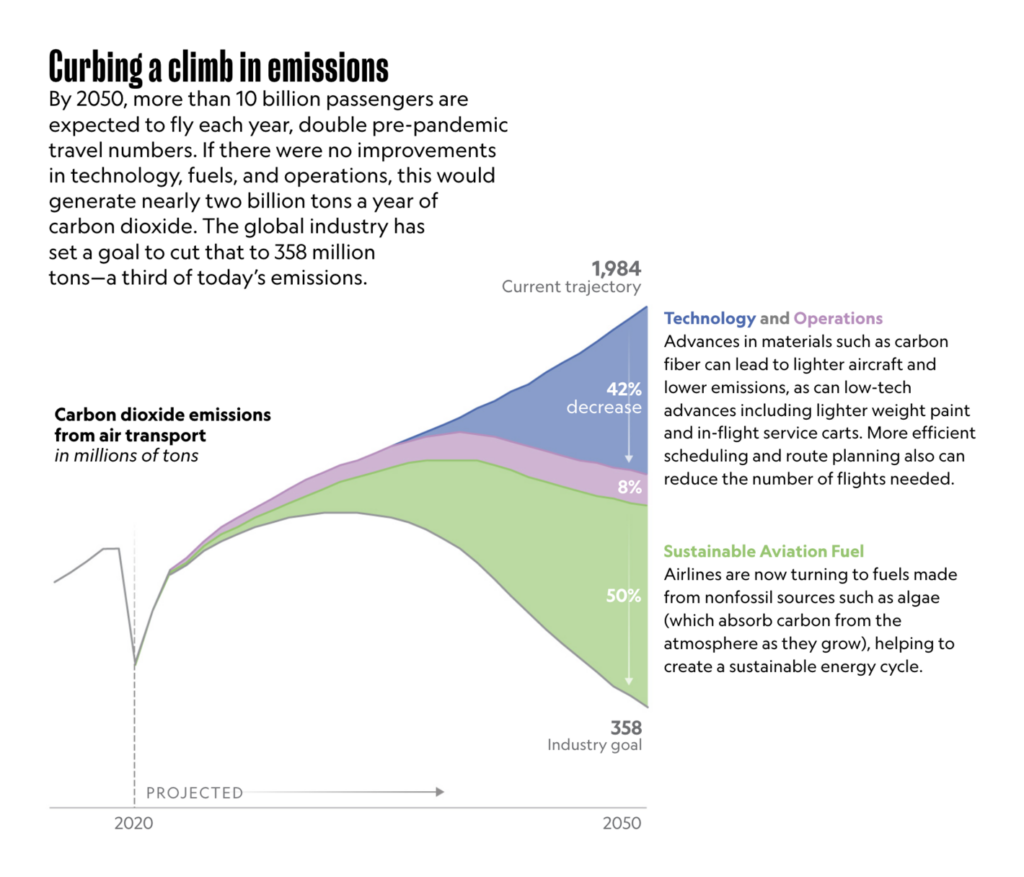
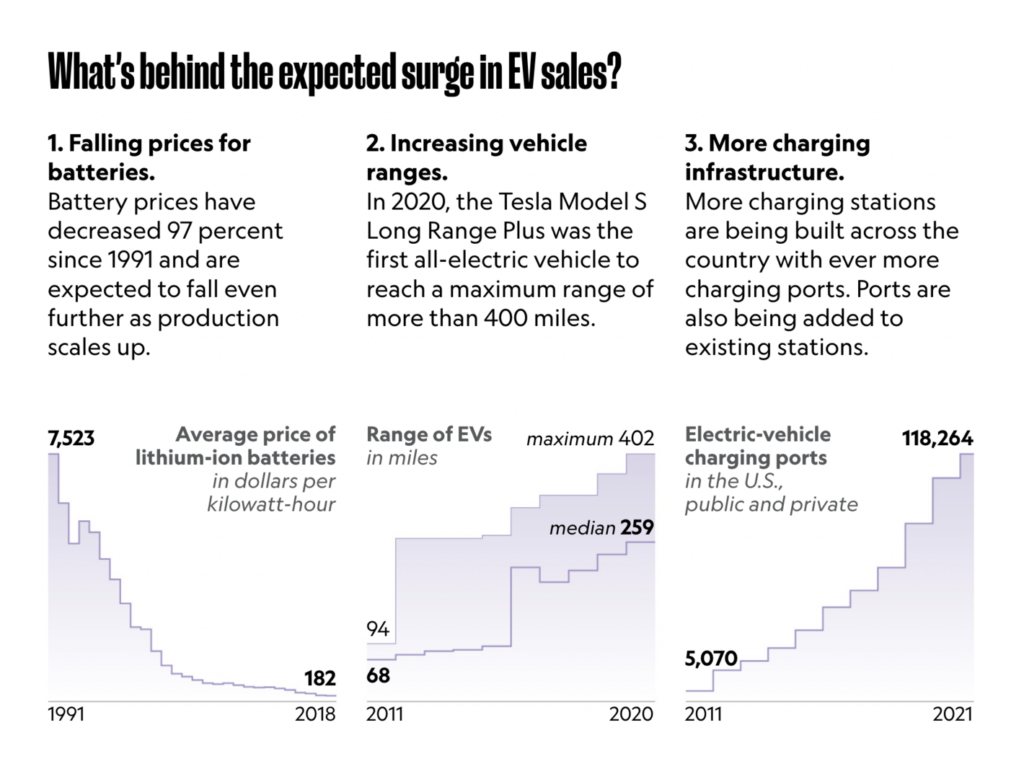
In climate news, we got new disturbing research, but also ideas on how to make flights and cars more climate-friendly:

NASA Earth Observatory: Research Shows More People Living in Floodplains, September 27
Le Monde: Arctique : comment les acteurs financiers soutiennent l’expansion pétrolière et gazière et alimentent la crise climatique, September 23
National Geographic: Greener Skies Ahead: Take a look inside the Flying-V, September 23
National Geographic: Charging ahead: How electric cars will dominate global sales within 20 years, September 23

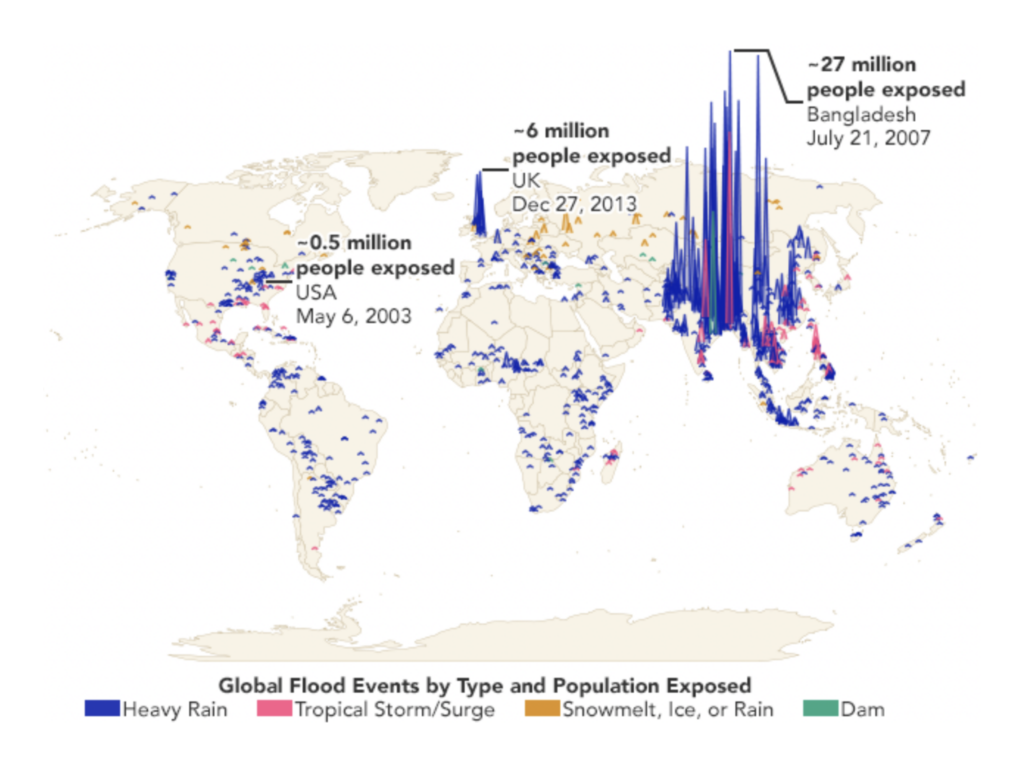
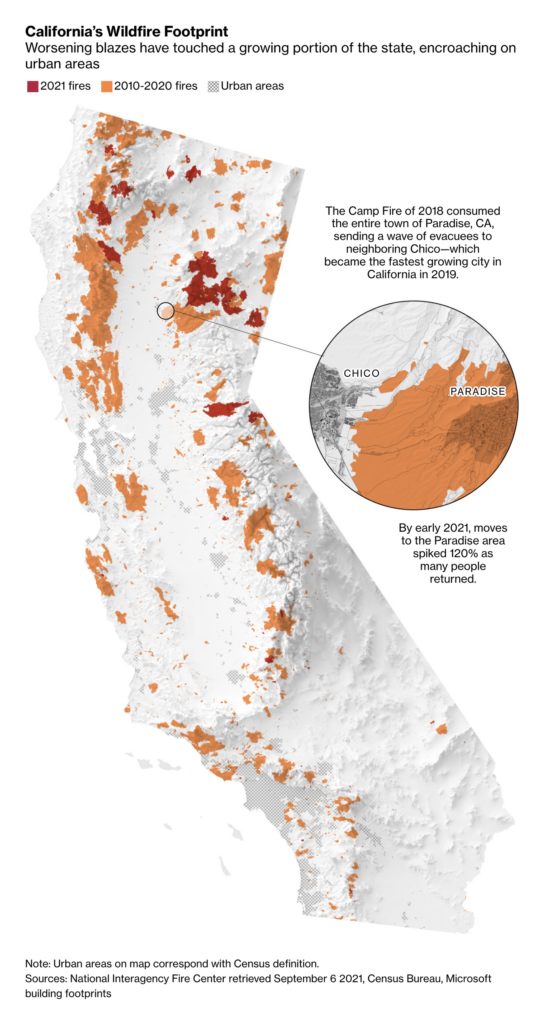
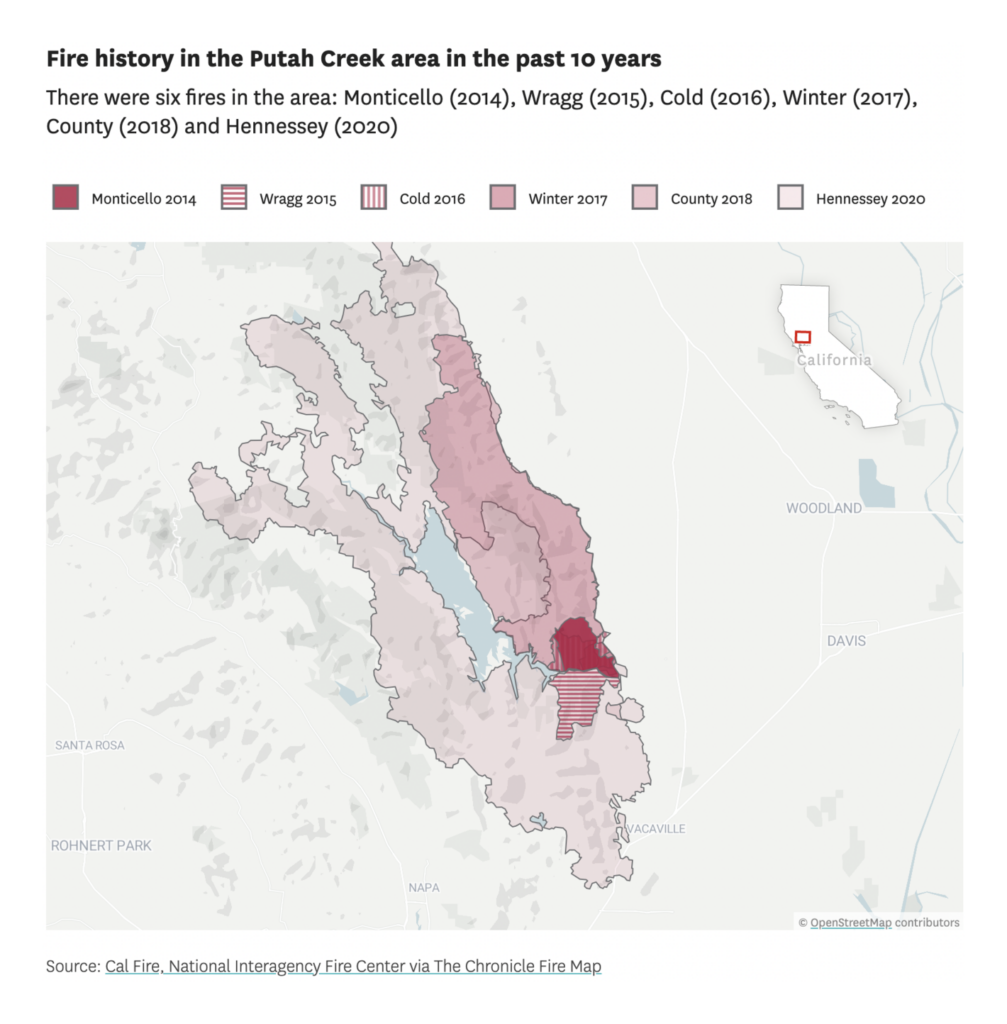
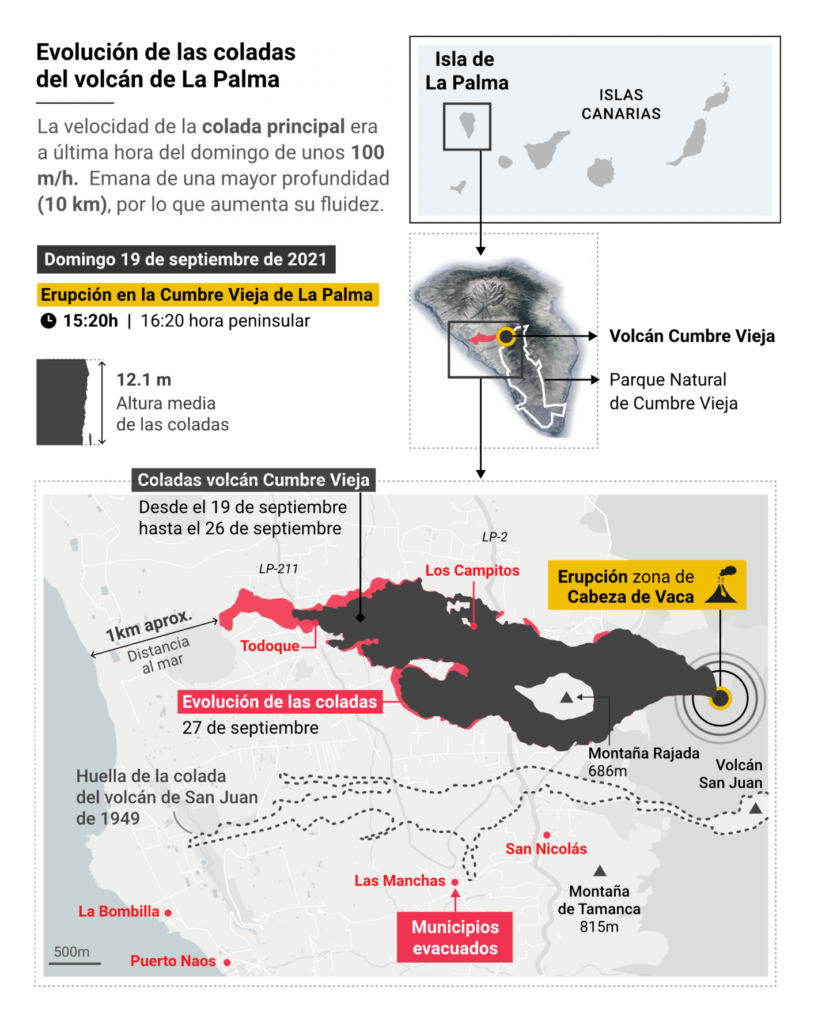
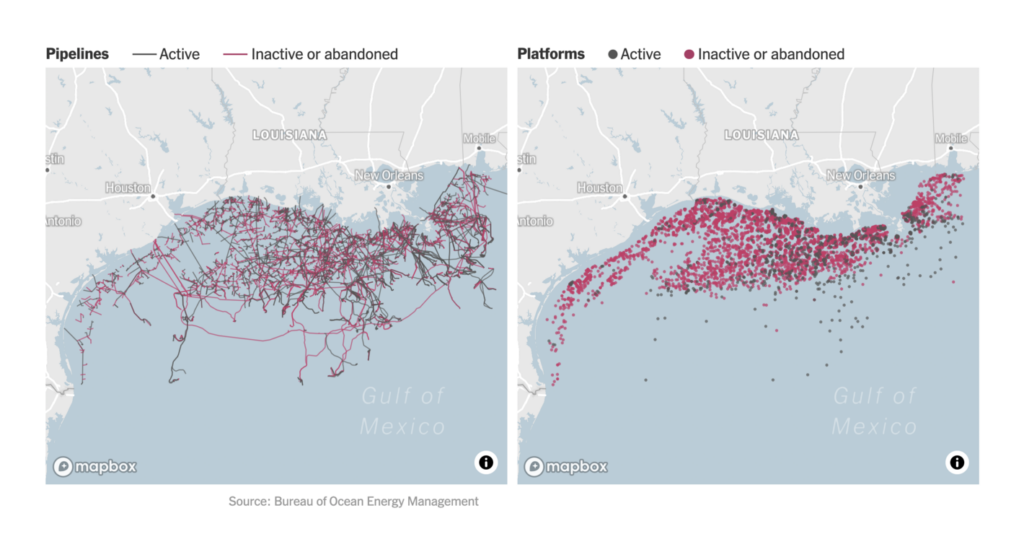
When it comes to the environment, we saw new maps and charts on old disasters: The fires on the U.S. west coast, the volcano eruption on La Palma (find more visualizations about that here), and oil spills in the Gulf of Mexico:

Bloomberg: More Americans Are Moving Into Fire-Risky Areas, September 24
San Francisco Chronicle: California fires over 10 years: See 170-plus areas where blazes repeatedly ignited, September 21
El Confidential: Un río de lava de tipo “hawaiano” arrasa 589 viviendas y está a un km del mar, September 28
El País: Mapa casa a casa del avance del volcán de La Palma: la lava alcanza 740 edificios y amenaza otros 1.500, September 28
The New York Times: After Hurricane Ida, Oil Infrastructure Springs Dozens of Leaks, September 26

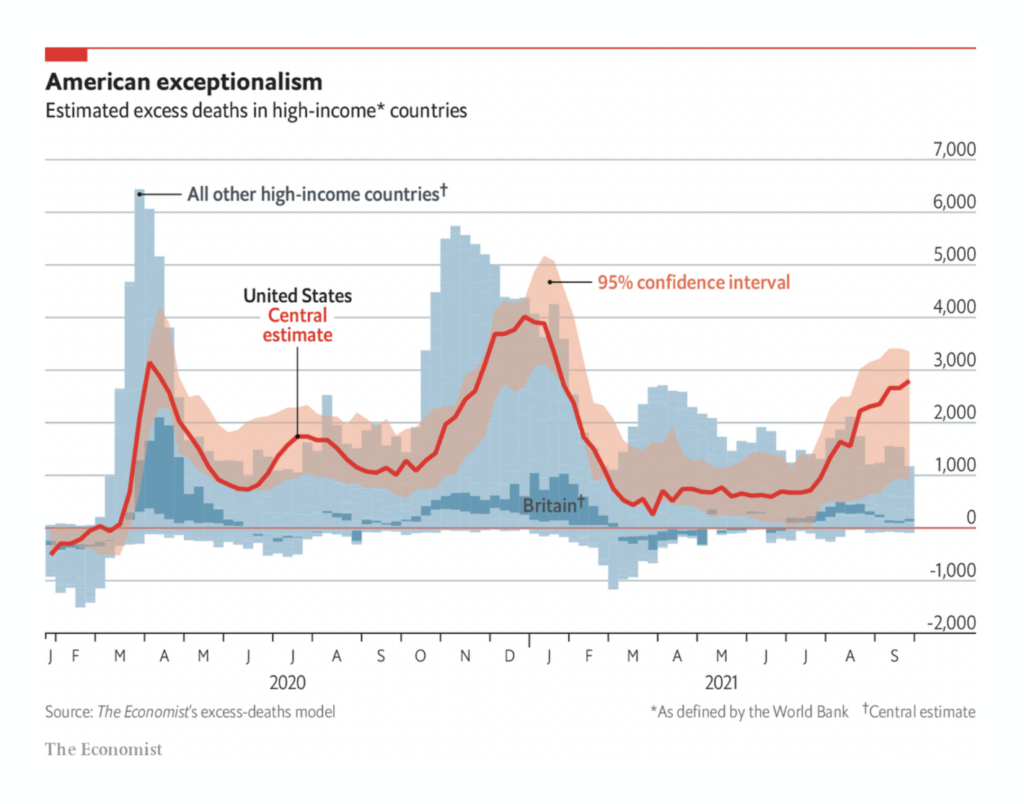
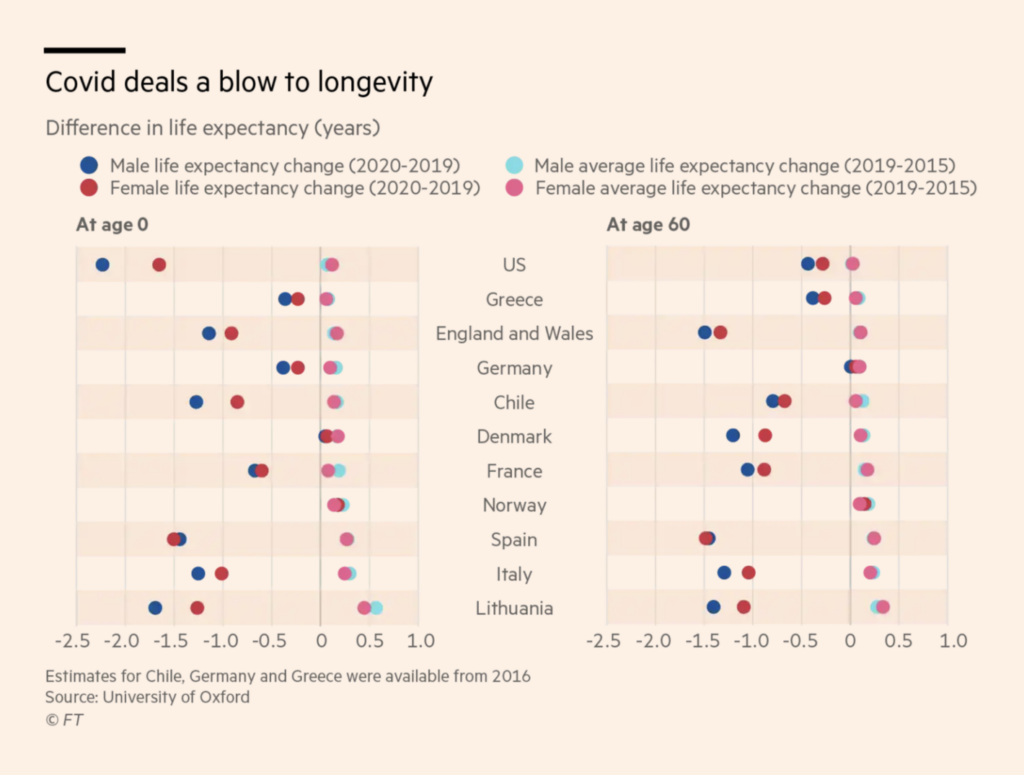
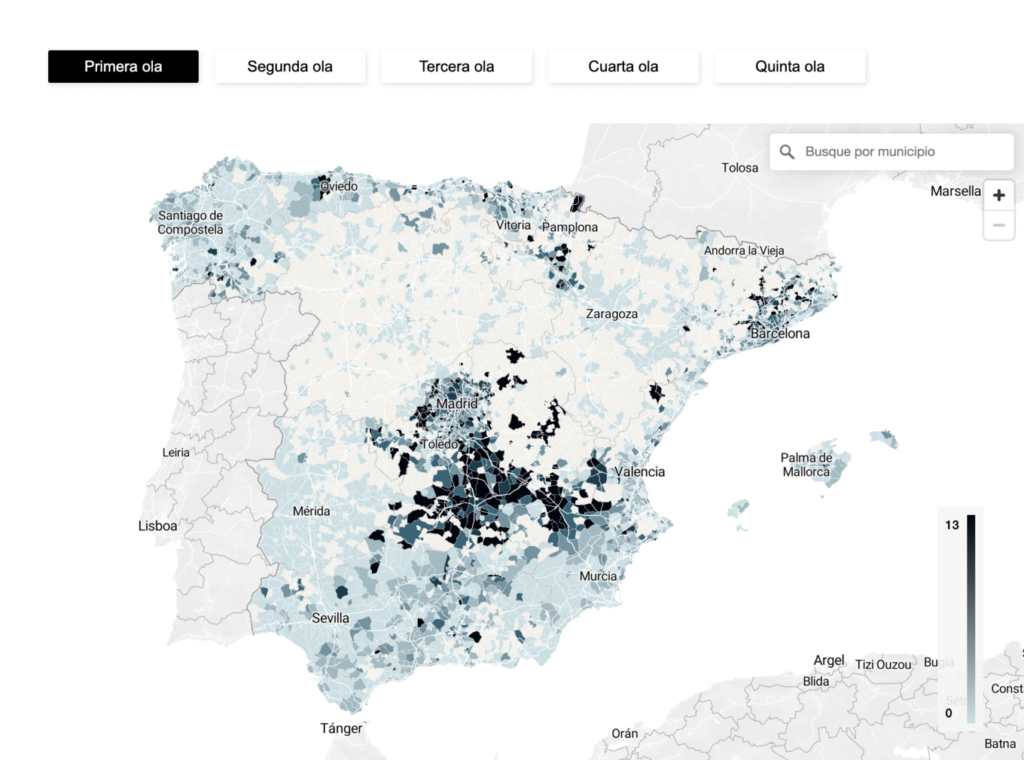
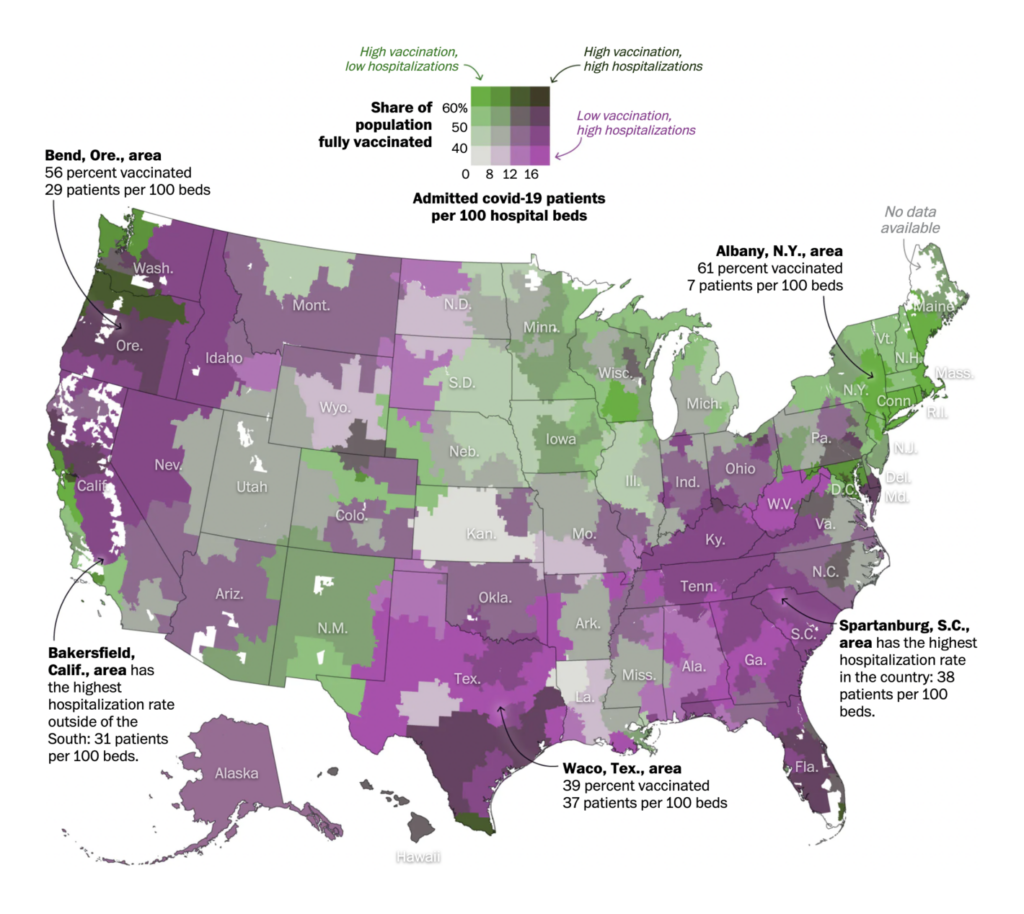
We’d love to tell you that covid-19 isn’t visualization-worthy anymore – but while cases are decreasing in many countries (again), the pandemic isn’t over yet:

The Economist: America’s pandemic is now an outlier in the rich world, September 27
Financial Times: Covid sparks biggest fall in life expectancy since second world war, September 27
El Confidential: El agujero negro de la mortalidad por covid, September 27
Financial Times: Covid cases among England’s schoolchildren hit record peak, September 22

The good news? Vaccinations still work:

The Washington Post: Mapping America’s hospitalization and vaccination divide, September 23
Neue Zürcher Zeitung: So gross ist der Zusammenhang zwischen Impfquote und Fallzahlen, September 23

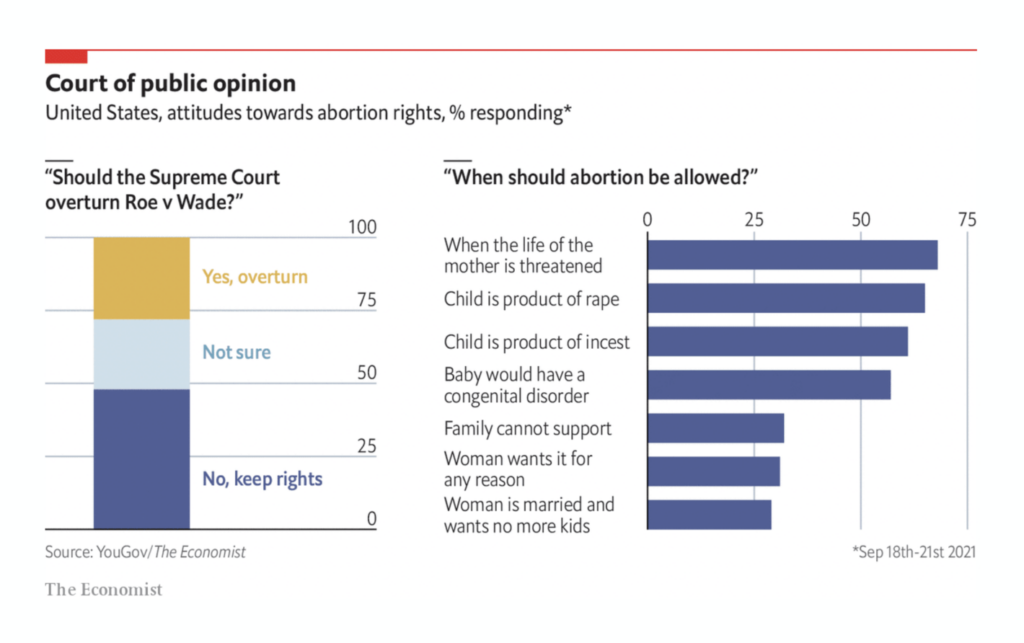
The ongoing debate about abortion laws in the U.S. continued to produce charts:

The Washington Post: How abortion laws in the U.S. compare to those in other countries, September 27
The Economist: A clear majority of Americans favour abortion rights, September 23

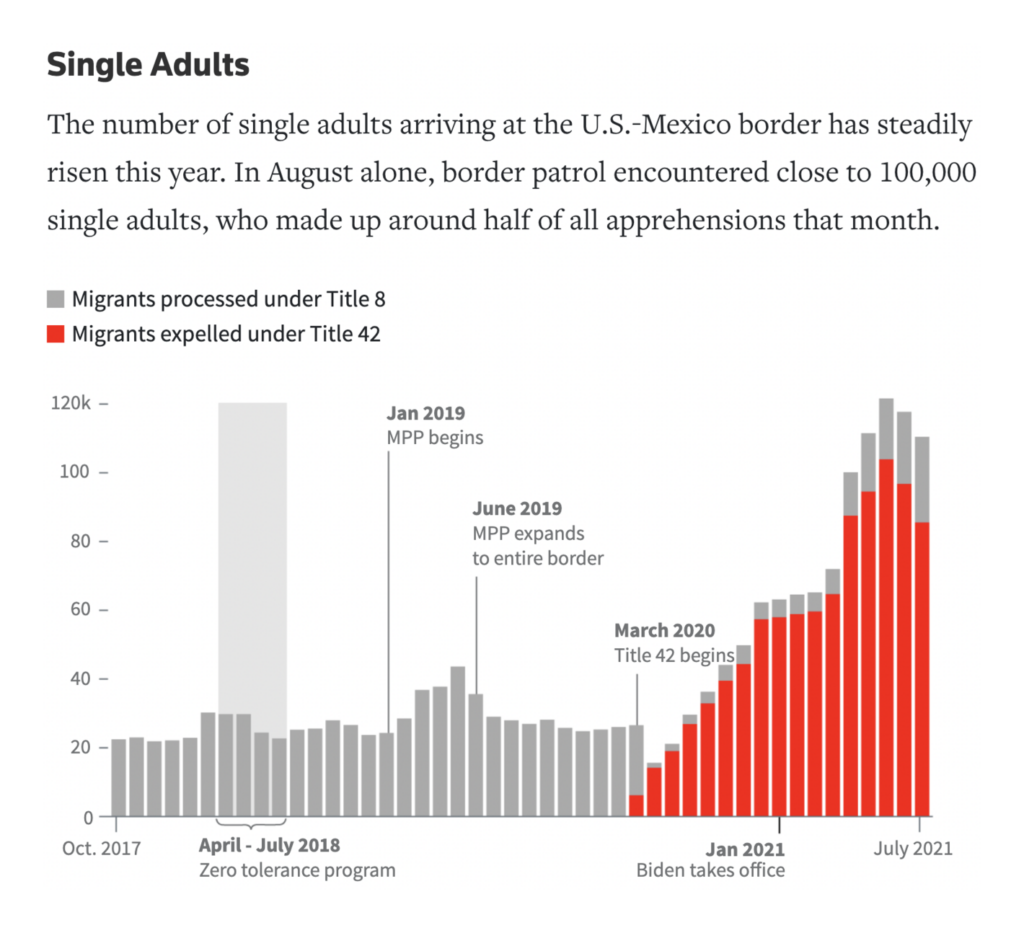
And we saw two good-looking visualizations about people moving this week – one by The Economist about migration that happened hundreds and thousands of years ago, and one by Reuters about migration in the past months:

The Economist: Genes reveal how and when humans reached remote corners of Pacific, September 25
Reuters: Border Refugees, September 23

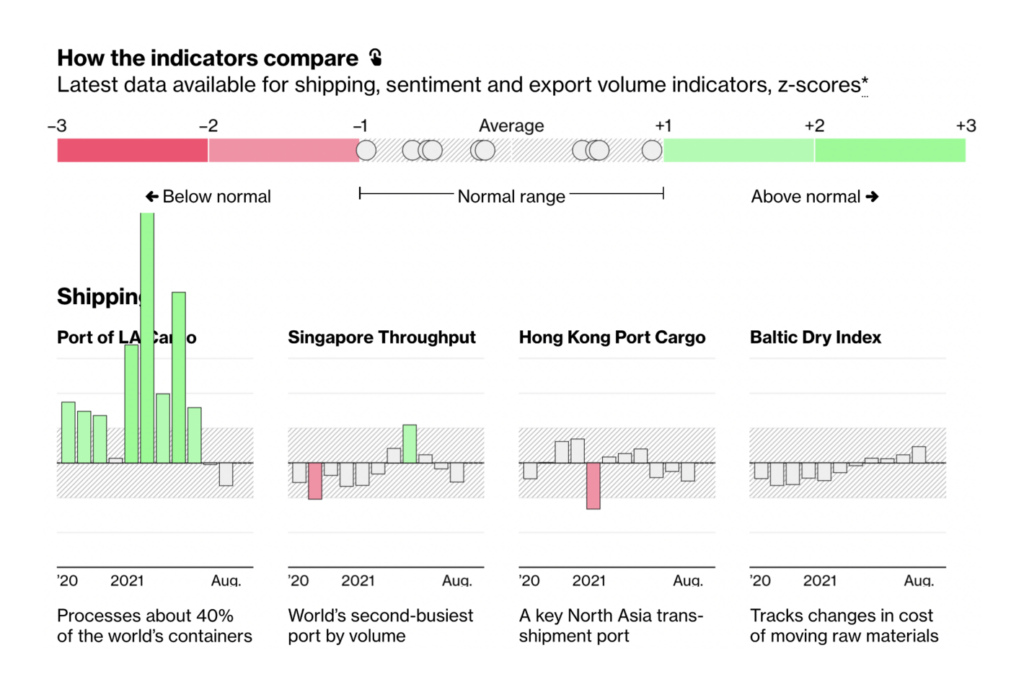
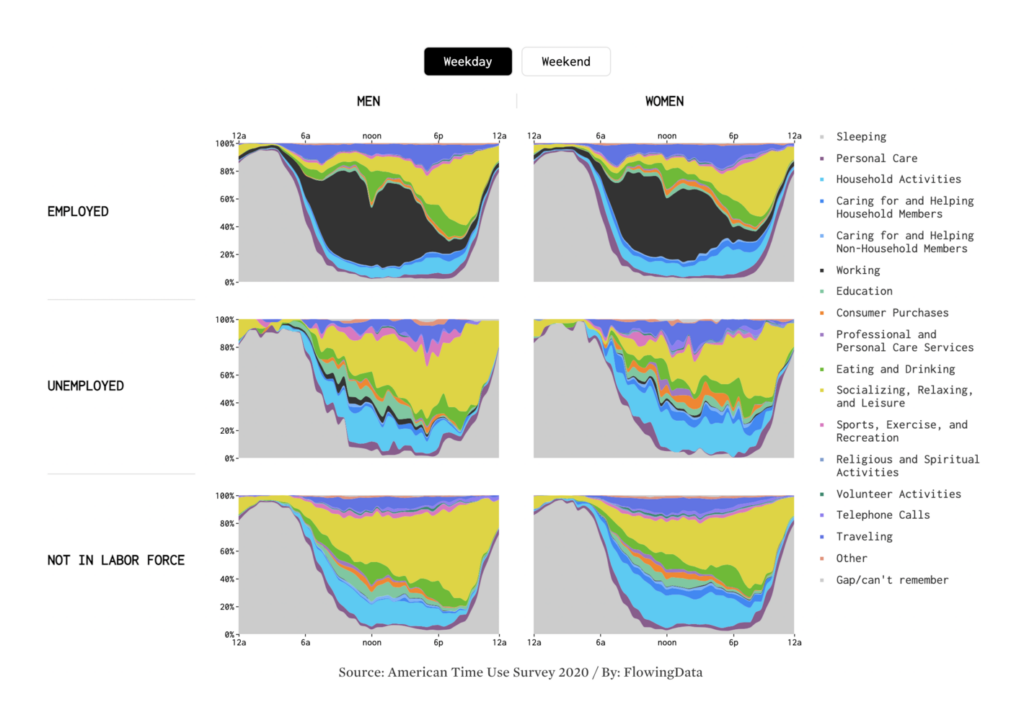
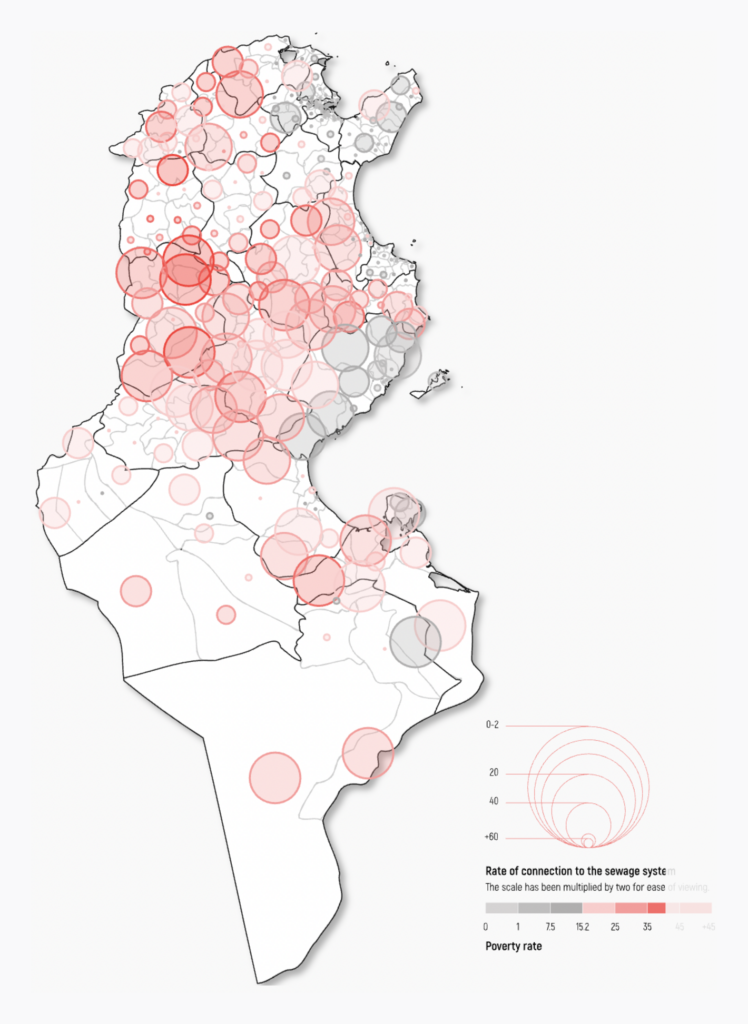
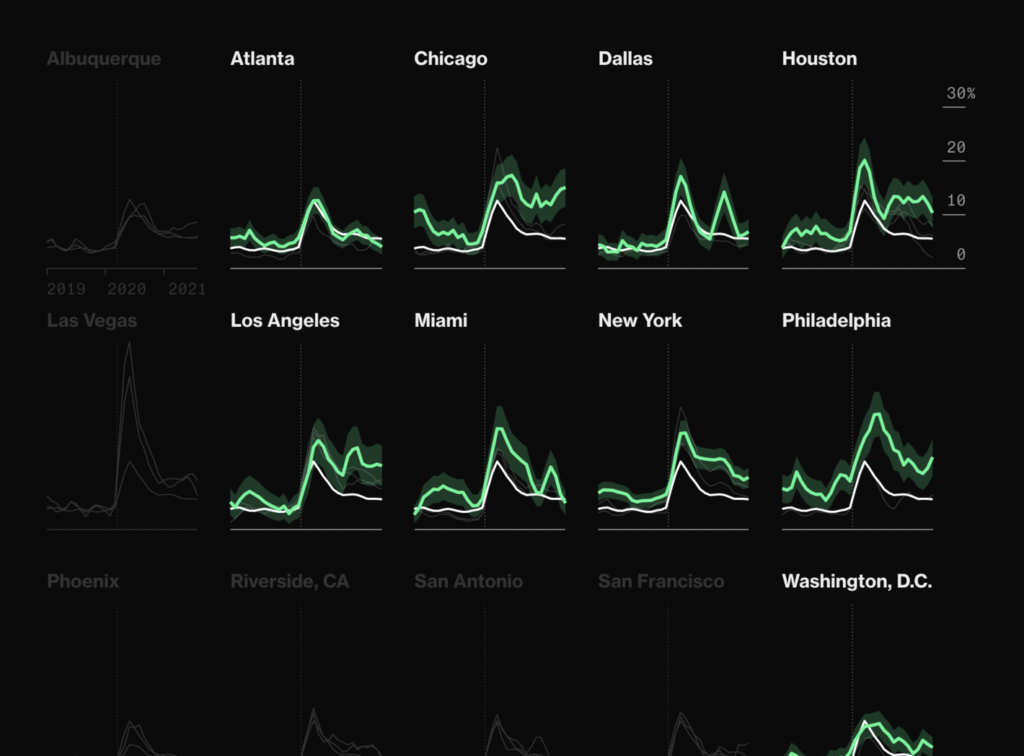
And in our “charts that don’t fit another category” category, we get jobless rates, shipping, spent time and poverty in Tunisia:

Bloomberg: Delta’s Supply-Chain Pain Lingers on Bloomberg Trade Tracker, September 27
Nathan Yau: How Men and Women Spend Their Days, September 21
Inkyfada: Living on less than 5 dinars a day, mapping the poverty rate in Tunisia, September 23
Bloomberg: Jobless Rates From 15 U.S. Cities Show Racial Gap Is Widening, September 22

What else we found interesting

Tyler Morgan-Wall: “New #dataviz! The Earth’s submarine fiber optic cable network, visualized in #RStats with #rayrender” (Tweet), September 22
South China Morning Post: Coming to the light. The Ghent Altarpiece restoration, September 21

Help us make this dispatch better! We’d love to hear which newsletters, blogs, or social media accounts we need to follow to learn about interesting projects, especially from less-covered parts of the world (Asia, South America, Africa). Write us at hello@datawrapper.de or leave a comment below.

Comments