

Read “Practical Charts” by Nick Desbarats with us!
October 14th, 2024
7 min
This article is brought to you by Datawrapper, a data visualization tool for creating charts, maps, and tables. Learn more.
″…what visualization is, why it is the way it is — and what it could be.”
Do you keep getting recommendations for data vis books, maybe even buy them, but don’t make it a priority to read them? Let’s read these books together – and let’s discuss them, to get more out of them. That’s what the Data Vis Book Club is about. Join us! Here’s what we’ll read next.
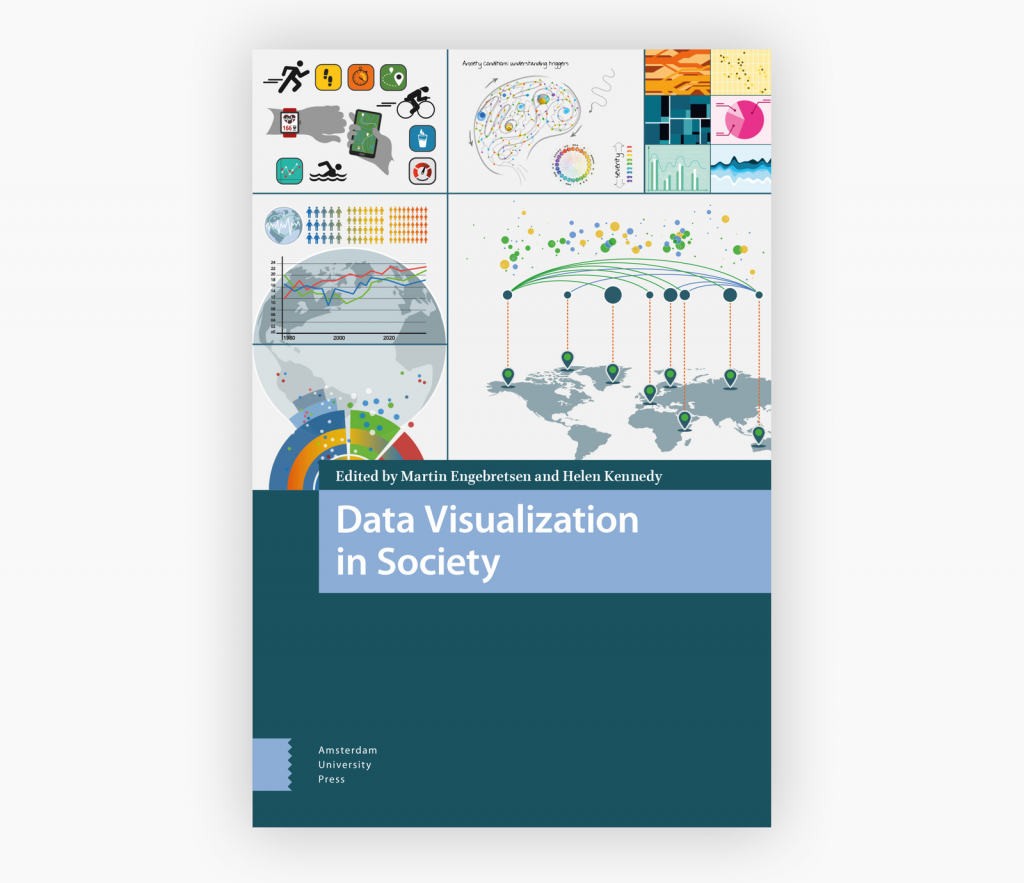
Hey everyone! Yes, we’re still alive and well. 2020 was a bit full of…all the feels, but we’re excited to read some great data vis books with you in 2021! Let’s start the year by reading four chapters from “Data Visualization in Society” (link), a collection of chapters written by different authors and edited by Helen Kennedy and Martin Engebretsen.
We will discuss Data Visualization in Society
on Tuesday, 2nd of March at 6pm UTC here:
notes.datawrapper.de/p/bookclub-datavis-in-society
That’s 10am on the US west coast, 1pm on the US east coast, Colombia & Peru, 3pm in Brazil and Argentina, 6pm for readers in the UK & Portugal, 7pm for most other Europeans and 11.30pm in India.
We’re reading the foreword and these four chapters:
– Foreword: The dawn of a philosophy of visualization by Alberto Cairo
– Chapter 2: Ways of knowing with data visualizations by Jill Walker Rettberg
– Chapter 11: Data visualization and transparency in the news by Helen Kennedy, Wibke Weber, and Martin Engebretsen
– Chapter 16: What we talk about when we talk about beautiful data visualizations by Sara Brinch
– Chapter 18: Exploring narrativity in data visualization in journalism by Wibke Weber
The book is free to read. Here’s the book on the publisher’s website. Download the individual chapters here or the whole book here.
A few of the chapter authors will take part in the conversation as well, joining around 45min into the discussion and answering all our questions.
Like always, everyone is welcomed to join! Just open the notepad at the correct date and time and start typing. Many participants will be new to the conversation – we’ll figure it out as we go.
“Data Visualization in Society” (not to be confused with the Data Visualization Society) might be a book you haven’t heard about until now, even if you’re active in the data vis scene. That’s because this book is home in the media studies corner. The texts we’ll read are by professors of Language and Communication, Media Linguistics, and Digital Culture. Meaning: This book is an excellent opportunity to hear some different voices and to look beyond our practical horizon.
See this book as a conference about data visualization that you stumbled in, and that is hosted by professors and practitioners you don’t follow on Twitter.
The book has almost 500 pages structured in five sections, which might be a bit too much to read for one discussion. So I chose four chapters.
“But Lisa, what’s special about these four chapters?” Honestly, not much. I chose texts that seemed enjoyable to read and discuss, and useful for people who focus a bit more on explanatory visualization than exploratory visualization.
But I might not have chosen the most interesting chapters for you. So take them as a starting point, then browse around in the book, see which other topics interest you, and read them, too. And let us know which chapters you liked on March 2nd! We all love a good recommendation.
First, Alberto Cairo makes a point for a philosophy of data visualization in his two-page foreword that I recommend reading as a nice intro. Here’s what the other chapters are about:
What’s the difference between looking at a bar chart and looking at a photography? Jill explores precisely that. “Data visualizations combine numeric data with visual representation, and these modes allow them to express certain kinds of knowledge more easily than others,” she writes – which kinds of knowledge these are, she explains in her chapter. Jill is a Professor of Digital Culture in Norway. Jill will attend the book club to answer your questions about her chapter.
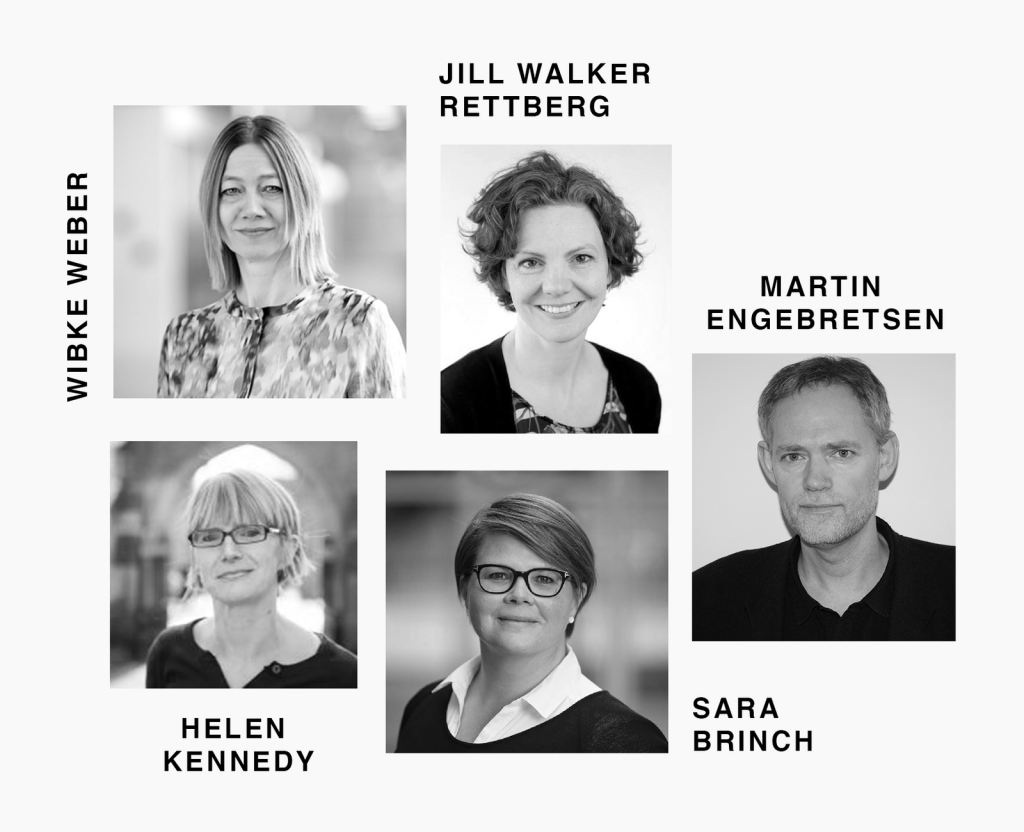
For this article, the authors asked 60 data journalists and visualization designers from major newsrooms: Are the data visualizations you create objective? How about transparent? Helen (Professor of Digital Society in Sheffield, UK) and Martin (Professor of Language and Communication in Norway) are the editors of the book, while we’ll meet Wibke again in chapter 18. Helen will attend the book club to answer your questions about her chapter (and the general book!).
What’s a beautiful data visualization? And why is beauty important in data visualization? Sarah answers that and explains different ways in which a graphic can be beautiful – by expressing fine craftsmanship, for example, or by letting complexity keep its complex character. She’s an Associate Professor in visual communication in Norway.
“What exactly does storytelling with data mean? When does a data visualization tell a story? And what are narrative constituents in data visualization?” Based on 73 data visualization examples, Wibke explains the building blocks of visual storytelling. She’s a Professor of Media Linguistics in Zurich. Wibke will attend the book club to answer your questions about her chapters.
1. You get “Data Visualization in Society”. You can buy it for 60 bucks, but it’s open access, so you can also download it – either the individual chapters we’ll discuss here or the whole book here.
2. We all read the chapters. That’s where the fun begins! Please mention @datavisclub or use the hashtag #datavisclub if you want to share your process, insights, and surprises – I’ll make sure to tweet them out as @datavisclub, as motivation for us all.
3. We get together to talk about the book. This will happen digitally on March 2nd, 2020 at 6pm UTC over at notes.datawrapper.de/p/bookclub-datavis-in-society.
It won’t be a call or a video chat; we’ll just write down our thoughts. The discussion will be structured around the chapters. We’ll just do an open discussion this time, around questions like: Did you like the chapter? Why, why not? Which thought impressed you the most? Which ideas did you get while reading it?
After going through the four chapters within approx. 45min, a few of the chapter authors will join us to answer questions we might have about their book.
Here’s a short FAQ for you, in case you have more questions:
A digital book club is a new experience for many of us. See how our book club discussions have looked like in the past:

You can also read the review of the first book club, to learn how people found the experience.
This is what others have said about some of the last book club discussions:
Because it works well for introverts and for people who prefer to stay anonymous in the discussion. Plus, native English speakers have less of an advantage than they have in calls. Plus, the documentation of our meeting writes itself.
Do you have a lunch date? Vacation? Need to bring the kids to bed? Need to sleep yourself? No problem! The conversation will be archived in the notes and can still be extended over the next day(s).
You can either subscribe to our Datawrapper Blog Update newsletter, turn on notifications for our Twitter account or leave your Twitter handle in a list. I explain all three options in more detail here.
I’m very, very much looking forward to working through the chapters of “Data Visualization in Society” with all of you. If you have any more questions, write in the comments, at lisa@datawrapper.de or to Lisa / Datawrapper on Twitter. Also, make sure to follow @datavisclub, to stay up-to-date and get a dose of motivation from time to time.


Comments