Read “How to lie with maps” by Mark Monmonier with us!
January 29th, 2025
6 min
This article is brought to you by Datawrapper, a data visualization tool for creating charts, maps, and tables. Learn more.
“A Handbook for Data Driven Design”

Do you keep getting recommendations for data vis books, maybe even buy them, but don’t make it a priority to read them? Let’s read these books together – and let’s discuss them, to get more out of them. That’s what the Data Vis Book Club is about. Please join us! Here’s what we’ll read next.
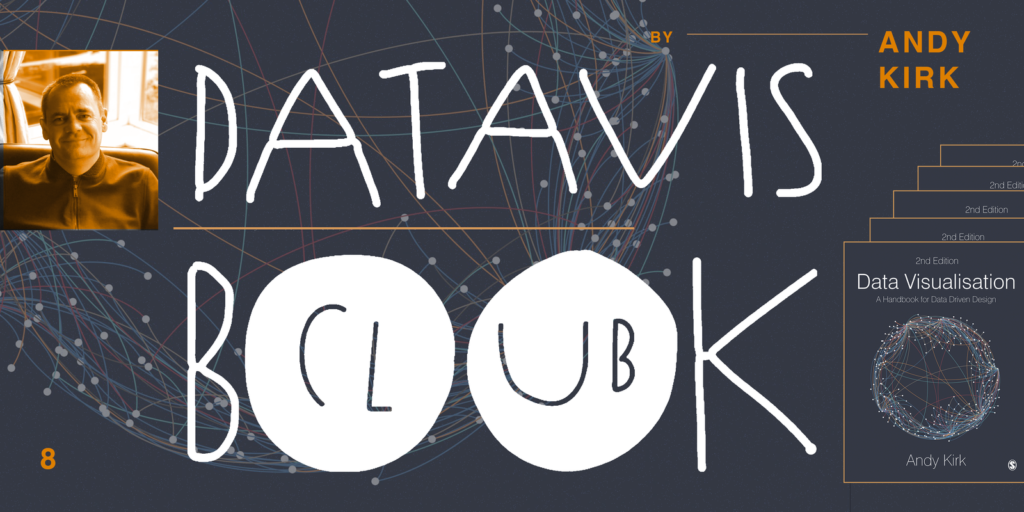
After a super well-received Data Vis Book Club in which we discussed six (yes, that was too many) data vis papers, we’ll get back to reading a book. I’m happy to announce that our next one will be the new “Data Visualisation – A Handbook for Data Driven Design; second edition” by Andy Kirk. It’s a dense book, so we’ll focus on reading chapters 1, 2, 3, 5 and 8.
We will discuss the Data Visualization Handbook
on Tuesday, 12th of May at 5pm UTC here: notes.datawrapper.de/p/bookclub-andykirk
That’s 10am on the US west coast, 1pm on the US east coast, 6pm for readers in the UK & Portugal, 7pm for most other Europeans and 10.30pm in India.
Andy himself will take part in the conversation as well, joining around 45min into the discussion and answering all our questions.
Like always, everyone is welcomed to join! Just open the notepad at the correct date and time and start typing. Many participants will be new to the conversation – we’ll figure it out as we go.
Andy Kirk is the founder of the data visualization platform “Visualising Data”, which is crazy 10 years old. If he doesn’t post on his website, Andy travels around, consults and trains people in data visualization. Now that the coronavirus keeps him from traveling, he’s offering online courses. The Data Visualisation Handbook’s second edition we’ll read was published last fall; the first edition is available since 2016.
NEW POST: My new book is published! https://t.co/nmrsDCD3Nb cc @SAGE_Methods pic.twitter.com/laP81JHKmG
— Andy Kirk | Visualising Data (@visualisingdata) August 16, 2019
So should you read this book? I asked Andy. What’s the one thing he hopes people take away from his book? That’s what he replied:
My one thing would be to elevate the importance of the little details that comprise the anatomy of any visualisation work. As creators we are responsible for every single thing that ends up on our screen or page, so it all boils down to positioning visualisation as a game of decisions.
Andy Kirk
To make the best decisions, you need to be familiar with your options and aware of the things that will influence your choices. In this book I’m attempting to assist beginners and intermediate visualisers navigating through that decision-making process. I want to help them recognise the many different decisions they are going to need to make, and when. I’m then providing them with an awareness of the many available options (eg. here’s a menu of charts) but then equipping them with the critical thinking skills to reason what should be their ultimate choice.
Sounds good to you? Then read the book with us!
This time, we’ll do something new: Instead of telling y’all to read the whole book, we’ll focus on discussing chapters 1, 2, 3, 5 and 8. That’s because Andy’s book – as you will notice once you hold it in your hands – is a fairly big one, densely filled with information.
In this way, it’s similar to Tamara Munzner’s “Visualization Analysis & Design” that we read in 2018. Back then, we tried to split the discussion up into two sessions – and nobody showed up for the second one.
So we’re trying a different approach this time: I asked Andy to name the “must-read” chapters; the chapters that come with the most interesting information even for advanced data visualization designers. Of course, every chapter in his book is worth reading, so it was a hard decision for him – but we decided on five chapters that will give you a good idea of what this book is about.

Consider reading the rest of the book, too, if you feel like the five chapters were a great use of your time!
1. You get the Data Visualisation handbook. Ask your local library to order it for you (if it’s still open), buy it, borrow it from a friend, ask around on your preferred social network.
2. We all read the book. That’s where the fun begins! Please mention @datavisclub or use the hashtag #datavisclub if you want to share your process, insights, and surprises – I’ll make sure to tweet them out as @datavisclub, as motivation for us all.
3. We get together to talk about the book. This will happen digitally on Tuesday, 12th of May 2020 at 5pm UTC over at notes.datawrapper.de/p/bookclub-andykirk.
It won’t be a call or a video chat; we’ll just write down our thoughts. The discussion will be structured into three questions:
During the conversation, I’ll ask these three questions in the following order:
1 What was your general impression of the book? Would you recommend working through it, and if so, to whom?
2 What was most inspiring, insightful or surprising while you worked through the book? What did you learn that you didn’t expect to?
3 Having read the book, what will you do differently the next time you visualize data?
For each question, you can prepare an answer in 1-2 sentences and paste it into the notes once I ask the question during the conversation. If you can’t find the time to prepare anything at all just come by and chat – we’ll quickly get into discussion mode.
After going through the three questions within ca 45min, Andy will join us to answer questions we might have about the book.
Here’s a short FAQ for you, in case you have more questions:
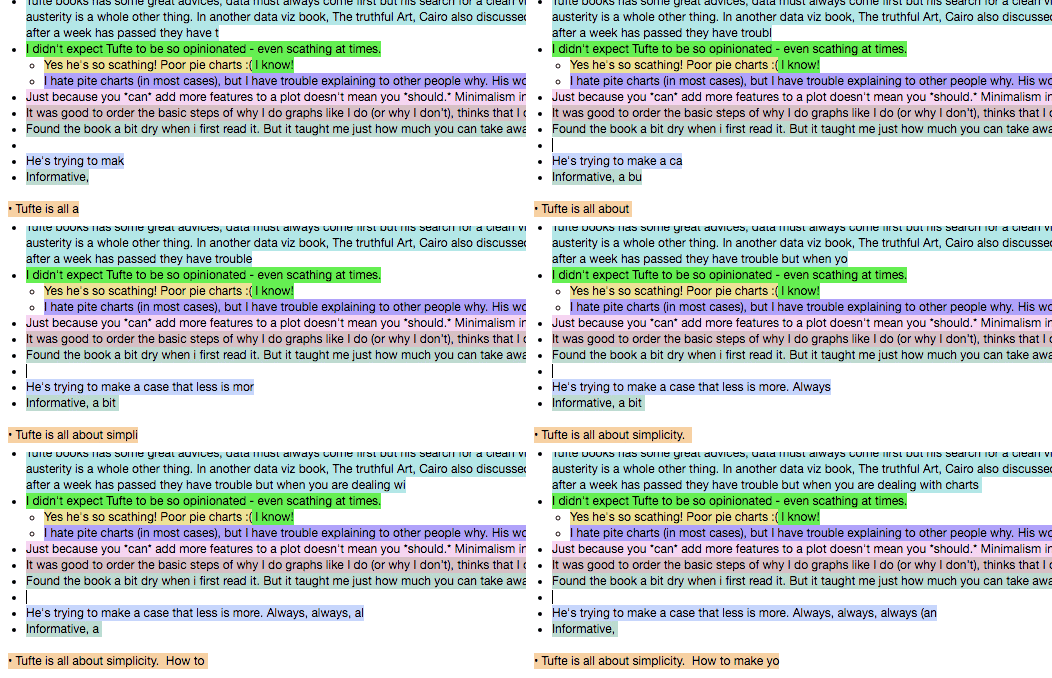
A digital book club is a new experience for many of us. See how our book club discussions have looked like in the past:

You can also read the review of the first book club, to learn how people found the experience.
This is what others have said about some of the last book club discussions:
Because it works well for introverts & people who prefer to stay anonymous in the discussion. Plus, the documentation of our meeting writes itself.
Do you have a lunch date? Vacation? Need to bring the kids to bed? No problem! The conversation will be archived in the notes and can still be extended over the next day(s).
I’m very, very much looking forward to working through Andy’s new book with all of you. If you have any more questions, write in the comments, at lisa@datawrapper.de or to Lisa / Datawrapper on Twitter. Also, make sure to follow @datavisclub (we have more than 4000 followers 🎉 , so it’s likely you already follow us), to stay up-to-date and get a dose of motivation from time to time.
Comments