

New: Keep your account secure with two-factor-authentication
March 27th, 2024
3 min
This article is brought to you by Datawrapper, a data visualization tool for creating charts, maps, and tables. Learn more.
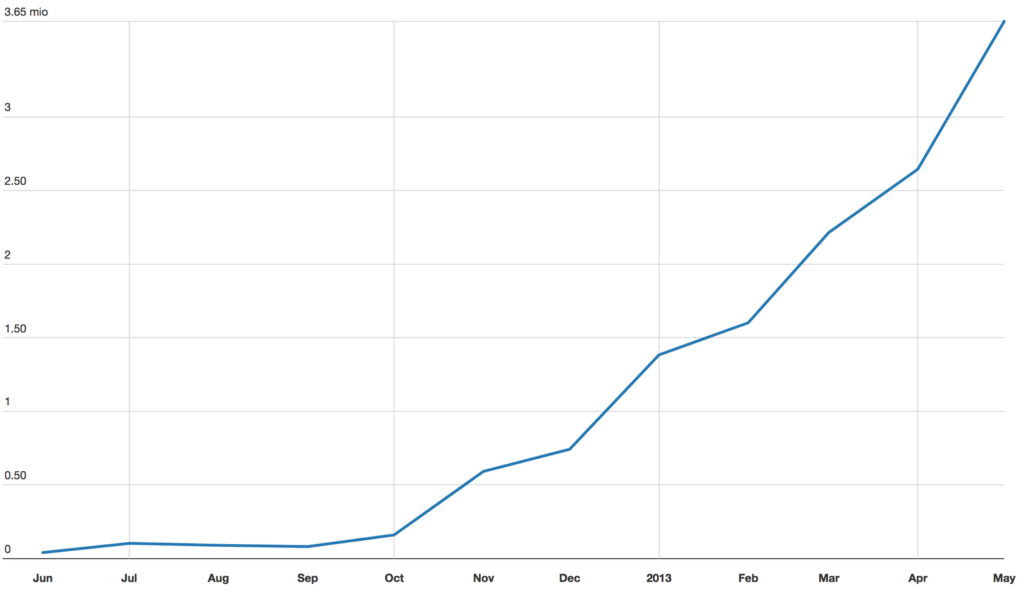
Since the upgrade to version 1.0 in November 2012 traffic generated by charts created with Datawrapper is increasing on a month by month basis. So, a few days ago we crossed an important threshold: 10 Million visits to Datawrapper charts, just in 2013.
With almost 3.7 million chart visits in May we crossed the mark of 10 Million in 2013.
Having started from a blank sheet of paper roughly two years ago this is very exciting. The usage motivates us to make Datawrapper more mature and versatile in future releases. From what we see the drivers for the growth in usage are currently two-fold: For one we are increasingly working very closely with more and more top media brands. Secondly more and more charts are created by single users, who embed the results on their blogs or elsewhere. Both forms of use are what we wanted to achieve, so the ten million visits mark means a lot to us.
So, here is a big “Thank you!” to everyone out there using Datawrapper.
Word cloud of +500 media websites using Datawrapper in 2013, sized by chart views.
Right now we are very busy, working through a long, long list of new and extended modules, little fixes, a better user interface and more chart types. Datawrapper will provide many more options in terms of input of data, when creating charts and will have advanced output options by the end of the year. In short: We want to make use even easier while providing many more options. Gregor Aisch has developed a huge 2013 roadmap — with some features that would be so cool to have right now. But, we are progressing and given the tiny team that is working on this project, it is a small miracle that we got so far.
One thing that is very important to us is this: The early adopters using Datawrapper value the open source approach. Specifically the journalists get the difference and tell us that this is one big reason to work with Datawrapper. Investigating data is a long-term approach. So when a growing archive of charts and data is created, we think this should be under control of the newsroom, not by the service.
As they (jokingly) say when a big data project is finished at the New York Times: Journalism saved!
Again, thanks everyone. This is fun. Let‘s keep it rolling…
The Datawrapper Team


Comments