


We’re hiring a UI / UX designer with experience in data visualization
June 28th, 2024
6 min
This article is brought to you by Datawrapper, a data visualization tool for creating charts, maps, and tables. Learn more.
Datawrapper’s mission is to help the world create better visualizations. We provide an easy-to-use, free online tool to create charts, maps, and tables. It’s used by thousands of people every day, among them brands like The New York Times, Quartz, or FiveThirtyEight.
To help us fulfill our mission, we are hiring a Backend Developer (4-5 days per week).
You can join remotely (in the time zones around Berlin, so GMT, CET, or EET) or get a desk in our Berlin office, as soon as the team is back there.

We are looking for a motivated, self-directed developer to join our small team to help us provide the best data visualization tool possible. You might be a good fit if you…
You do not need to have experience with all the particular parts of our stack. We are looking for somebody who can comfortably orient themselves in a new codebase with an existing architecture.
In your day-to-day work, you will…
Our technology stack is based on…
In addition to that, we have some legacy components written in PHP, which are being ported to NodeJS at the moment. For collaboration, we use Notion for project management, GitHub to manage our repositories and code reviews, and Slack for direct communication.
Datawrapper wants to help the world create better charts and maps. Initially born out of frustration over how long it takes to create a simple bar chart in a fast-paced newsroom environment, Datawrapper has since grown in functionality to cover dozens of chart types, maps, and tables.
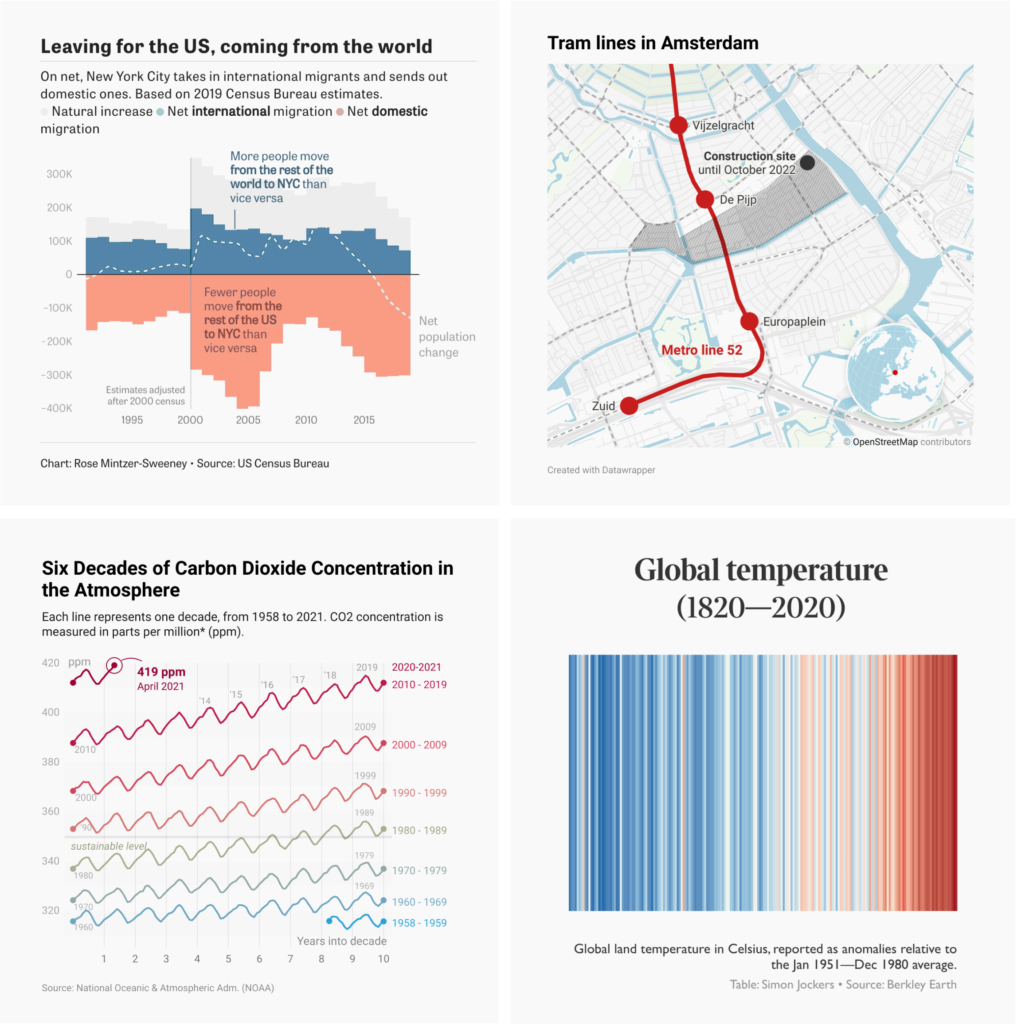
We aim to empower users to create both more and better charts and maps. Be it a journalist at a newspaper, an analyst at a bank, or a public servant in a government department, we want to enable everyone to create beautiful and correct graphics — regardless of their skill level.
We’re a small team of 17, with a shared passion for design and data visualization. We value a quiet, focused work environment, and have a healthy disregard for distractions, unnecessary meetings, and open-office floor plans. Every employee gets 30 days of vacation per year and an education budget to (for example) go to conferences or buy books.
You choose your tools. Whether you prefer Linux or Macs, like Lenovos or Dells, big screens or portable laptops (or both!) — you shall have it.
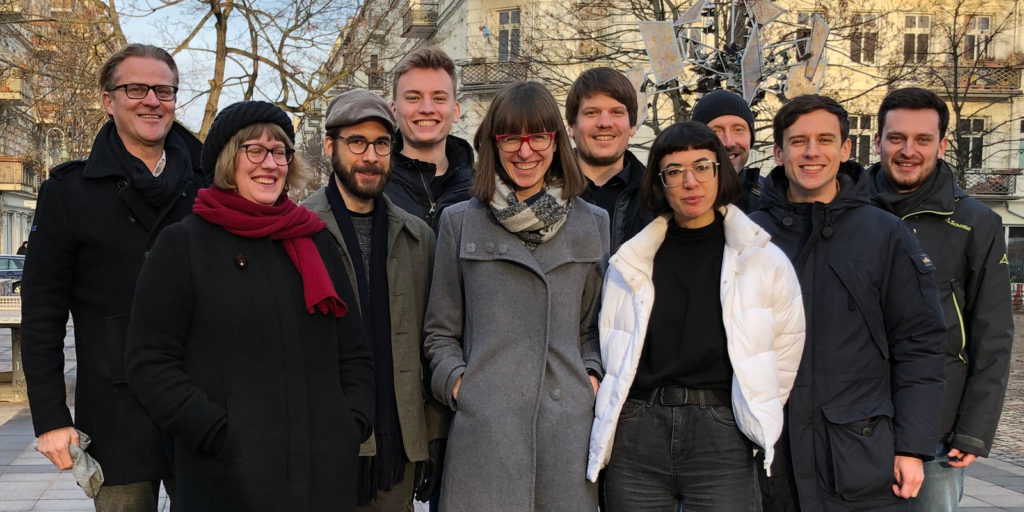
We’re a small team making a big impact. Through a focus on quality, design, and support, we’ve been able to win leading brands worldwide with a team of just 17 people — 18 with you! No investors needed. Learn more about the team here.
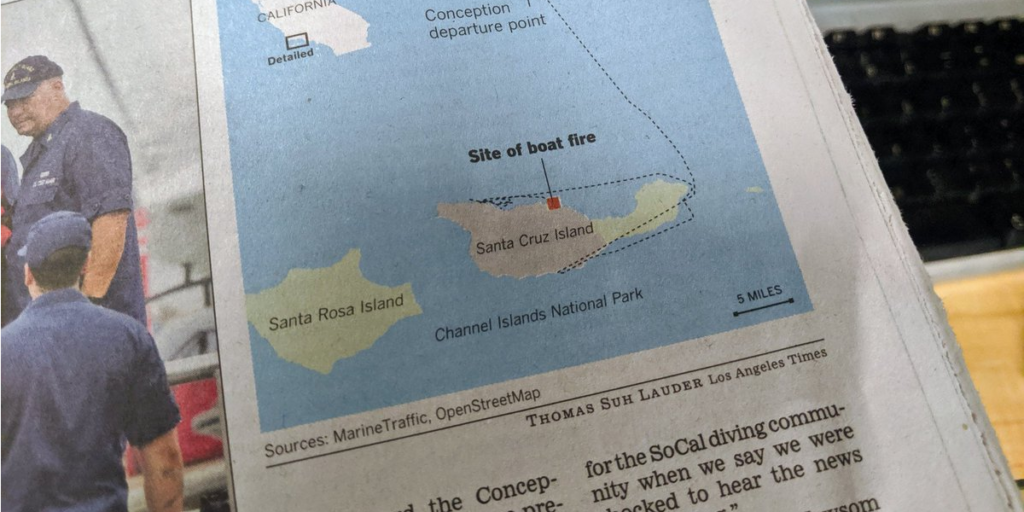
We are proud to serve customers all around the world. Here’s a Datawrapper map in the print edition of the Los Angeles Times.

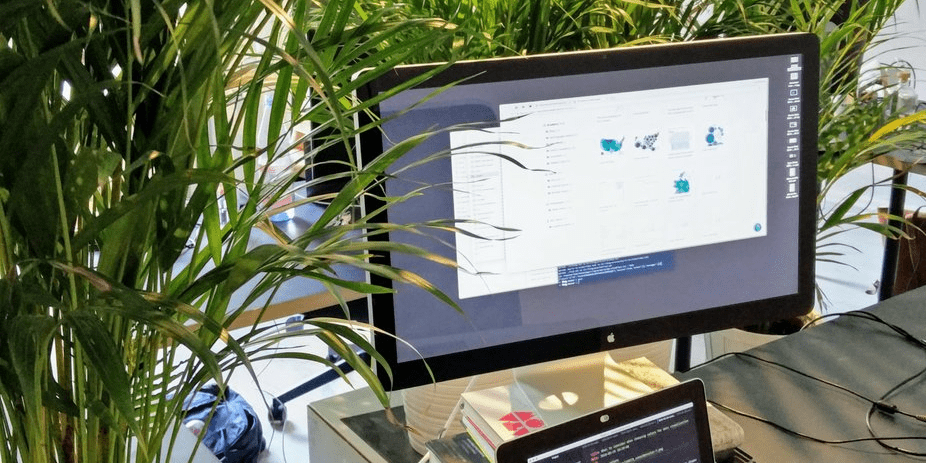
If you’re into data visualization, you’ll love our office: Between a large library of data vis classics, some great map and chart artwork on the walls, and data-vis-centric lunch conversations, there’s enough to keep your mind occupied for days.
To apply, send us an email at jobs@datawrapper.de. We don’t particularly care about CVs, just skills and attitude. Here’s what we’d like you to include in your email:
→ Send it all to jobs@datawrapper.de
As part of the application process, we will provide a take-home software development exercise for applicants who are selected to interview. It should take less than a few hours to complete, and the results will be discussed in a follow-up call with us. Its purpose is to help us understand your thinking, and to help you understand our values and priorities and determine if it’s a good fit.
We hope you apply, especially if you’re from a group that’s underrepresented in our office. If you have any questions, please let us know — we’re looking forward to hearing from you!
David, Gregor, and the Datawrapper team


Comments