

We’re hiring a Werkstudent*in Social Media & Communications
October 15th, 2024
4 min
This article is brought to you by Datawrapper, a data visualization tool for creating charts, maps, and tables. Learn more.

Edit: Thanks for your interest! We filled this position a while ago and won’t accept applications for this job anymore.
Datawrapper is a web-based tool to create charts, maps and tables. It’s used by thousands of people every day, among them brands like The Times, Süddeutsche Zeitung or SPIEGEL ONLINE. Charts and maps created with Datawrapper get viewed millions of times every day.
This is only possible because Datawrapper supports a large variety of platforms. Whilst initially built as a solution for creating embeddable web graphics, we have since extended it with functionality for exporting graphics as SVG and PDF files.
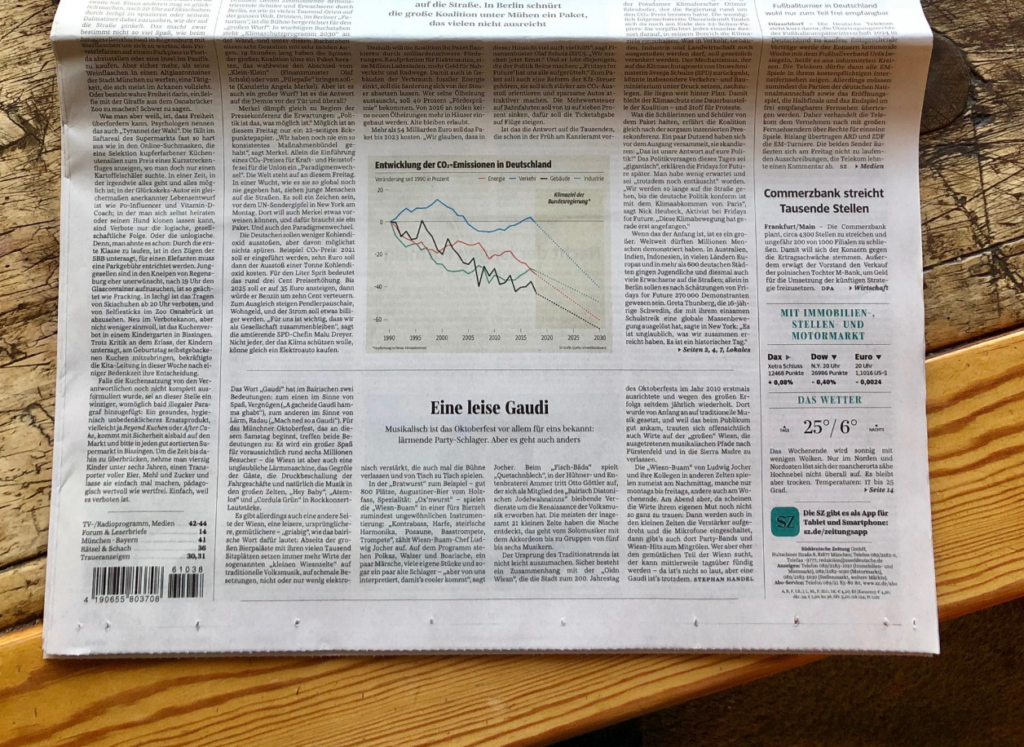
Süddeutsche Zeitung front page with a Datawrapper chart in September 2019.
This allows customers to parallelize their chart creation processes for both web and print contexts. Our HTML charts can be responsively embedded directly in their websites or apps, as well as exported and further fine-tuned in tools like Adobe Illustrator for re-use in printed publications.
We are looking for a software developer to join our team in Berlin (Prenzlauer Berg)
to help us maintain, improve and extend this exporting functionality.

Exporting PDFs and SVGs is as simple as clicking a button in Datawrapper. You’ll make sure that our maps, charts, and tables look the same on the web as they do after clicking that button.
Datawrapper wants to help the world create better charts and maps. Initially born out of frustration over how long it takes to create a simple bar chart in a fast-paced newsroom environment, Datawrapper has since grown in functionality to cover dozens of chart types, maps, and tables.
We aim to empower users to create both more and better charts and maps. Be it a journalist at a newspaper, an analyst at a bank or a public servant in a government department: we want to enable everyone to create beautiful and correct graphics – regardless of their skill level.
We’re a small team of 12 based in Berlin, with a shared passion for design and data visualization. We value a quiet, focused work environment and have a healthy disregard for distractions, unnecessary meetings, and open-office floor plans. Every employee gets 6 weeks of vacation per year and an education budget, e.g. to go to conferences or buy books.
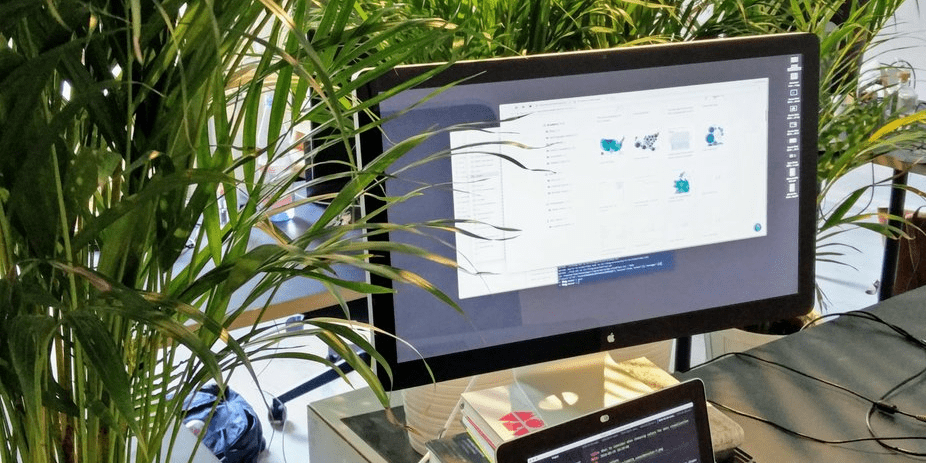
You choose your tools: Whether you prefer Mac or Linux; like MacBooks or Dells, big screens or portable laptops (or both!): you shall have it. (And we’re trying to keep our plants alive.)
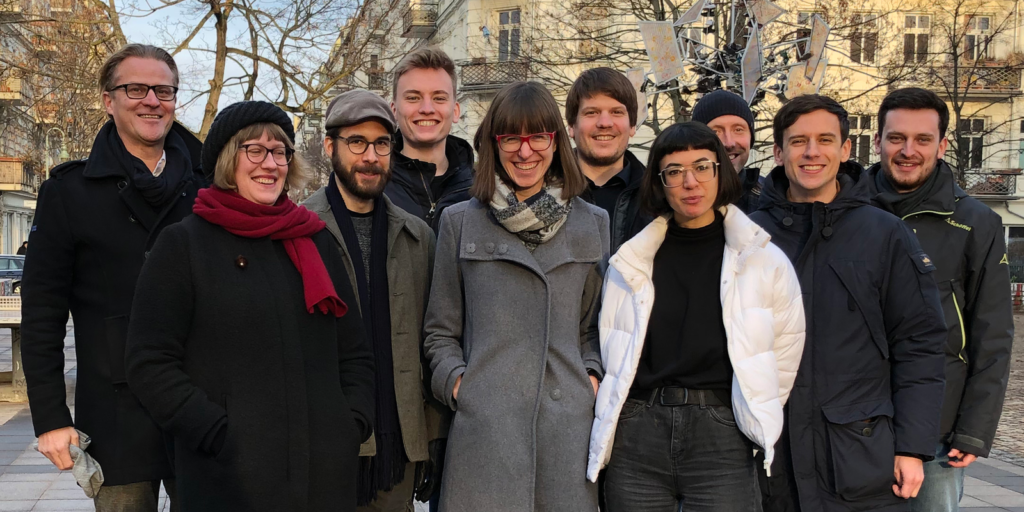
We’re a small team making a big impact. Through a focus on quality, design, and support we’ve been able to win leading brands worldwide with a team of just 12 people – 13 with you! No investors needed. Learn more about the team here.

We are proud to serve customers all around the world. Here’s a Datawrapper map in the print edition of the Los Angeles Times.

If you’re into data visualization, you will love our office: Between a large library of data viz classics, some great map and chart artwork on the walls and data-vis-centric lunch conversations, there’s enough to keep your mind occupied for days.
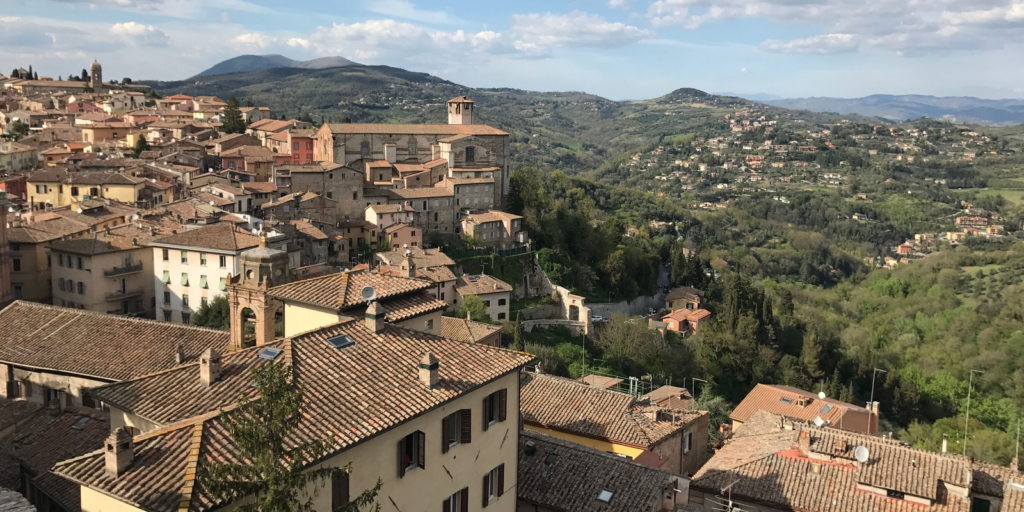
Once a year, you’ll find us on our annual company retreat in Perugia at the International Journalism Festival. It’s a great way for us to decompress as a team while having the chance to meet a lot of users and customers.
Is this role only full-time?
For this role we are looking for someone who wants to work between 3 and 5 days per week. We don’t hold a preference there, whatever works best for you.
Can I work remotely?
We are considering remote applications for this role. Since our team is in Berlin and some amount of coordination will be required, please only apply if you’re within a 1-hour timezone difference at max to Berlin. Also, we do value face-to-face time at least occasionally. Visiting once or twice every three months shouldn’t be a deal-breaker for you.
Does this job sound like a fit for you? Please e-mail jobs@datawrapper.de. Talk a bit about yourself and how your skills & experience could be a good fit for this job, and ask us all the questions you might have. We want you to apply especially if you’re from a group that’s underrepresented in our office. (That includes women, still, but we’re working on it!) Also: We care more about skills & attitude than about CVs. If you don’t find yourself 100% in the description, write us an email anyway.
If you we like your application, we’ll invite you to a video call or to our office. We’re located close to Helmholtzplatz in Prenzlauer Berg, Berlin:
We’re looking forward to hearing from you!
The Datawrapper team


Comments