

We’re hiring a Werkstudent*in Social Media & Communications
October 15th, 2024
4 min
This article is brought to you by Datawrapper, a data visualization tool for creating charts, maps, and tables. Learn more.
In the past few weeks, we were busy hiring lots of great new people for our team – and we’re looking forward to introducing them all to you. Let’s start with Elliot Bentley, our new Data Visualization Developer. Filling this role, he’s working full-time on new visualization features and types for our Datawrapper app alongside our CTO Gregor Aisch.
We asked a few questions to get to know Elliot better:
Hi, I’m a British developer/designer/journalist (I’ve never been 100% sure what to label myself as). I’ve just moved back to the UK after six years in New York, bringing a cat, girlfriend, and transatlantic accent along with me.
I’ve been a long-time admirer of Datawrapper’s elegant software (and great blog posts!), so when I saw they were hiring a developer specializing in data visualization, I jumped at the chance. Having been a solo coder on the majority of my past projects, I’m excited to be part of a software development company for the first time and get to learn from the experienced devs here.
I’ll be working on the visualization part of the Datawrapper app, i.e. the code that renders the actual charts, maps, and tables. And I’ll add some new visualization types along the way.
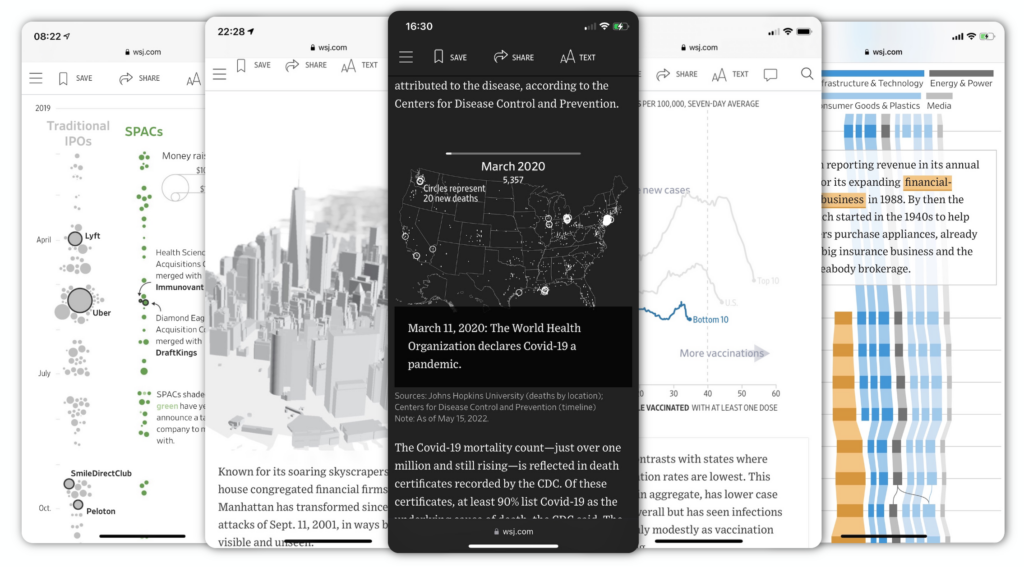
I’ve just finished eight years on the graphics team at The Wall Street Journal, working on interactive data visualisations, internal tools, and charts for print. It was a terrifically varied role where I got to switch hats regularly and report on a huge range of topics, from terrorism to finance to politics — and occasionally subjects a little less grim.
Before that, I worked as a reporter while teaching myself to code in my free time — and ended up creating oTranscribe, an open-source web app for manual transcription of interviews. It’s become quite popular in the years since and is now run by the nonprofit MuckRock Foundation.

I studied Biology at university, which involved a lot of data collection and visualization, while spending most of my free time working on the student newspaper and doing some web design on the side. It wasn’t until a few years after I graduated that I realized I could combine them all with this strange new discipline called “data journalism”.
My pandemic hobby — we all needed something to do while stuck at home, right? — was developing my own video games:
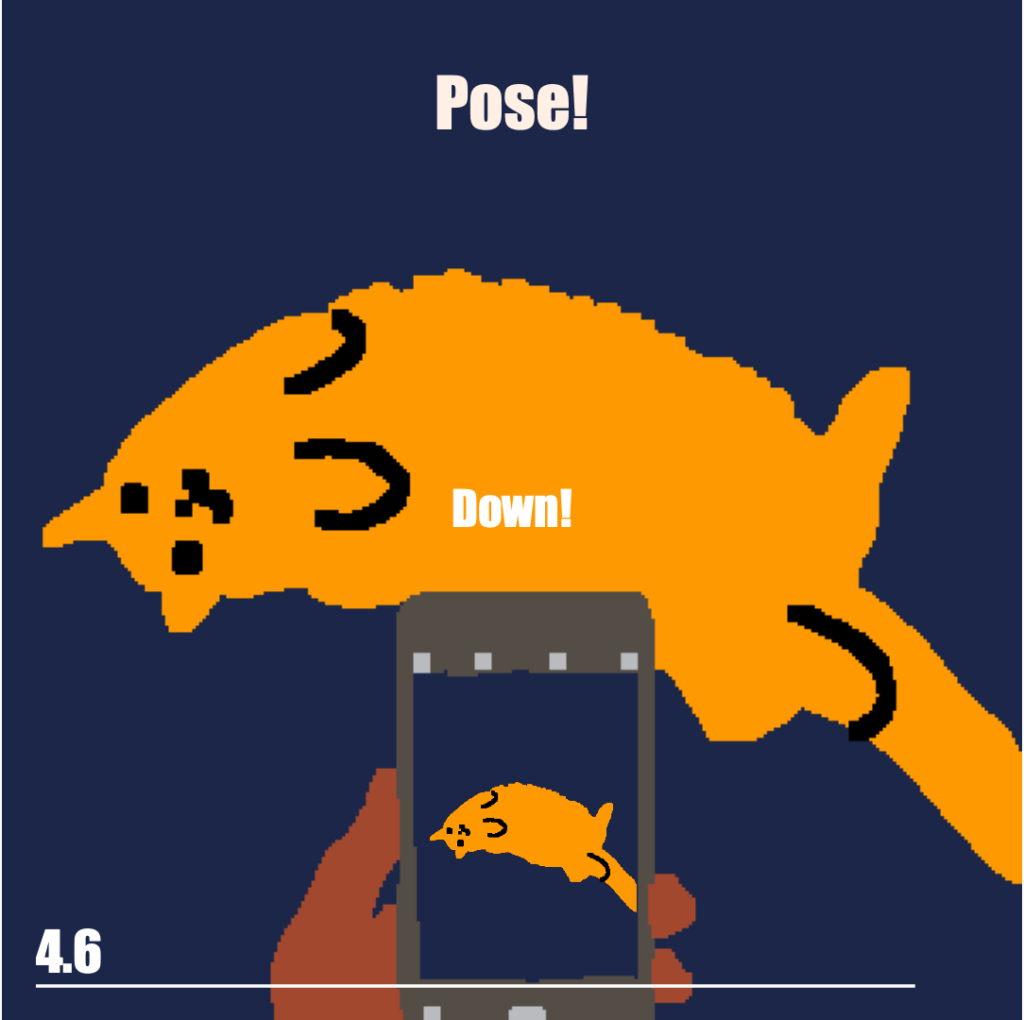
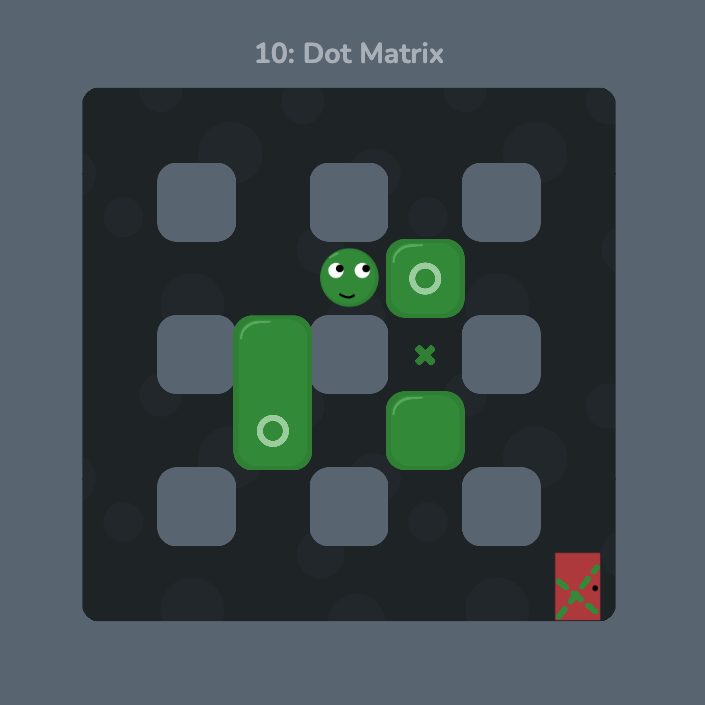
In some ways it’s like working on interactive visualizations, combining creative design with complex programming challenges. Except I can put cats wherever I like. (Something tells me not all of Datawrapper’s users would appreciate that.) You can play them at pawprints.games!
Welcome, Elliot! We’re excited to see how you’ll improve the visualization side of our Datawrapper app. To learn more about Elliot, visit his website elliotbentley.com or follow him on Twitter @elliot_bentley.


Comments