
New in symbol and choropleth maps: cropped view and inset maps
April 12th, 2024
3 min
This article is brought to you by Datawrapper, a data visualization tool for creating charts, maps, and tables. Learn more.
How to integrate data hubs with Datawrapper
With the release 1.5.3 we are introducing a simple way to feed data into Datawrapper.
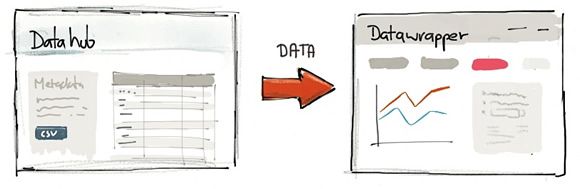
For a moment, imagine that you are running a data hub, a software for collaborating on gathering, sharing and using data. Naturally you would like to see all that data being used in the wild, for instance in visualizations embedded into blogs or shared in social media. And you know that tools like Datawrapper are created for that exact purpose. But to visualize your data in Datawrapper, your users would have to go to a number of steps:
Since time and motivation are often limited resources, we thought it’s a good idea so simplify this process. After all, you as the data provider already have the data and the metadata in a structured format. So why not take that hurdle out of your users way and let your website feed the data into Datawrapper directly?
Feeding data into Datawrapper can be done by sending a simple POST request to http://datawrapper.de/charts/create. Nothing else needed. To send this request you can either set up a simple HTML form or use JavaScript. Your users are then redirected to Datawrapper jumping right into the visualizing step, with the dataset already set up for them.
Here’s a sample form as the data hub could render it with the data:
So the only thing visible to the user would be a simple form submit button.

Sure, below you find a simple demo for how you use a HTML form to feed data into Datawrapper. Of course in a real example you would probably hide the form elements or fire the request using JavaScript, but you’ll get the idea.
The following table lists all the parameters that can be set using the request. Depending on what parameters you provide the user will be directed either to the describe or visualize step of the chart editor.
Request parameters
data – the dataset in CSV formattitle – if the dataset has a name, you can set it as chart title (optional)source-name – the name of the organization providing the data (optional)source-url – the link back to the original dataset (optional)type – the chart type, which can be line-chart, bar-chart, column-chart, grouped-column-chart, stacked-column-chart, pie-chart, or donut-chart (optional)Feedback is welcome!
We’re interested in what you think about this, so please let us know in the comments or on Twitter. what you think about this idea, and if you actually going to integrate this in your website.


Comments