Fix my chart » Compact tables

Welcome back to Fix My Chart, an advice column for all your data visualization questions. We look at real charts, maps, and tables, and figure out how to solve their problems together. Does your chart need a tune-up? Write in here!
Hello Rose,
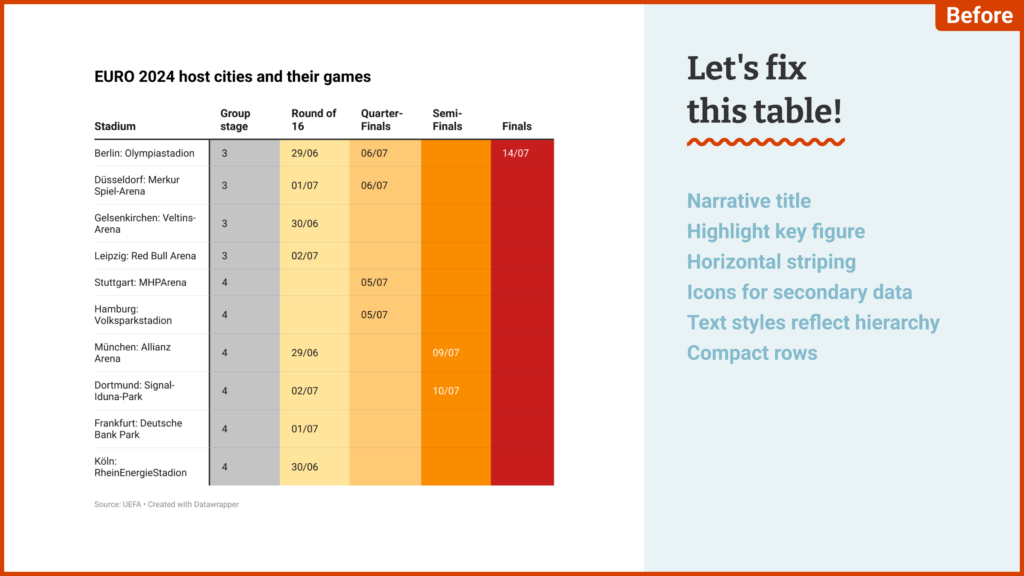
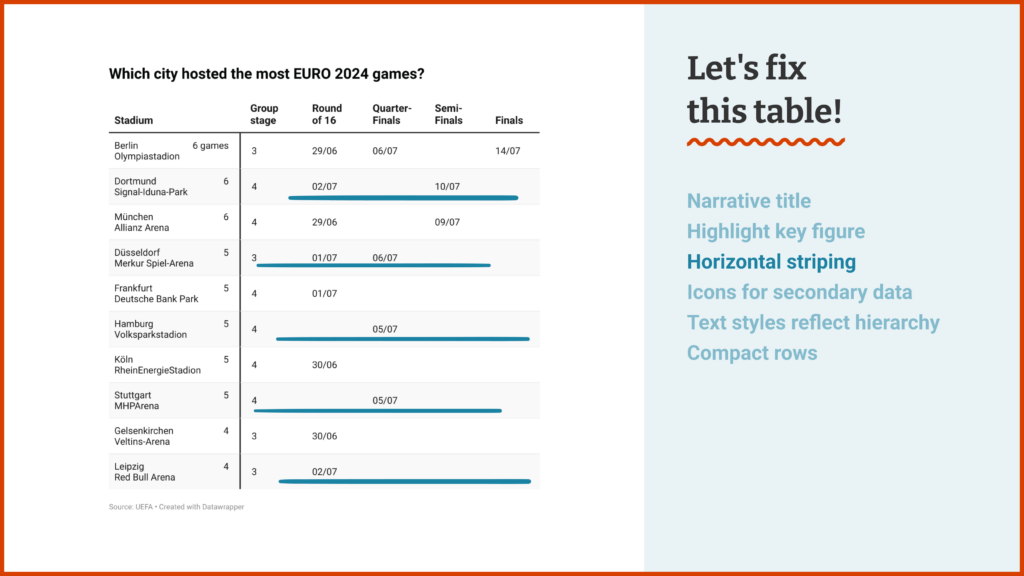
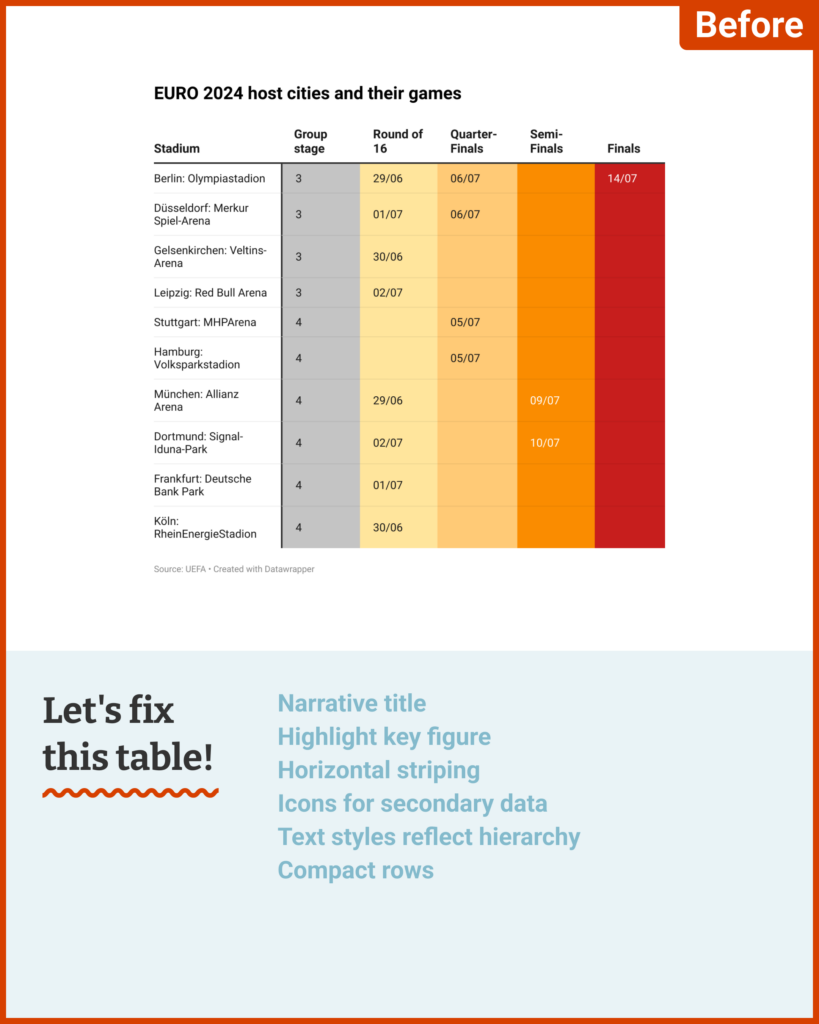
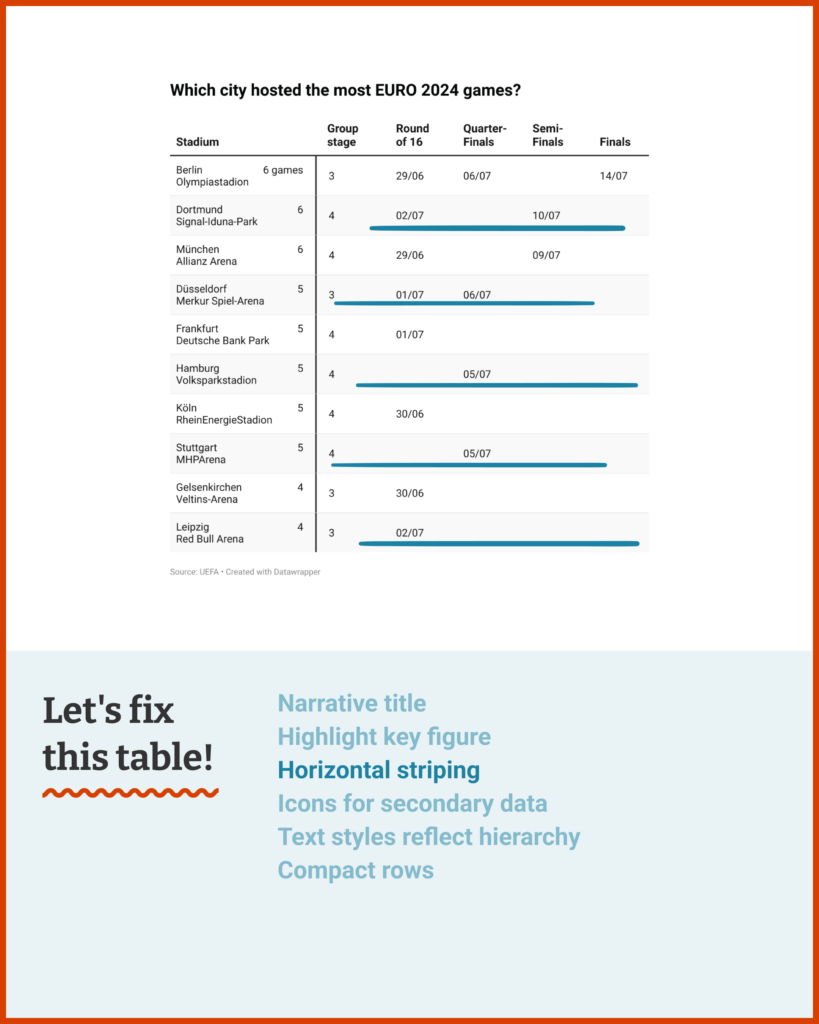
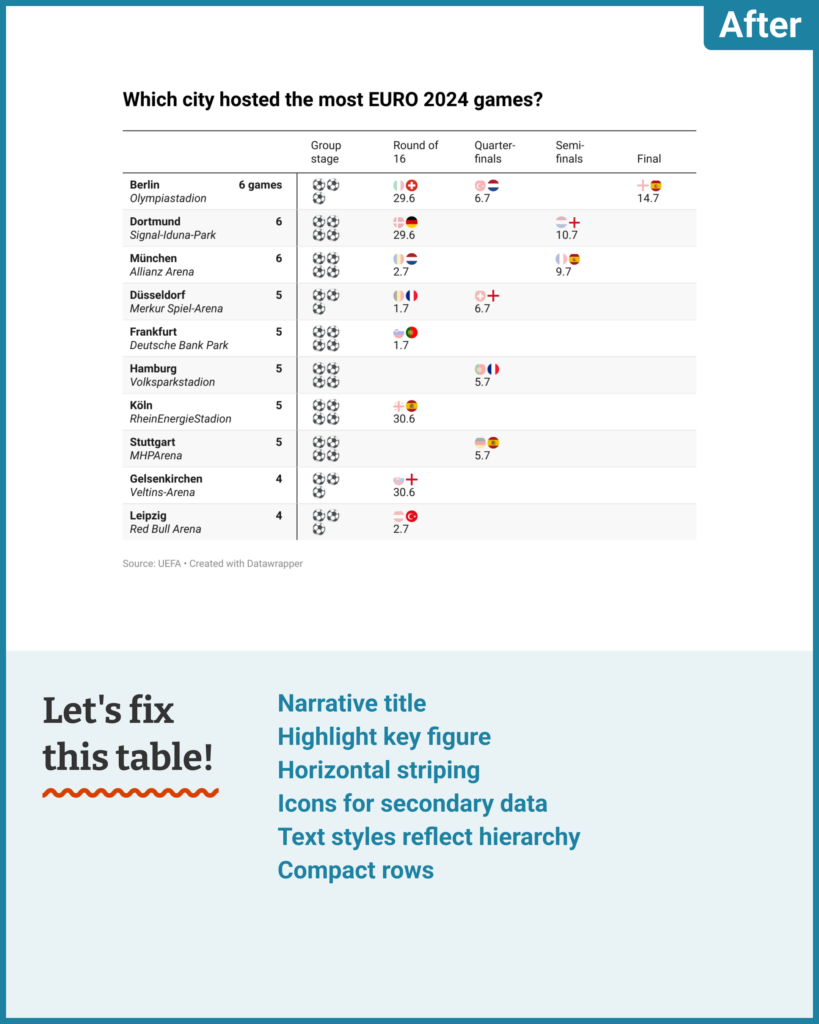
I don’t have a chart, but I have a table for you to fix. It’s a very simple table. I want to show which German city hosts the most games. I included the dates to give more information.
But it looks not a great as other tables I’ve seen? I tried colors to make it more interesting. I like them. But it still looks boring? What can I do? Plus, it looks messy on mobile…
Thanks,
Michael
Dear Michael,
The first time we see our data, it's often in a spreadsheet form. When that spreadsheet gets transformed into a map, scatterplot, or line chart, it's easy to separate the data and the visualization in our minds. Somehow that's harder with a table. Tables can look so much like spreadsheets — but they really don't have to.
Just like any other visualization, a table doesn't simply list facts — it actively interprets your data and communicates that interpretation to a reader. That means deciding what you want to say, saying it clearly, and making sure your design choices support the point. And of course, an appealing look will never hurt!
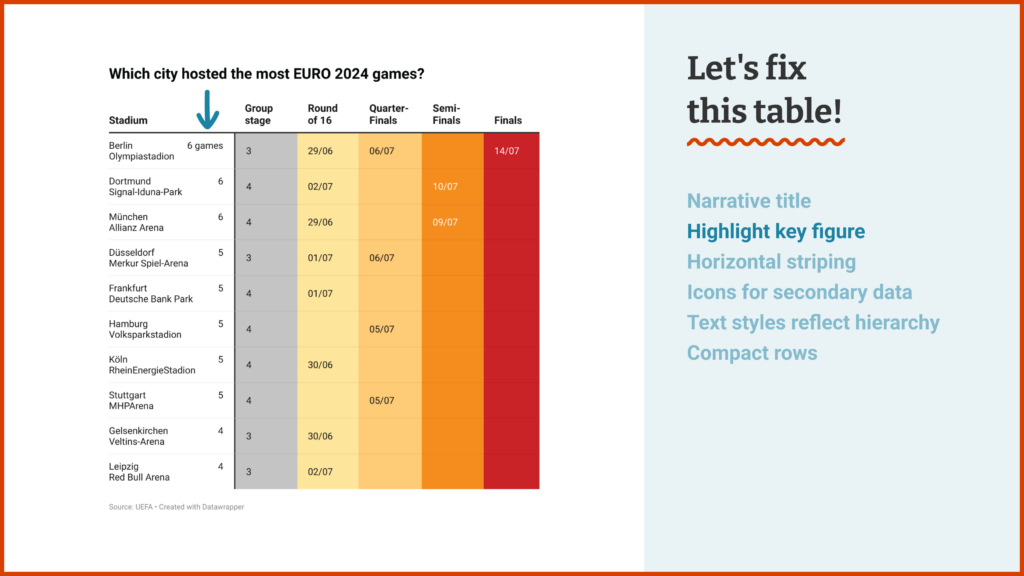
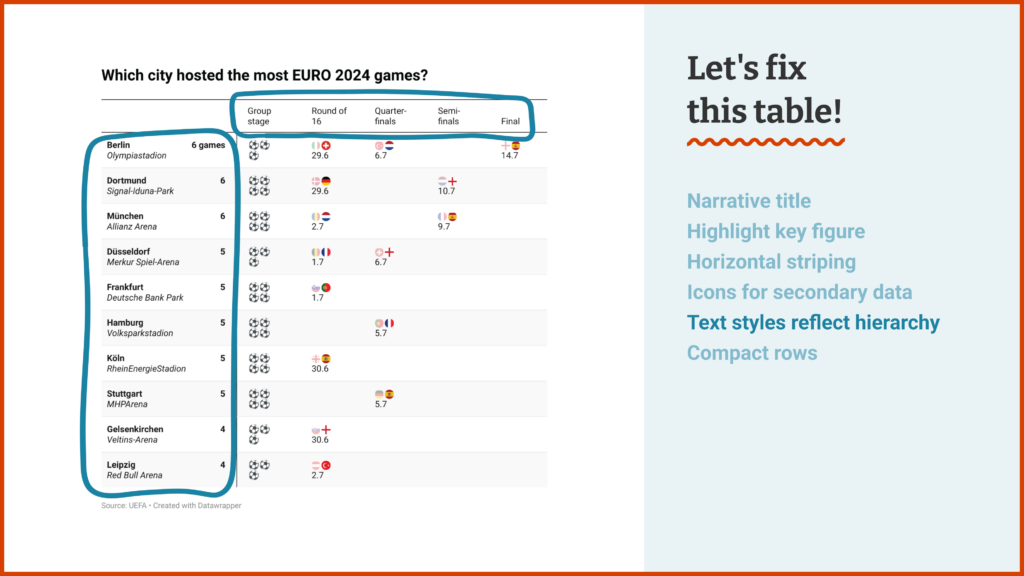
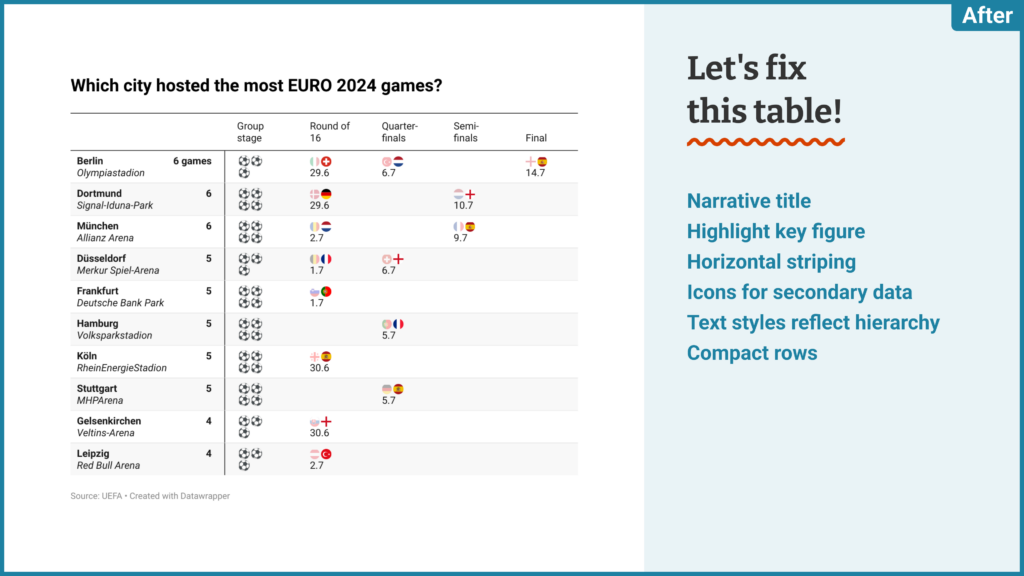
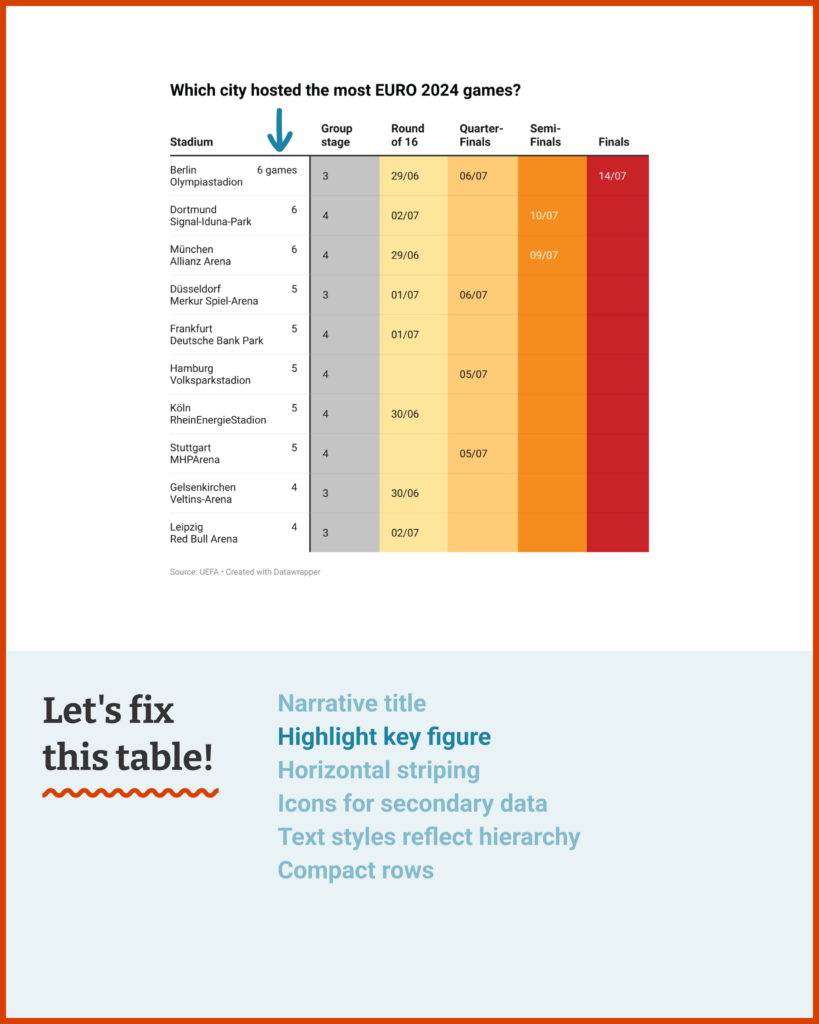
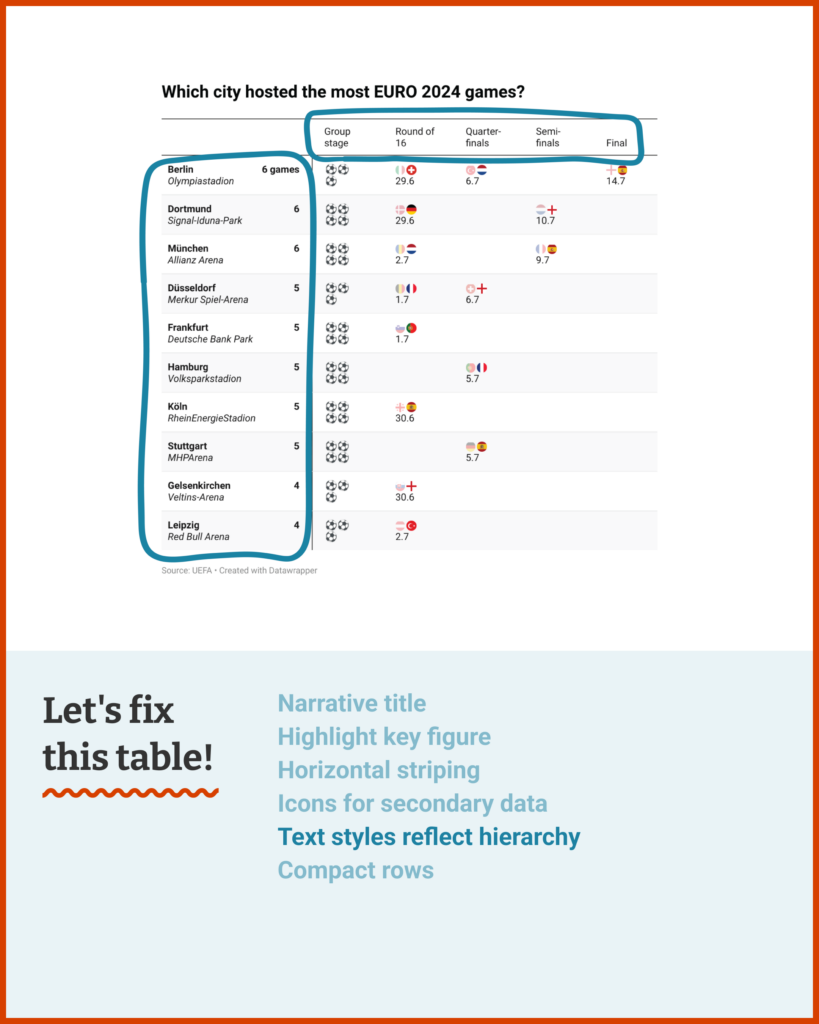
- You've got the first part down: "I want to show which German city hosts the most games." Let's add a column to do just that. Don't think of it as repeating the information in the rest of the table, but as explaining why it's even there.
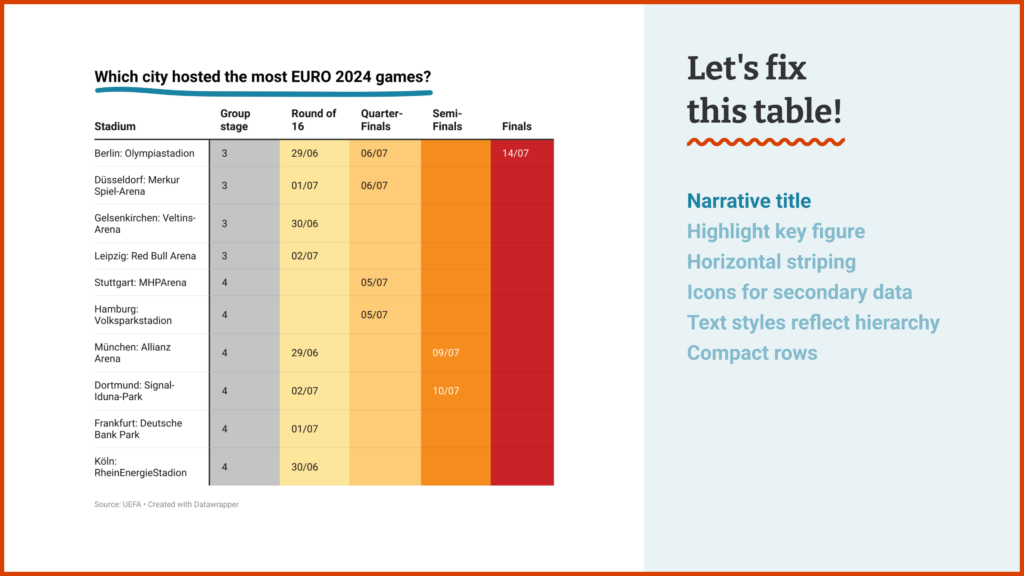
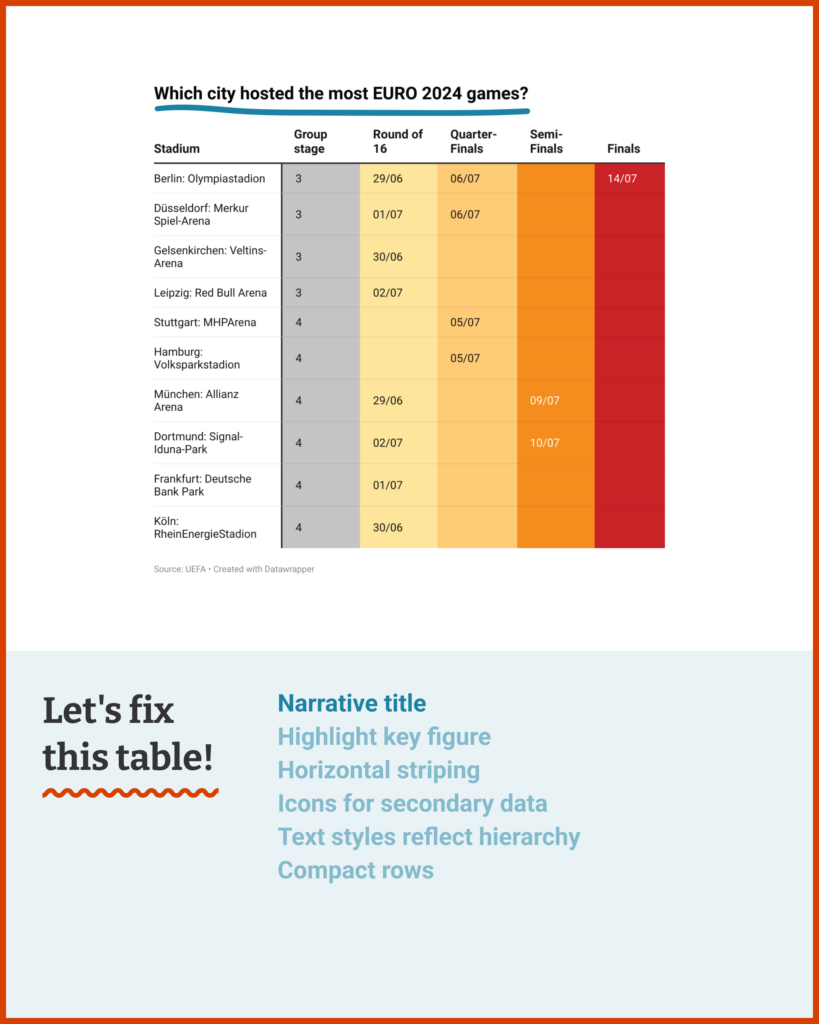
- That goal doesn't need to be a secret either — use the title to say it loud and clear.
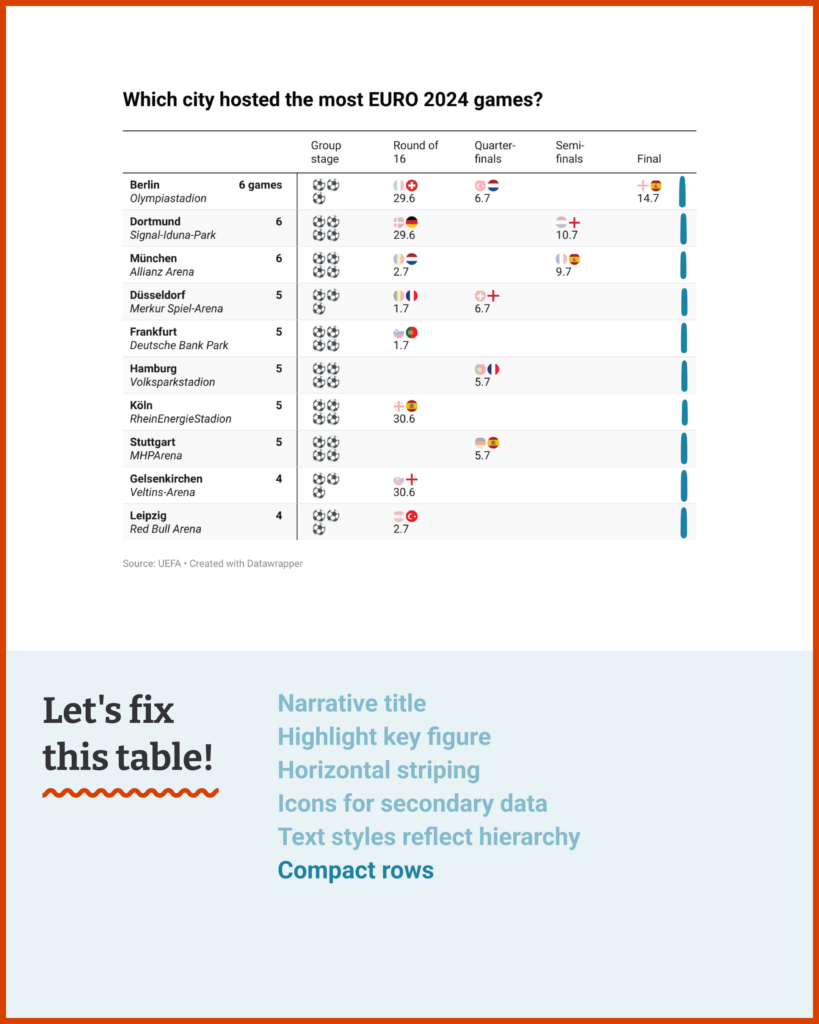
- This table has plenty of horizontal room, so it's already easy for the eye to follow its columns up and down. Instead of reinforcing the columns, let's use background stripes to help the reader follow rows instead.
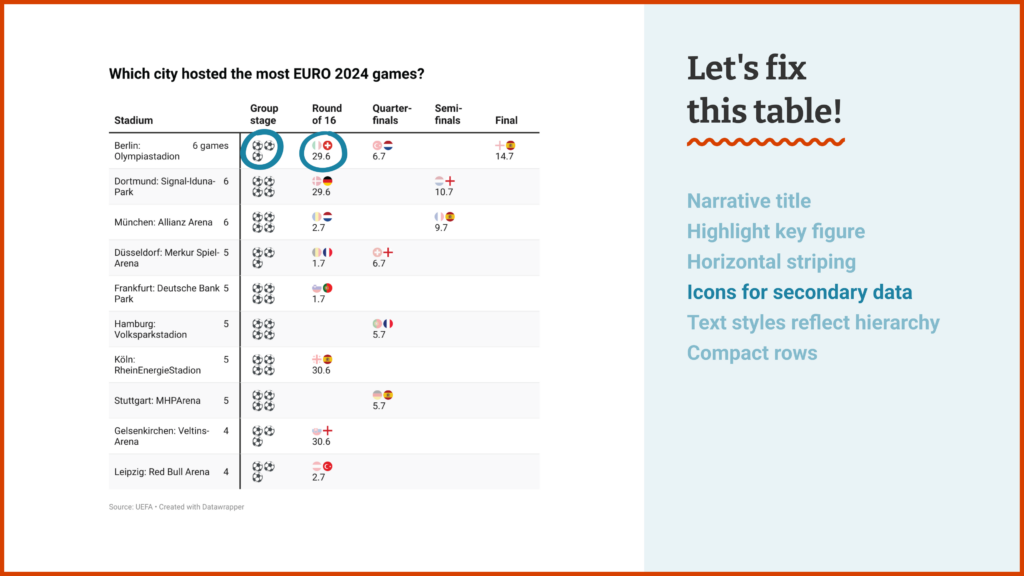
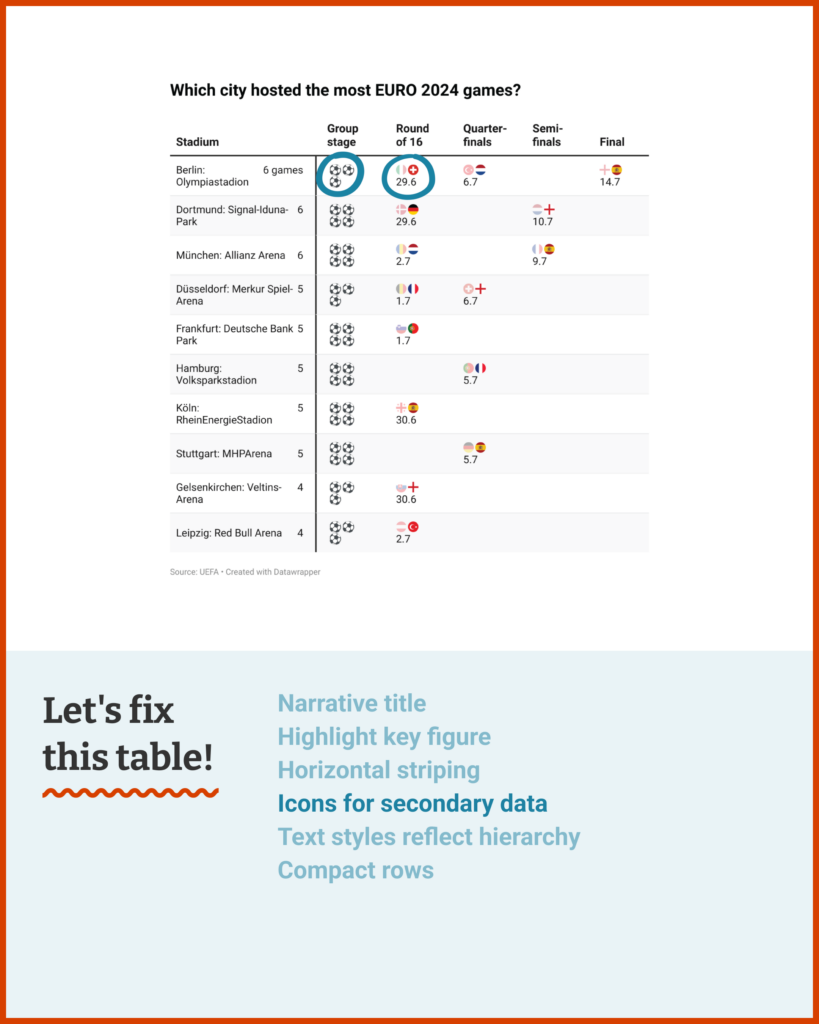
- You can get your visual interest back by using icons to represent the group stage and adding flags for the outcome of each knockout game. With the total games clearly listed, you can afford to have some fun here!
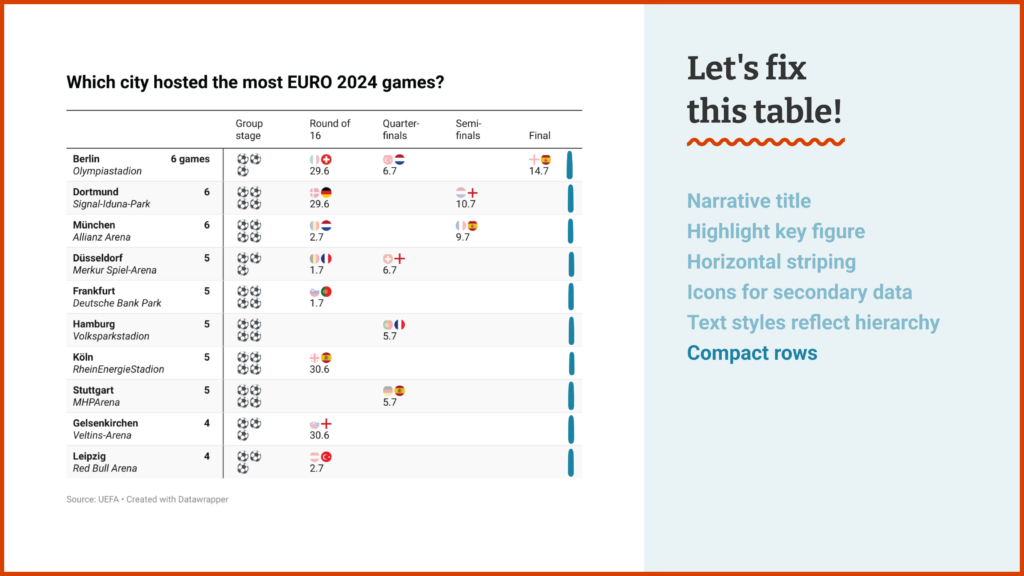
Here’s what I came up with. For everyone reading along, hover over the top right corner and click “Edit this chart” to see how it's done in your own Datawrapper account.
Til next time,
Rose
My mailbox is open for your letters with questions, struggles, and every kind of data vis consultation. I’m looking forward to hearing from you!


Comments