

New: Automatically label data points in line charts
September 18th, 2024
3 min
This article is brought to you by Datawrapper, a data visualization tool for creating charts, maps, and tables. Learn more.
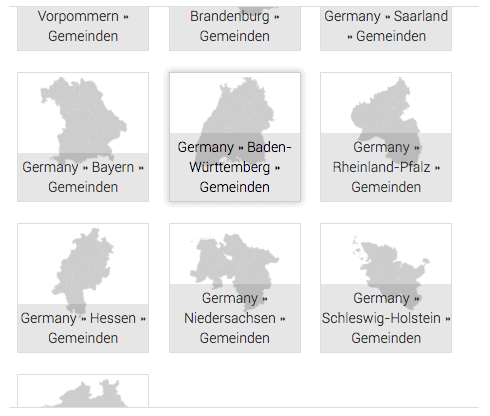
Since launching Datawrapper Maps in March 2016, Datawrapper has expanded its map offering to now over 280 base maps. To make Datawrapper Maps even more useful, we are constantly working on the selection, particularly maps that allow high granularity of map data. Today, we’re adding a much-requested feature: German municipality-level maps.
With this update, Datawrapper now supports three types of maps for data about Germany:
We’re looking forward to continue helping media outlets and newsrooms provide great, accurate maps in minutes, not hours.
All new maps are available for all Datawrapper users.
If you have any questions, don’t hesitate to reach out to support@datawrapper.de or on twitter via @datawrapper.


Comments