This article is brought to you by Datawrapper, a data visualization tool for creating charts, maps, and tables. Learn more.
We’re hiring a senior data visualization developer


Edit: Thanks for your interest in this role! We’ve already closed applications for this job. Check out our careers page to see other open positions we’re filling right now.
Datawrapper’s mission is to help the world create better visualizations. We provide an easy-to-use, free online tool to create charts, maps, and tables. It’s used by thousands of people every day, among them brands like The New York Times, Quartz, and FiveThirtyEight.
We strive to make best-practice data visualization available to everybody. To do that, we’re looking for a talented new team member that can help us build the next generation of data visualization features:
We’re looking for a Senior Data Visualization Developer to join our product development team, 4-5 days a week.
We’re looking for someone with multi-year practical experience in building web-based interactive data visualizations as well as a solid background in information visualization theory. A basic background in cartography is a plus.
You are fit for the job if you are experienced with using:
- SVG and Canvas APIs,
- Modern JavaScript (ECMAScript 2021),
- The D3.js visualization framework, and
- Svelte 3, Vue, React, or a similar reactive framework.
Your theoretical background should ideally include:
- A strong computer science background (including common algorithms, complex data structures, etc.),
- A information visualization background (including visual perception, cognition, gestalt principles), and
- A basic foundation in linear algebra and computational geometry.
We welcome applicants with an innovative and open mindset who can prototype ideas quickly. You can join remotely (in the timezones around Berlin, so GMT, CET or EET) or get a desk in our Berlin office.
What you’ll be working on
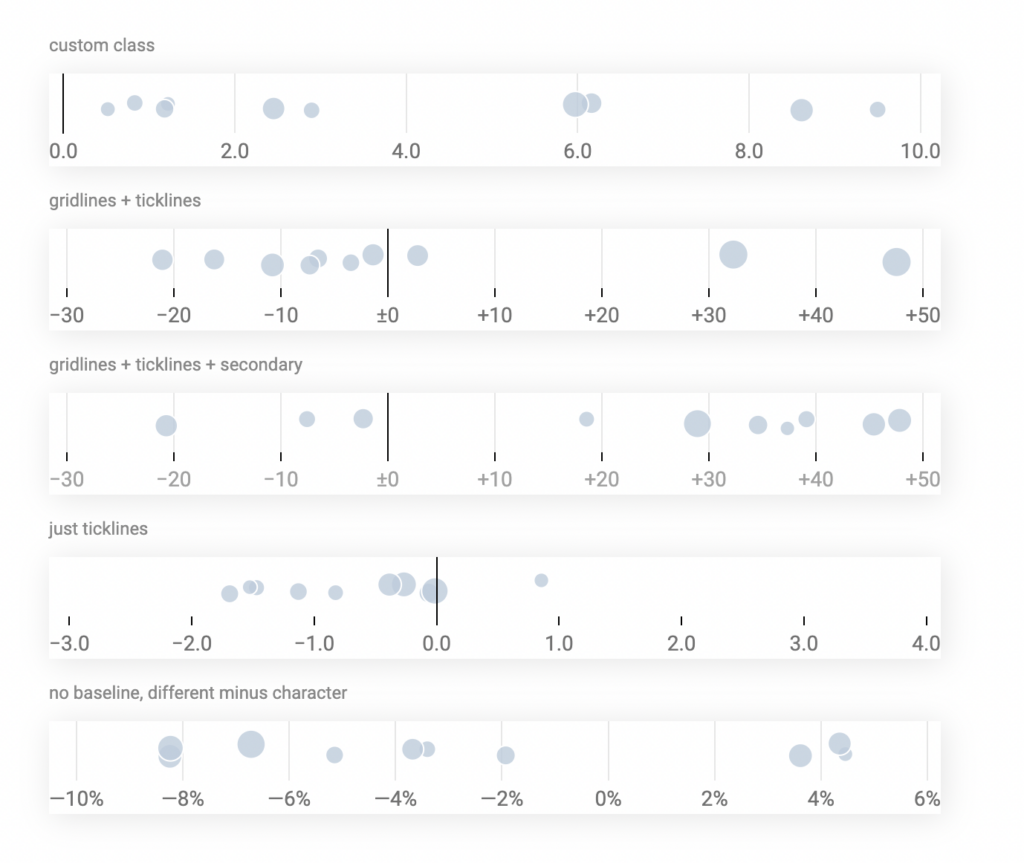
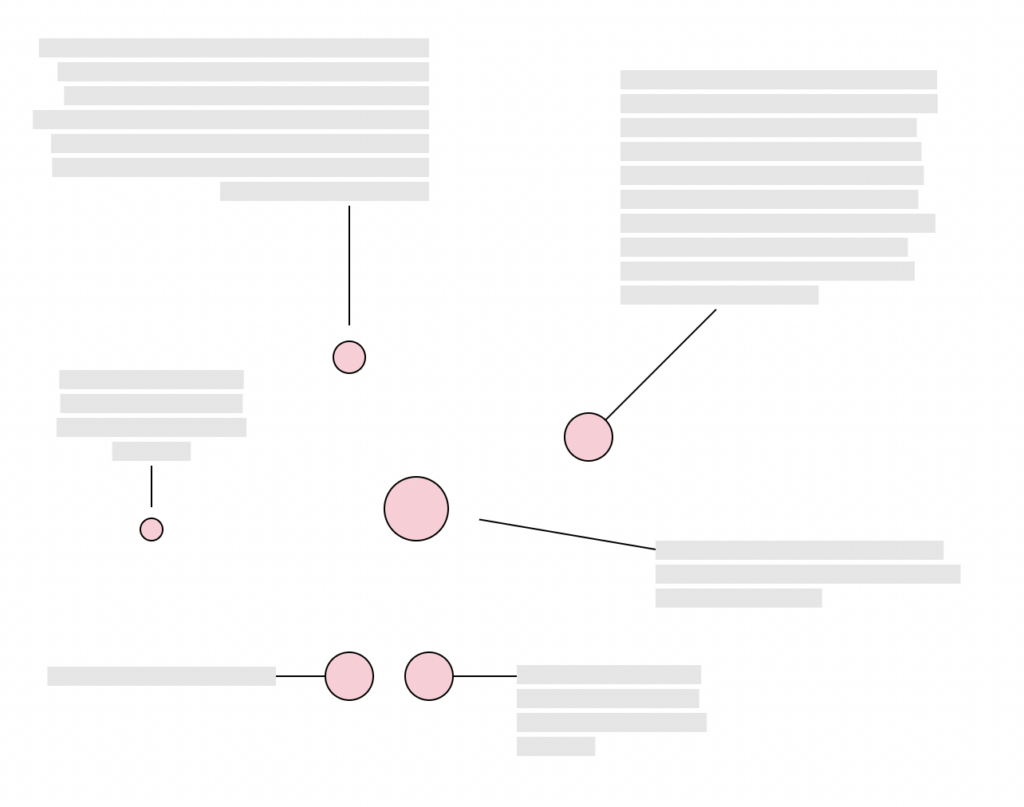
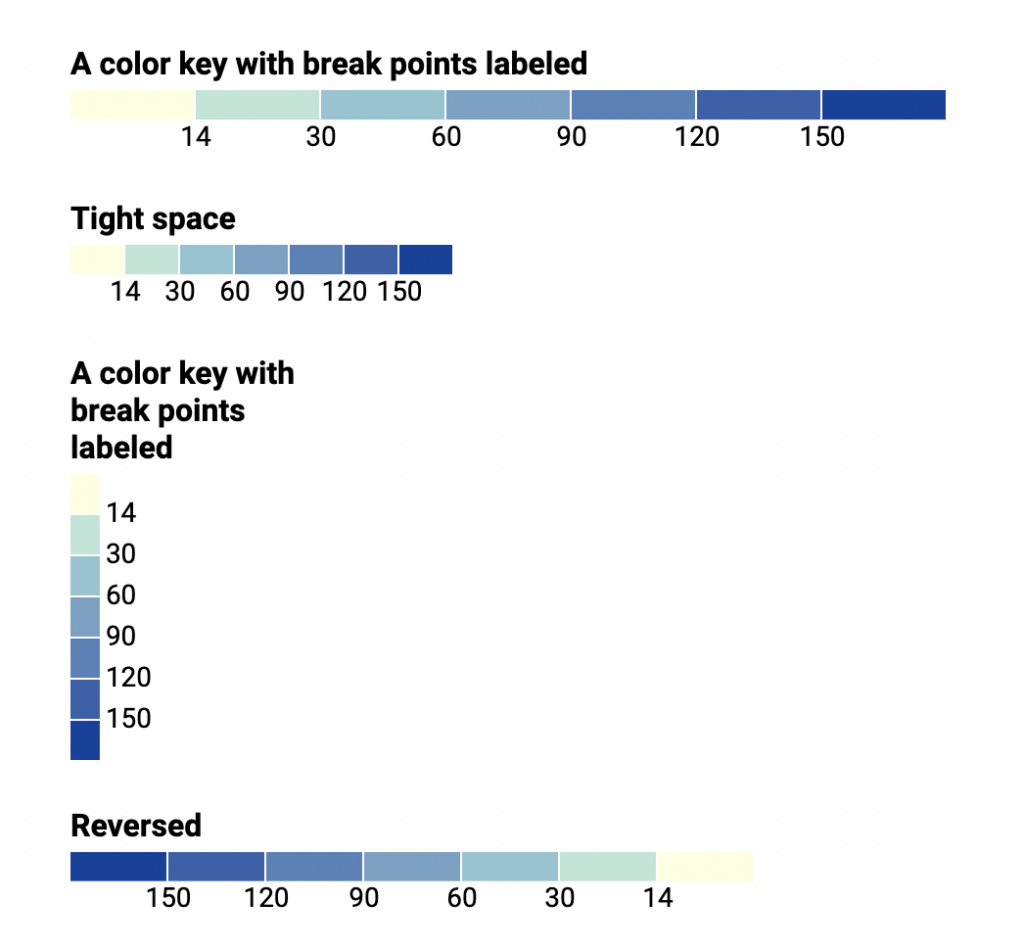
This role will particularly focus on front-end data visualization rendering and display. That includes building new visualization types, extending the customization options of our existing visualizations, and building reusable components for different needs.
What is Datawrapper?
Datawrapper enables people worldwide to build great charts, maps, and tables. We’re used by:
- Media and news publications like The New York Times, The Washington Post, FiveThirtyEight, and Quartz,
- Financial institutions like Fitch Ratings and Moody’s
- Governmental institutions and NGOs like the United Nations, the European Commission, and the World Economic Forum,
- Cities and municipalities like Madrid, London, and New York City,
- And many more, including statistical offices, market research firms, and design agencies.
We’re a team of 17 people, mostly developers and designers. Many of us have a background in journalism — and all of us are excited about visualizing data.
What to expect from working at Datawrapper
A happy work life! Datawrapper team members appreciate a shared feeling of doing meaningful work, a high degree of freedom, their helpful coworkers, and a nice work environment.
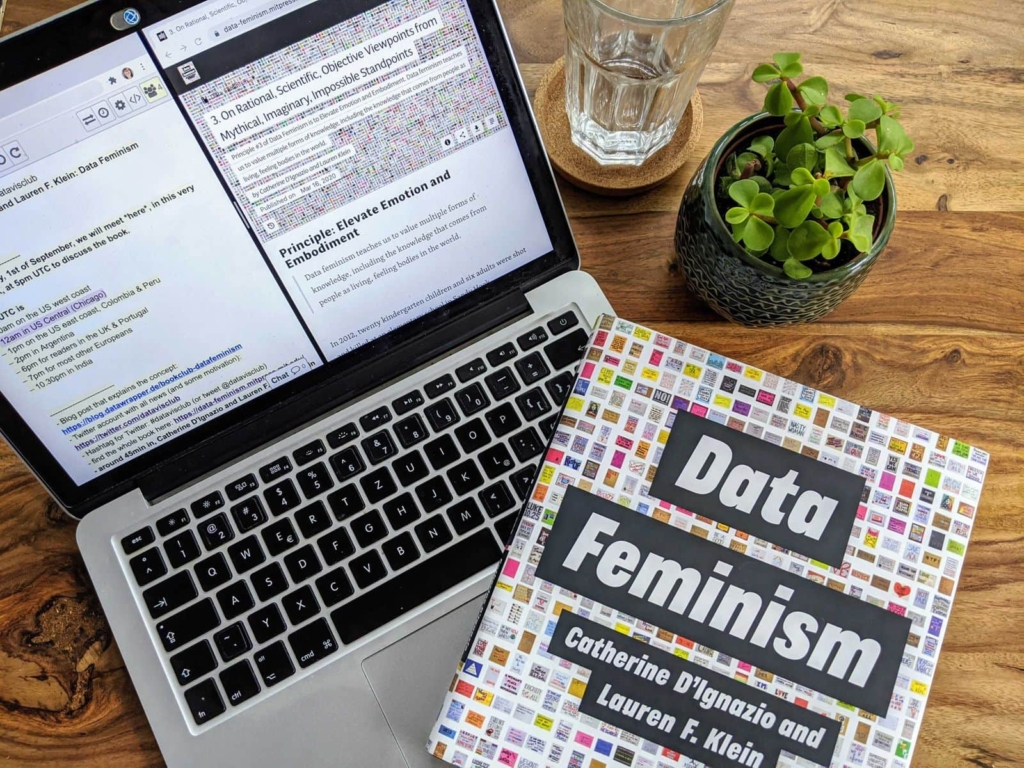
If you’re into data visualization, you’ll like our office with its large library of data vis classics and data-vis-centric lunch conversations. We also organize a data vis book club.
- Growth, development, and personal initiative. We’re a small startup, which means there are lots of opportunities to grow and learn. If you’ve got an idea and the drive to make it happen, we welcome it.
- Few meetings. We try to keep meetings infrequent and short. Instead, we believe in written discussions, good meeting preparation, and short 1:1 check-ins.
- Competitive compensation and benefits, including 30 days of paid vacation, a 2000 euro education budget, and the latest and greatest hardware of your choice.
How to apply
Does all of this sound like something you’d like to do? Great!
Send along your CV and tell us about your previous experience and how you think it makes you a good fit for this role.
→ Send it all to jobs@datawrapper.de with the subject line “Senior Data Visualization Developer”
We hope you apply, especially if you’re from a group that’s underrepresented in our office.
We’re looking forward to hearing from you!
– David, Gregor, and the Datawrapper team


Comments