

Radish to romanesco: A year in vegetables
February 20th, 2025
4 min
This article is brought to you by Datawrapper, a data visualization tool for creating charts, maps, and tables. Learn more.
Hello lefties, righties, and everyone in between and outside. I’m Antonio Sarcevic, a developer in Datawrapper’s app team, and today we’ll be taking a look at the history of left-handedness and other marginalized groups.
There’s this one line chart that I’ve often seen shared by people on social media when talking about discrimination, stigma, and acceptance:
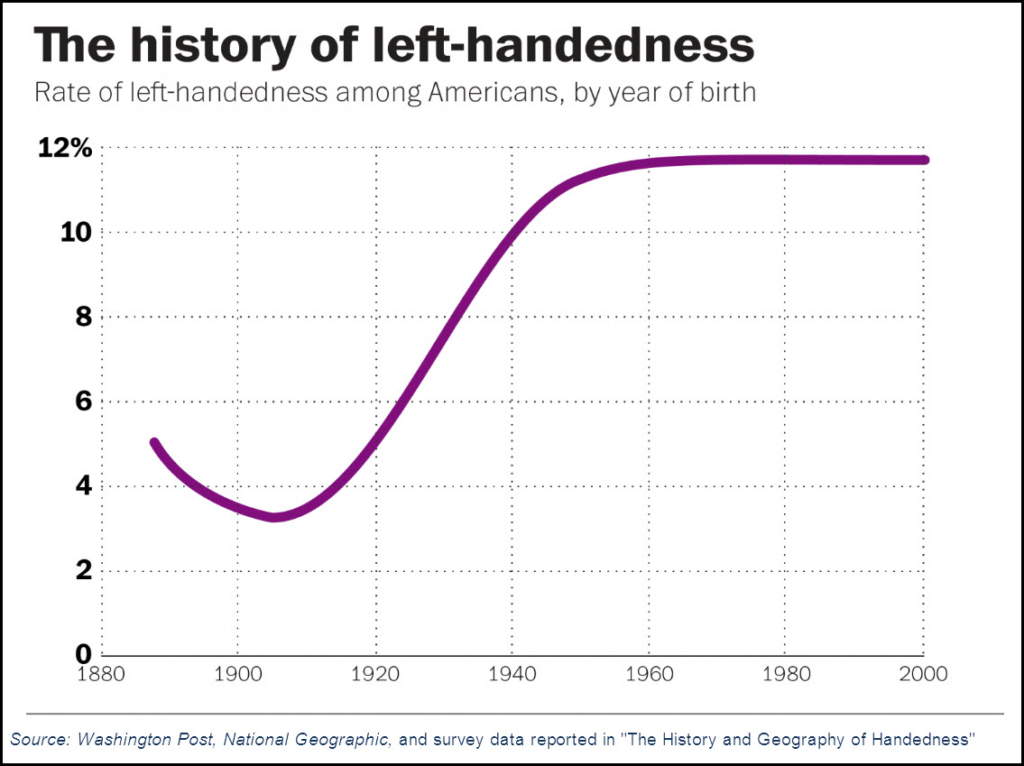
It’s called “The history of left-handedness” and shows the “[r]ate of left-handedness among Americans, by year of birth” from about 1880 to 2000. The exact visualization I see shared most often is from the Washington Post article “The surprising geography of American left-handedness,” which uses data from a paper called “The history and geography of human handedness” by Ian Christopher McManus. It describes the trend as follows:
[R]ates of left-handedness fell during the late Victorian era, reaching their nadir in the early 1900s. They then rebounded steadily until about the 1950s or so, when they flattened out. McManus theorizes that the late-Victorian dive in left-handedness reflects stigma against southpaws […] He attributes a lot of that to the Industrial Revolution. “Left-handers may also have appeared less capable and more clumsy, as left-handed adults worked on machines that were almost certainly designed with right-handers in mind […]”
The chart makes it seem obvious: left-handedness was stigmatized and people were forced to use their right hands. When you fight the stigma and accept people’s handedness, the number of people openly identifying as left-handed will rise until it reflects the actual rate of left-handedness. Part of the appeal of that story is the obvious analogy with other socially stigmatized traits:
While this data is grouped by generational labels instead of birth years, it seems to be following a similar pattern. As the LGBT+ community has fought to become more visible, more accepted, and less stigmatized, we see a rise in the number of people openly identifying as something other than cisgendered and heterosexual. Compared to the left-handedness chart, it looks like this rate still hasn’t plateaued — a stage we can only expect to reach when being LGBT+ is as fully accepted as being left-handed is today.
But when reading the original paper, I found that this might be only half the story on handedness. McManus shows that geographical differences in rates of left-handedness today can be explained in terms of differences in genetic frequency — and he argues that the same is true for historical differences. It seems that the number of naturally left-handed people might really have been lower during the dip.
How? McManus makes a distinction between direct and indirect social pressure. Direct social pressure would be forcing left-handed people to use their right hands. This definitely happened, but it only changes the phenotype — which hand you use in practice — and not the genes that determine your natural handedness or the handedness of your children.
Indirect social pressure comes from the stigmatization of left-handed people, which could delay them in finding a partner and having children, especially in the nineteenth century. Over time this would lower the frequency of lefty genes in the population, and thus the actual number of left-handed people. According to McManus, "[i]ndirect social pressure, although less brutal than direct social pressure, could be of far greater consequence in its eventual effects.”
I have to say I was surprised. I started out almost convinced that the left-handedness chart is some kind of silver bullet against "gay agenda" arguments, just because it seemed to fit so nicely. But after taking a deeper look at the research and its conclusions, it turns out that social pressure is more complicated than I expected and maybe the analogy with LGBT identification isn't the best argument to make. All this showed me that being open-minded and taking a closer look can help us find more interesting and nuanced explanations that better reflect reality.
Thanks for reading, I hope you enjoyed it! What do you make of this? Do you think we can find this pattern in other marginalized groups? Tune in next week for another fresh Weekly Chart by our writer Rose!


Comments