New: Small multiple column charts in Datawrapper
February 18th, 2025
6 min
Datawrapper lets you show your data as beautiful charts, maps or tables with a few clicks. Find out more about all the available visualization types.
Our mission is to help everyone communicate with data - from newsrooms to global enterprises, non-profits or public service.
We want to enable everyone to create beautiful charts, maps, and tables. New to data visualization? Or do you have specific questions about us? You'll find all the answers here.
Data vis best practices, news, and examples
250+ articles that explain how to use Datawrapper
Answers to common questions
An exchange place for Datawrapper visualizations
Attend and watch how to use Datawrapper best
Learn about available positions on our team
Our latest small and big improvements
Build your integration with Datawrapper's API
Get in touch with us – we're happy to help
This article is brought to you by Datawrapper, a data visualization tool for creating charts, maps, and tables. Learn more.

When you’re visualizing data, you make dozens of small and big decisions – from which chart type to use, to colors, headline, annotations, and so much more. But we all know that not every idea turns out great. Sometimes, you wish to go back in time. So far, you had to reverse the changes manually (taking more time than you have), or remember to create a duplicate of your visualizations before making big changes (ending up with five versions of one visualization in your archive). Not anymore.
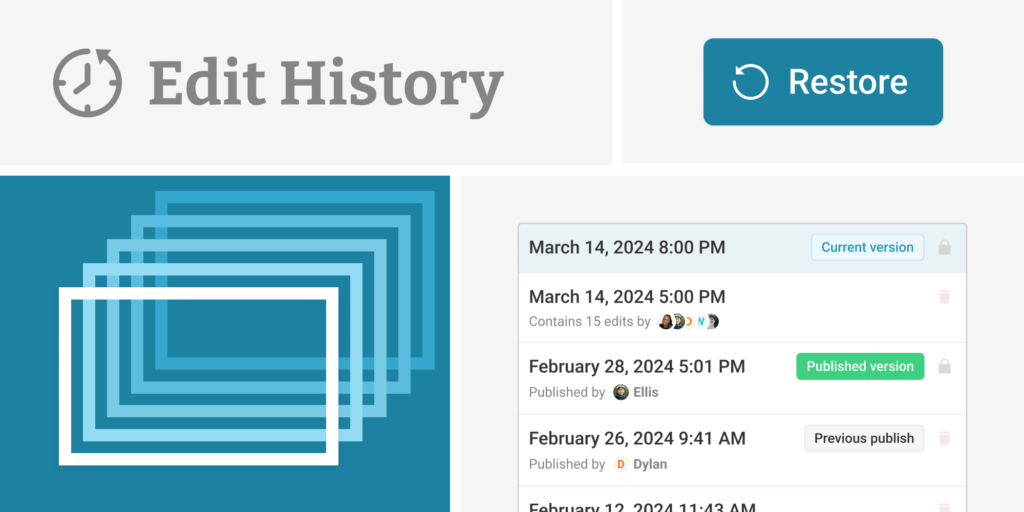
To make sure you can always make changes with confidence, we’re introducing a new feature for all visualizations: the edit history.
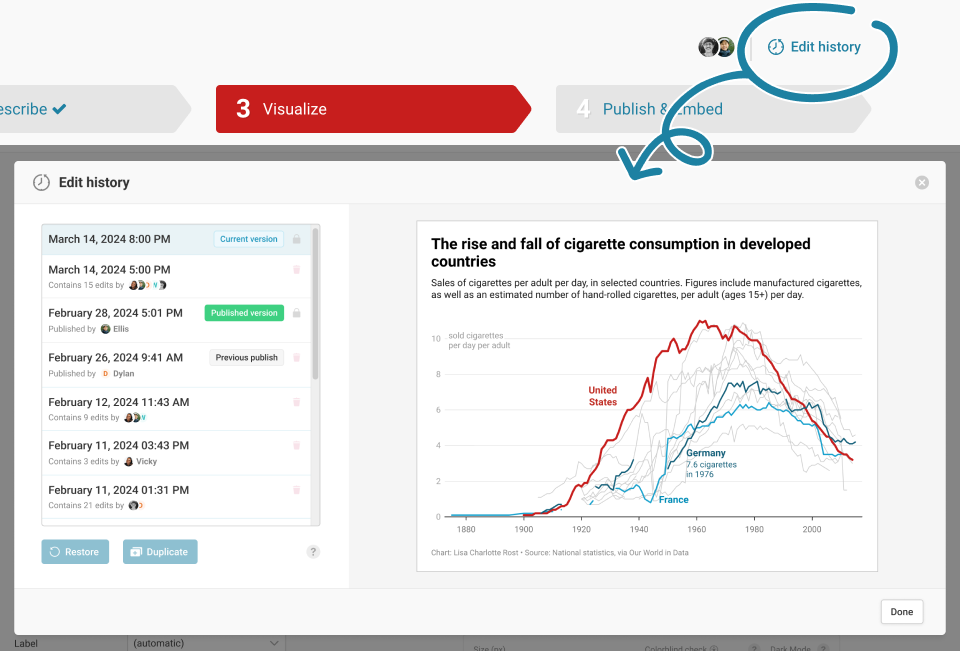
As you’re making edits to your visualization, Datawrapper now automatically keeps storing new versions of your chart, map, or table. This happens after every 30 edits, every time you publish your visualization, when you change the chart type, or when you stop editing for at least one minute. You can access all saved versions with the little Edit history option directly in the visualization editor:

Once you open the edit history, you can select any past version and preview how the visualization looked at that point in time. Then, with one click, you can either restore a past version, or duplicate into a new visualization as another starting point.
Making edits after publication is a big time-saver with Datawrapper: simply make the change you want, and hit Republish to make your new version go live.
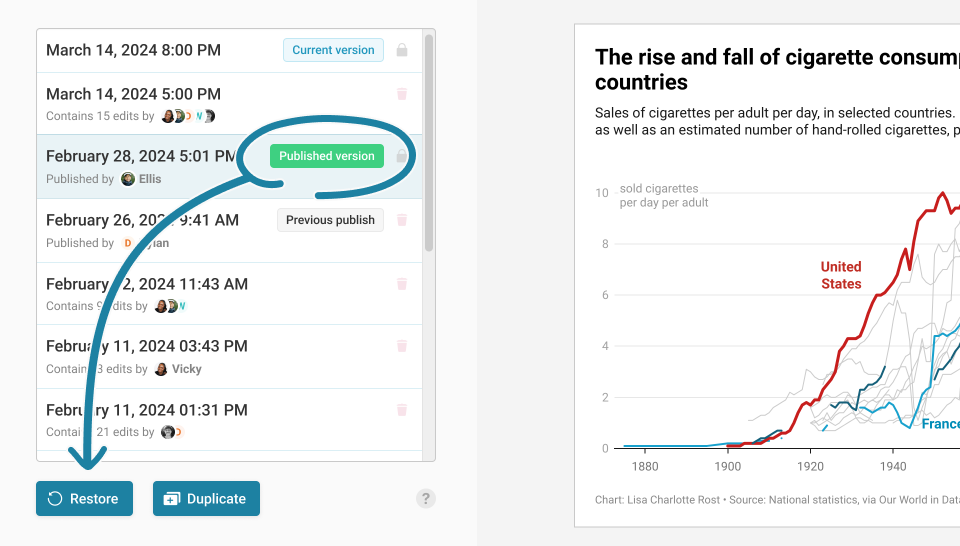
But in case you ever change your mind, you can now revert your visualization to the prior published state:

As Datawrapper’s edit history always includes all past published versions, you can easily reset your visualization to exactly the version that your readers see.
The edit history is now available for all Datawrapper teams and users, and Datawrapper will start storing versions of all your visualizations today. For customers on paid plans, longer version retention is available.
To start using Datawrapper’s edit history, simply open a visualization and make edits – everything else will happen automatically.
We hope you’ll find that live collaboration makes working together in Datawrapper even easier. Let us know if you have any questions or feedback at support@datawrapper.de.
Comments