New: Small multiple column charts in Datawrapper
February 18th, 2025
6 min
Datawrapper lets you show your data as beautiful charts, maps or tables with a few clicks. Find out more about all the available visualization types.
Our mission is to help everyone communicate with data - from newsrooms to global enterprises, non-profits or public service.
We want to enable everyone to create beautiful charts, maps, and tables. New to data visualization? Or do you have specific questions about us? You'll find all the answers here.
Data vis best practices, news, and examples
250+ articles that explain how to use Datawrapper
Answers to common questions
An exchange place for Datawrapper visualizations
Attend and watch how to use Datawrapper best
Learn about available positions on our team
Our latest small and big improvements
Build your integration with Datawrapper's API
Get in touch with us – we're happy to help
This article is brought to you by Datawrapper, a data visualization tool for creating charts, maps, and tables. Learn more.

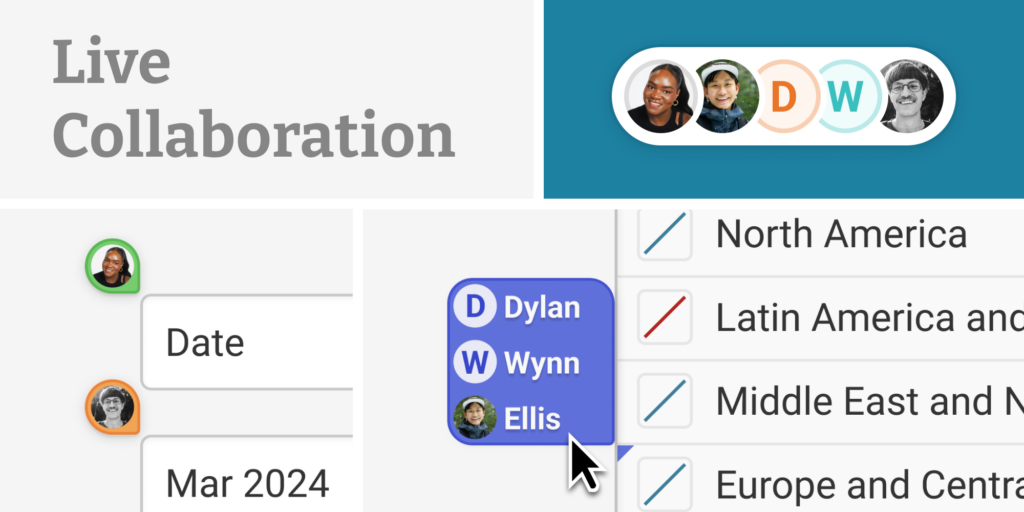
One of the biggest advantages of creating visualizations with Datawrapper is how easy it is to work together: you can store all your visualizations in a team archive, where they can be accessed by your coworkers – all without sending files back and forth. That’s useful when you need a colleague’s help to get the colors or headline of your chart just right, or just to have an extra pair of eyes for a last check before publishing. Today, we’re introducing a new feature that makes all of that easier: live collaboration.

With Datawrapper’s new live collaboration, all your team members can access and edit visualizations simultaneously: everyone is working on the same version, and all edits are immediately visible to every other team member. You can instantly see when your colleague is editing, and they can see yours.
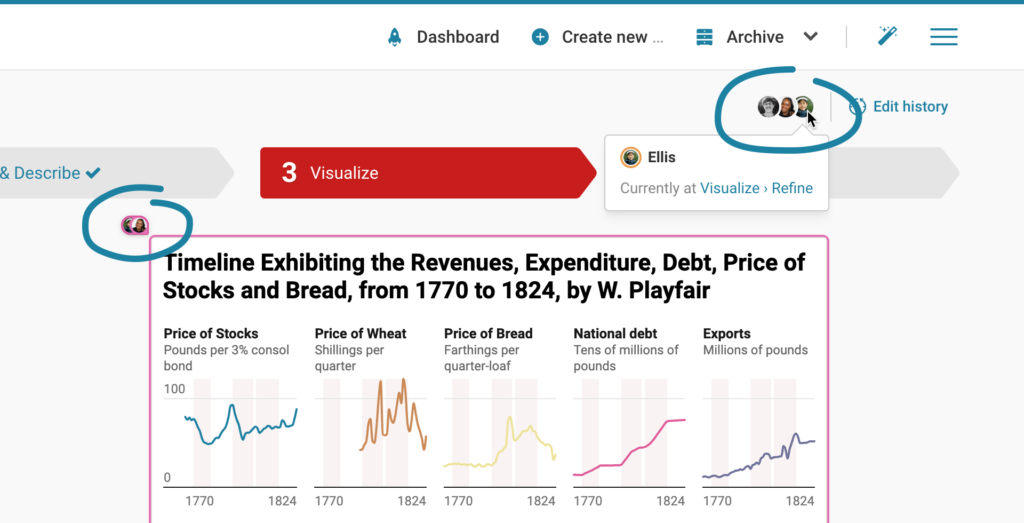
When you’re working together on a visualization with a colleague, you will see their avatar on the settings they are currently working on, to make sure you’re not getting in each other’s way.
This works for all features in Datawrapper: be it uploading data for your charts, fine-tuning the display of your tables, adding markers to a locator map, or adding annotations to explain your visualization – all edits will be synchronized and visible to all your team members in real time.
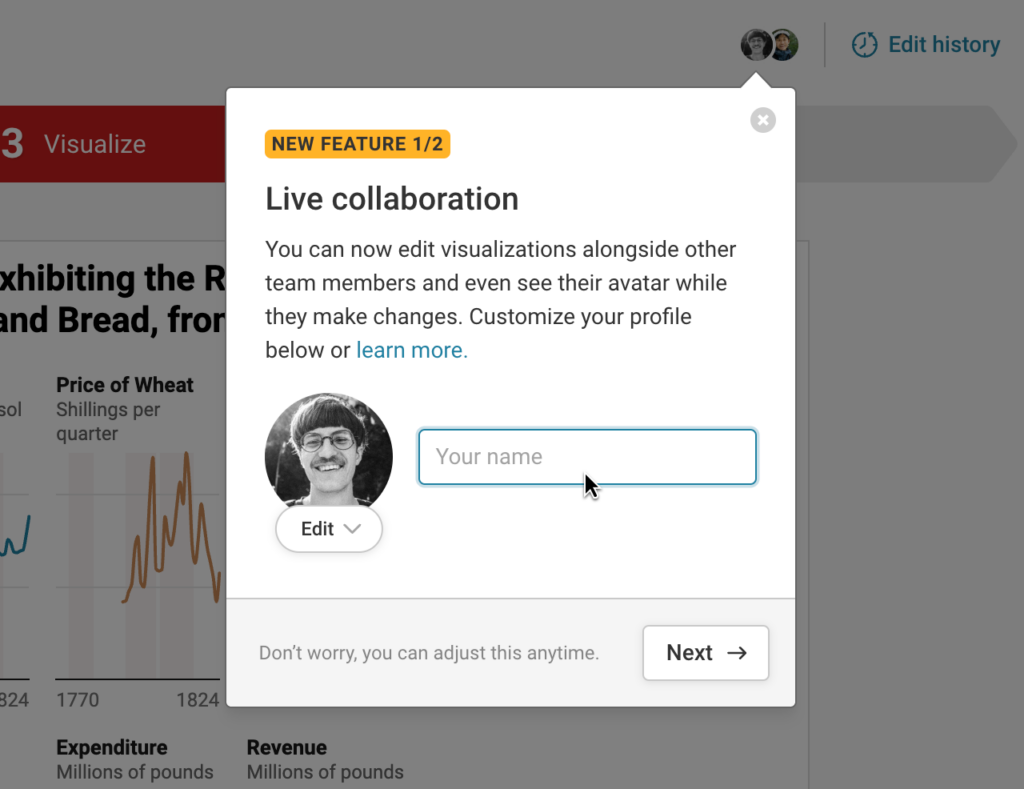
To make it easy to keep track of who’s doing what, you can now personalize your Datawrapper account with your name, profile picture, and a chosen profile color. These will be used to display when you’re making edits to visualizations.

You can define them in your account settings, or provide them in the setup dialog when opening the visualization editor.
Live collaboration is now available for all Datawrapper teams and users, regardless of your chosen plan. To start using it, simply open a visualization stored in a shared folder and start editing it together with your coworkers. Creating teams and inviting colleagues is free on all Datawrapper plans.
Thanks to everyone who worked on his feature: Alexander Käßner, Pascal Bürkle, Jack Goodall, Antonio Sarcevic, Julian Freyberg, Linus Aarnio and David Wendler.
If you have any questions or feedback about collaborating in Datawrapper, don’t hesitate to get in touch at support@datawrapper.de. We’re looking forward to hearing from you.
Comments